Swaps data: anatomy of a wild week in dollar swaps
Chaotic Italian politics jolted rates markets – including US dollar interest rate swaps, writes Amir Khwaja of Clarus FT

The difficulties facing Italy’s new populist coalition dominated the news – and the markets – at the end of May, prompting investors to move money out of euros and into US dollars and US Treasuries. The resulting severe drop in US Treasury yields and swap rates presents an interesting opportunity to look at price and volume data in the dollar swap market.
Tuesday, May 29
Let’s start with Tuesday, the day the market reopened after the US Memorial Day holiday. Dollar swap rates had been drifting down in the prior week with 10-year rates down a cumulative 15 basis points from May 21 to May 25 and daily volumes below or similar to monthly averages on each day in the week. Then, on Tuesday, the market dropped sharply.
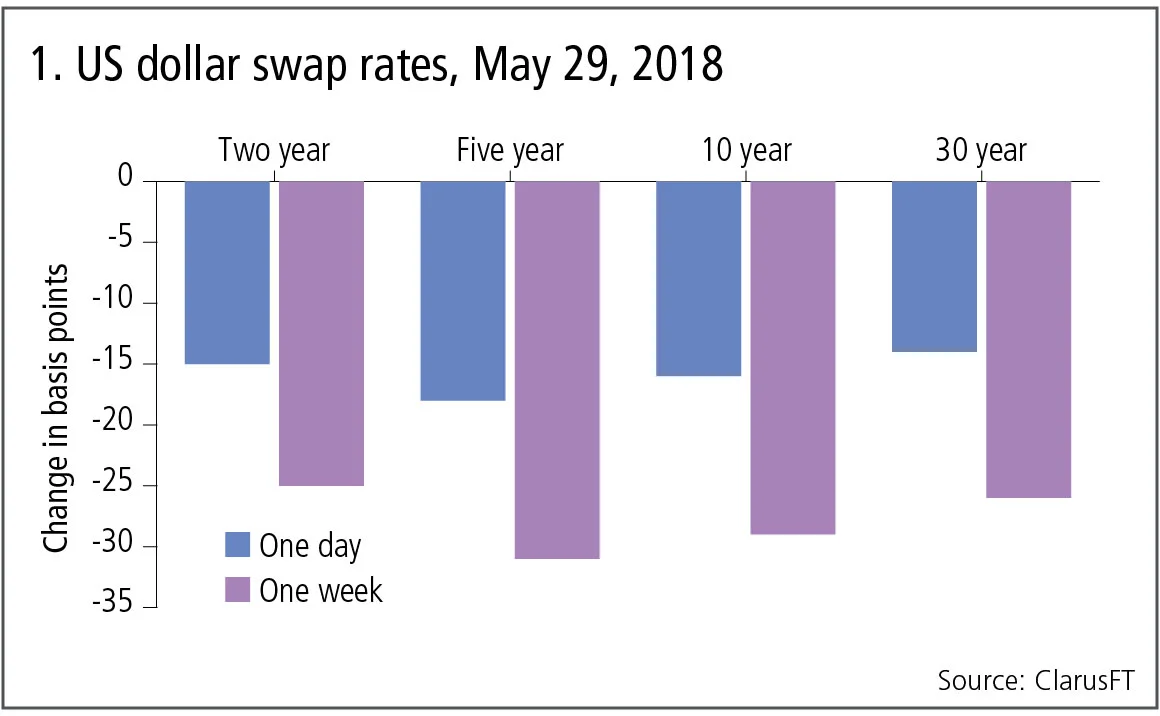
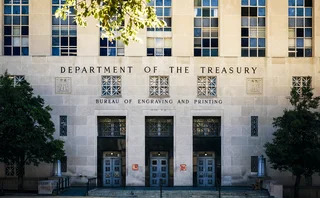
Figure 1 shows:
- Large one-day and one-week falls in swap rates for each major tenor – as a basis for comparison, daily moves are generally less than 2–3bp.
- Five-year swap rates down a massive 18bp at the close on Tuesday from the prior business day and down 31bp over one week.
- Two-year, 10-year and 30-year swap rates with similar drops.
Trade volumes on May 29
Stats from US swap data repositories (SDRs) allows us to build a picture of volume in vanilla spot starting swaps on this volatile day.
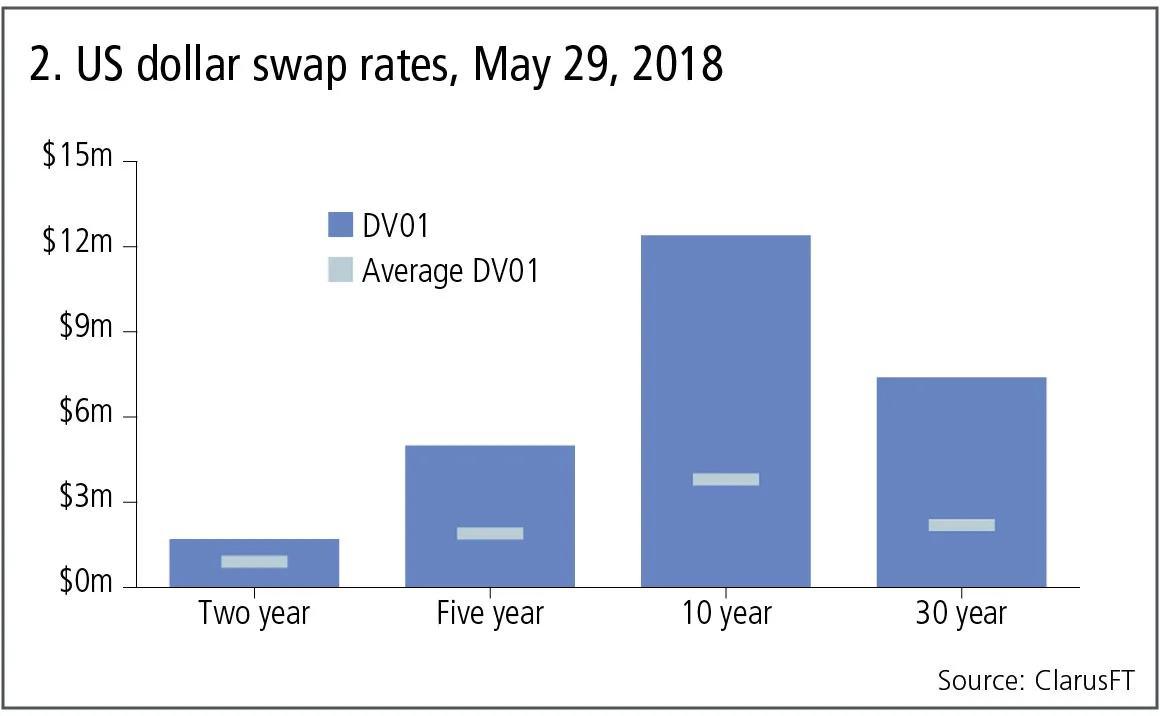
Figure 2 shows:
- Ten-year swap volume was over $12 million DV01 or greater than $14 billion notional, which is over three times the daily average.
- Thirty-year swap volume at $7 million DV01 was also over three times average.
- Two-year and five-year swaps both with elevated volumes.
Drilling down into the 10-year tenor, we can see the intra-day prices of the 240 trades reported by US entities that constitute the $12 million DV01.
Figure 3 shows:
- Rates dropping sharply at the London market open to 2.85%.
- Back up to 2.92% for the start of the day in New York.
- Falling steadily in New York morning, back down to 2.85%.
- Rallying 3bp up for a two-hour period.
- Then falling again to just below 2.8%, before drifting up to 2.82%.
From Friday’s close, 10-year swap rates were down 16bp at the end of Tuesday, a tumultuous trading day.
Subsequent days
Frequently, after a shock in any market, prices snap back on subsequent days, as participants digest news and politicians or central bankers make policy statements – and this is what happened on this occasion.
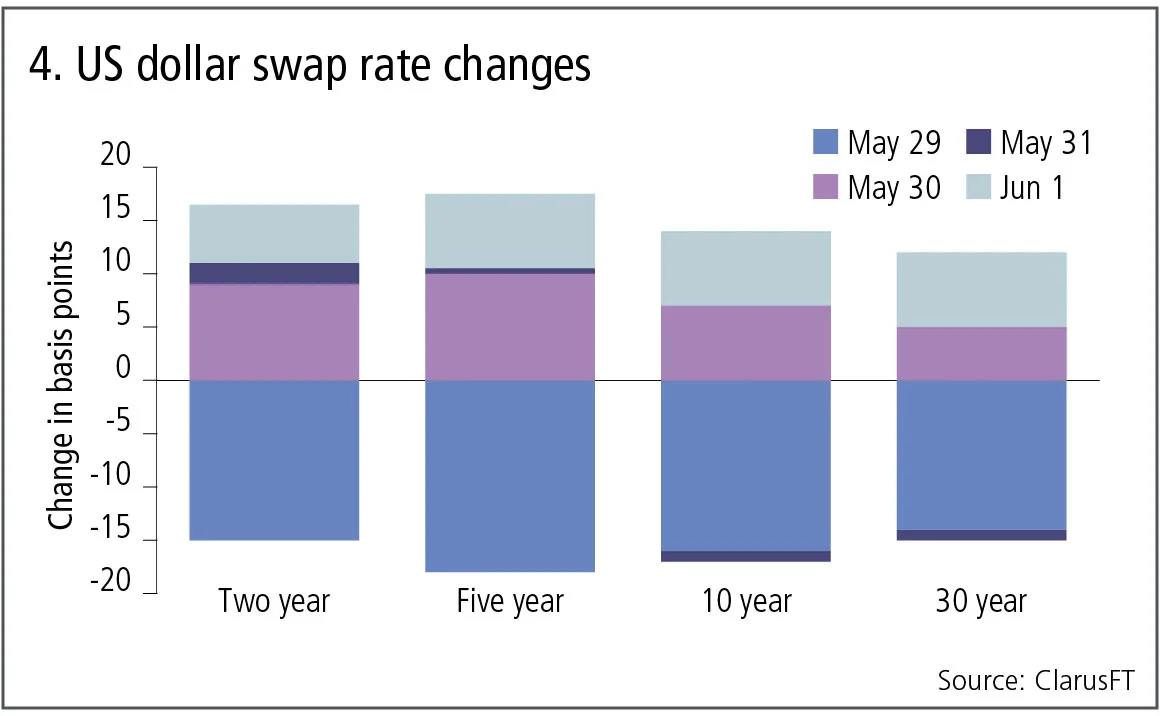
Figure 4 shows:
- After May 29, rates recovered by the end of the week.
- Five-year swap rates – having dropped 18bp – were up 10bp, 0.5bp and 7bp on the three subsequent days to end the week just 0.5bp down.
- A similar pattern for two-year, 10-year and 30-year rates.
In fact, this recovery meant the swap curve was down 5bp in May, compared with a rise of 18bp in April and the 10-year and 30-year benchmarks once again below the significant 3% level.
Let’s also look at volumes on these three days.
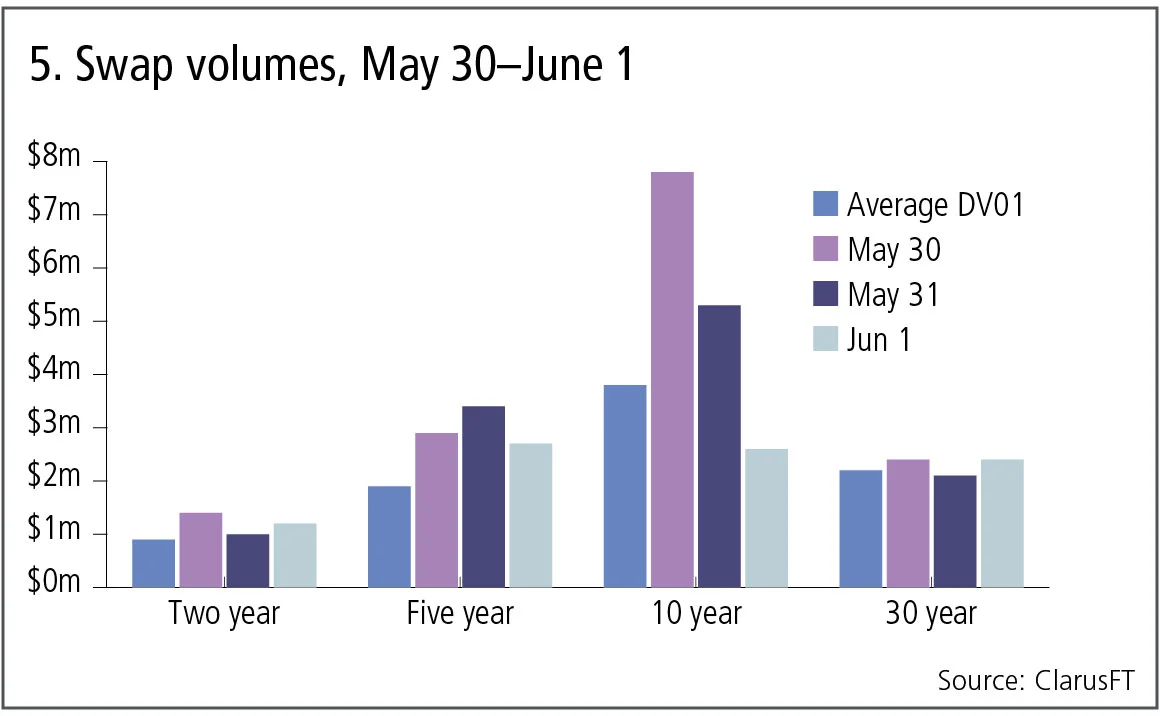
Figure 5 shows:
- Daily average DV01 in millions compared with the actual figure on May 30, May 31 and Jun 1.
- Generally volume was back down to the average for most tenors and days.
- Except for 10-year, which saw twice the average volume on May 30 and almost twice again on May 31, before a lower-than-average day on Jun 1.
Post-trade over-the-counter derivatives data at the transaction level means we can analyse the prices and volume of trades on any tenor and each business day – and can do so, not only the day after it happens, but also during a trading day. Such insight is now part and parcel of trading in swap markets.
Fed rate expectations
The prices of federal funds and overnight index swaps allow us to back out the market’s expectations of rate rises and how these changed over this one-week period. The market assigned a 95% probability on May 21 to a 25bp rate rise at the June 12–13 Federal Open Market Committee meeting, which dropped to a 72% probability on May 29 and then up to 78% probability on June 1. So, a hike is still seen as likely to happen, but it is now less likely than before.
Other markets
We know many other markets saw huge volumes on May 29, with CME reporting a record 39.6 million interest rate contracts traded, almost 50% higher than the previous record on Nov 9, 2016, the day after the US election. Further, CME reports six of its 10 highest-volume days have occurred during 2018.
Market volatility and volume is indeed back with a vengeance in 2018.
Amir Khwaja is chief executive of Clarus Financial Technology.
コンテンツを印刷またはコピーできるのは、有料の購読契約を結んでいるユーザー、または法人購読契約の一員であるユーザーのみです。
これらのオプションやその他の購読特典を利用するには、info@risk.net にお問い合わせいただくか、こちらの購読オプションをご覧ください: http://subscriptions.risk.net/subscribe
現在、このコンテンツを印刷することはできません。詳しくはinfo@risk.netまでお問い合わせください。
現在、このコンテンツをコピーすることはできません。詳しくはinfo@risk.netまでお問い合わせください。
Copyright インフォプロ・デジタル・リミテッド.無断複写・転載を禁じます。
当社の利用規約、https://www.infopro-digital.com/terms-and-conditions/subscriptions/(ポイント2.4)に記載されているように、印刷は1部のみです。
追加の権利を購入したい場合は、info@risk.netまで電子メールでご連絡ください。
Copyright インフォプロ・デジタル・リミテッド.無断複写・転載を禁じます。
このコンテンツは、当社の記事ツールを使用して共有することができます。当社の利用規約、https://www.infopro-digital.com/terms-and-conditions/subscriptions/(第2.4項)に概説されているように、認定ユーザーは、個人的な使用のために資料のコピーを1部のみ作成することができます。また、2.5項の制限にも従わなければなりません。
追加権利の購入をご希望の場合は、info@risk.netまで電子メールでご連絡ください。
詳細はこちら コメント
オペリスク・データ:企業スパイがBBVAに脅威をもたらす
他にも:BofAがエプスタイン氏との関与疑惑で追及されています。また、少数株主がブルックフィールドに異議を唱えています。データ提供:ORX News

AI政治の台頭
MASの顧問であるデビッド・ハードーン氏は、AIを単なる一つの技術として扱うべきではないと述べています

AIリスク管理と能力制御への移行
リスク管理者によると、検証の枠組みを見直すことで、銀行はイノベーションと規制上の要件を両立させ、強固なリスク管理体制を維持することができます

トークン化された商品市場は、経済の円滑な運営に寄与する可能性がある
暗号資産の専門家は、実物資産をブロックチェーンに移行することで、担保に関する摩擦が緩和されると主張しています

GenAIの時代において、未だに優れたモデルが必要なのはなぜなのか?
ジャン=フィリップ・ブショー氏は、モデルが人工知能をレジームシフトの過程で導き、過学習から遠ざけることができると述べています

取引のスピードがガバナンスを上回る時:一瞬の統制の隙間
デリバティブの専門家によると、光駆動型エレクトロニクスの新たな形態が、市場インフラにおける次のリスクとなる可能性があるとのことです

先物とオプションが示す戦争のコスト
現物価格は大きな混乱を示していますが、先物市場はこれが一時的なものだと示唆しており、オプション市場は不安定な状況が続くと示唆しています
担保に関して、TINAはTIAになることができるのか
あるエコノミストは、レポ取引やデリバティブ取引における担保としての米国債の優位性は、もはや揺るぎないものではないと指摘しています