Swaps data: how the market responded to Covid-19
Swap rates saw massive moves as volumes peaked, writes Amir Khwaja of ClarusFT

The Covid-19 pandemic sent swap markets on their wildest ride in more than a decade. As central banks slashed rates to contain the economic fallout, volumes surged, spreads widened and prices gapped. On some days, rates seesawed back and forth as a flight to safety turned into a dash for cash.
Adding to the pressure, a majority of traders were working from home or from back-up facilities during the height of the turmoil. It was the biggest test of market liquidity since the financial crisis, and the reforms that followed.
As the dust settles, we look at how the US dollar interest rate swaps market fared over this critical period in March 2020.
The month began with traders positioning for a rate cut, which came earlier than expected, on March 3. This spooked markets and accelerated the sell-off in risk assets. Cleared US dollar swap volumes, which averaged roughly $250 billion a day prior to February 18, swelled to a peak of $720 billion on March 4.
Volumes fell back to $400 billion to $450 billion a day before hitting a second peak of $600 billion on March 13, as traders positioned for a second rate cut. This came on Sunday, March 15, when the Fed cut its target rate to near zero. Daily volumes were in the $300 billion to $500 billion range for the remainder of the month.
Prices gyrated wildly over this period. The 30-year swap rate dropped 25 basis points on March 6 and 9, eight times the average daily move of plus or minus 3bp. Those were consecutive trading days – a Friday and a Monday – resulting in a 50bp drop over two days.
The intraday moves were also extraordinary. On March 6, the 30-year US dollar swap rate fell from above 1% to 0.86% at the London opening before rising to 0.98% at noon, falling again to 0.81% at 3pm, and then rising back up to 0.95% at 4pm.
There have been reports of market liquidity deteriorating and even seizing up during this volatile period.
My colleague Chris Barnes has some interesting analysis on this on the Clarus blog, which shows that while price dispersion in 10-year swaps tripled from the prior month, volumes were high and markets continued to function through even the most volatile periods.
These were rollercoaster days – kudos to those who navigated them successfully.
Cleared US dollar swaps
First, we’ll look at daily volumes of cleared vanilla US dollar interest rate swaps between February 18 and March 27, 2020.
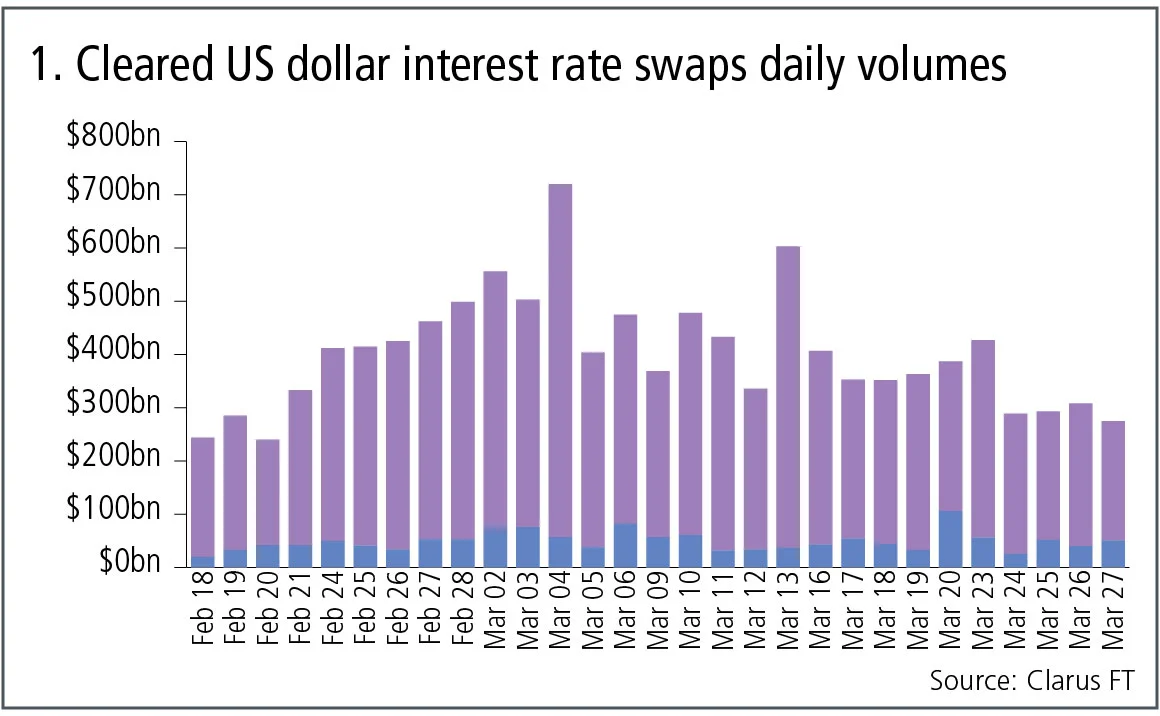
Figure 1 shows:
- Daily gross notional cleared at CME and LCH. Prior to February 18, volumes averaged roughly $250 billion a day.
- From February 21 onwards, we see a steady rise in volumes as participants positioned themselves in the expectation that the Federal Reserve would lower rates.
- After the Federal Reserve’s first emergency rate cut on March 3, US dollar swaps volumes surged to a peak of $720 billion in gross notional terms on March 4.
- After falling back down to late February levels of $400 billion to $450 billion a day, volumes surged again to a second peak of $600 billion on Friday, March 13, ahead of the Fed’s second emergency rate cut on Sunday, March 15.
- Daily volumes remained elevated in the $300 billion to $500 billion range for the remainder of the month.
Maturity tenors
Next, let’s break down the daily volumes for LCH SwapClear by tenor bucket for the same period.
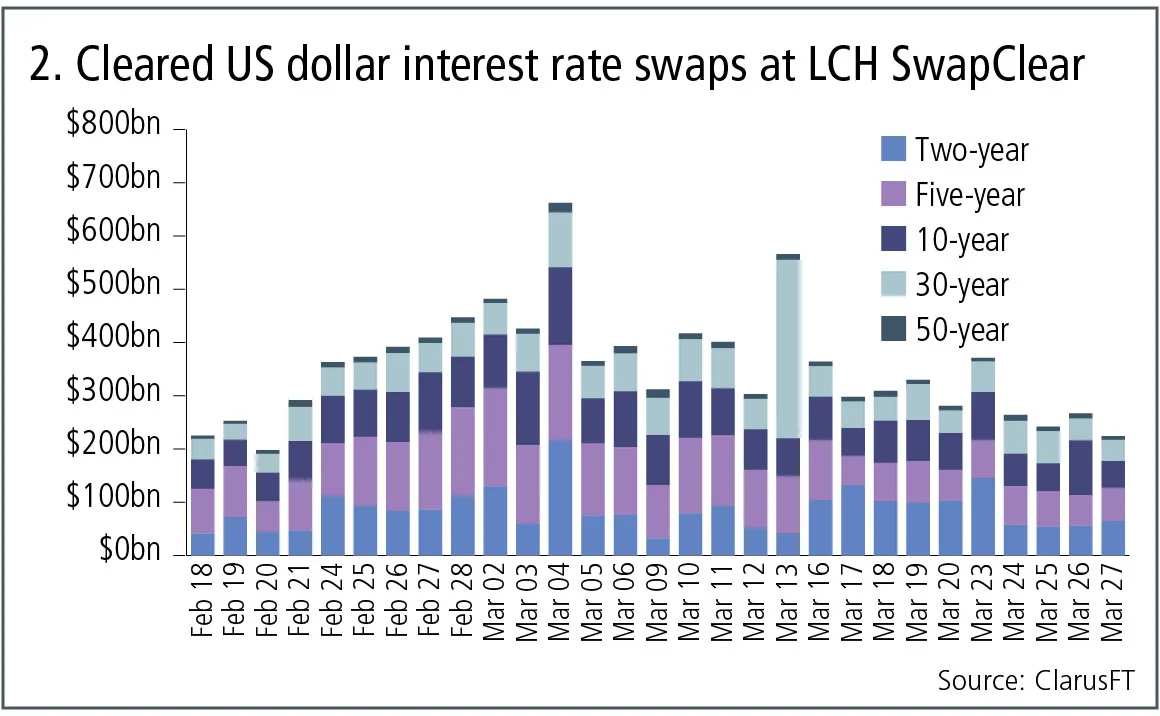
Figure 2 shows:
- On March 4, sub two-year volumes jumped massively to $217 billion, from $60 billion the day before.
- In fact, on March 4, all tenor buckets were at or close to their daily highs, with the 10-year at $146 billion and the 30-year at a massive $103 billion, far higher in gross DV01 terms than the two-year volume.
- On March 13, we see a massive $335 billion of gross notional traded in 30-year swaps.
Price changes
Next, we look at price moves over this period.
Table A shows:
- The six days in March with the largest price moves.
- We calculated the volume-weighted average price of actual trades seen on each day up to 3pm EST and then compared it with the prior day, giving us a robust transaction base measure.
- The two-year saw its largest move of -16bp on March, which corresponds with the peak in two-year volumes.
- On March 6 and 9, we see massive -25bp drops in the 30-year. The average daily move is within +/- 3bp, so this is eight times a normal day. And with these being consecutive business days (Friday and Monday), we have a -50bp drop over two days.
- On March 13, swap rates rallied against the trend with sharp increases of up to +17bp, which coincided with, or resulted in, the jump in volumes on this day, especially in the 30-year.
In addition to large one-day changes, there were also large intra-day moves as the market digested and responded to news about the actions taken by central banks and governments to combat the pandemic’s impact on the economy.
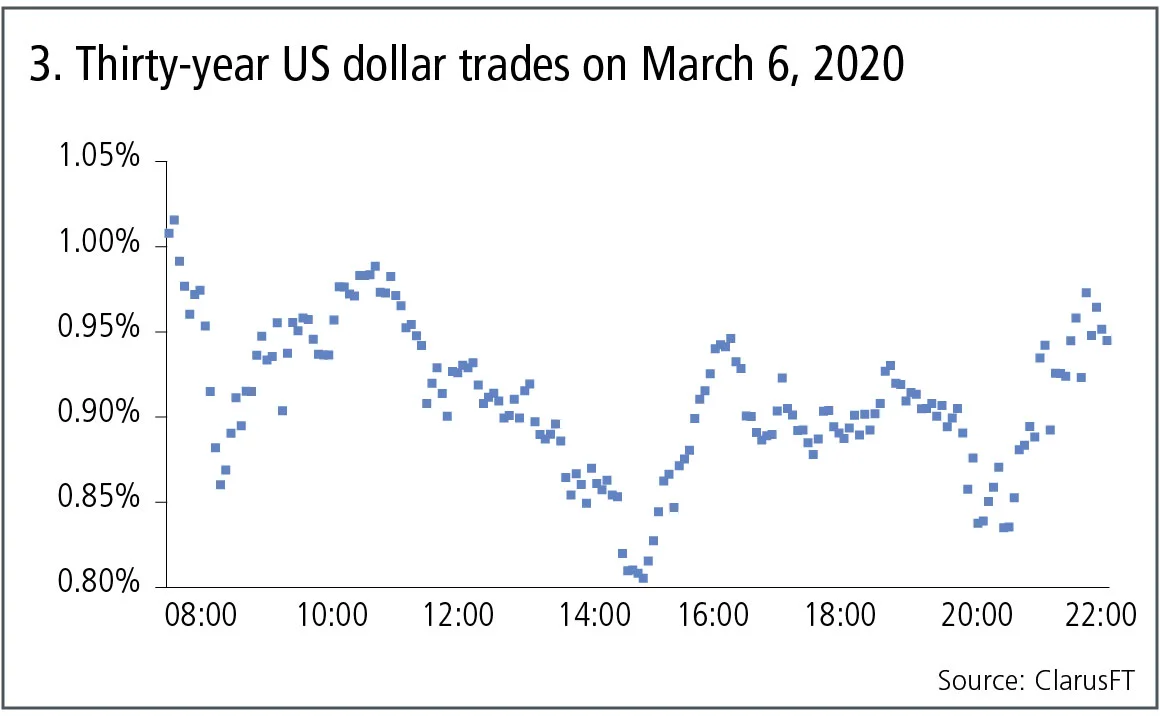
Figure 3 shows:
- The actual prices of 30-year US dollar swaps trades between 7:30 and 22:00 London time.
- First, we see rates dropping from above 1% to 0.86% at London opening and then going back up to 0.98% at 12 noon in London.
- Rates fall again as New York starts trading, all the way down to 0.805% at 3pm London, 11am New York.
- There is a sharp jump back up to 0.946% at 4pm London time.
- Rates drift down to 0.9% at 7pm and then drop sharply again to 0.835% at 7:47pm.
- And then up again to 0.95% at 9.30pm London time or 5:30 pm New York.
Monthly volumes
Let’s now step back and look at volumes in March 2020 compared with both the prior month and the prior year.
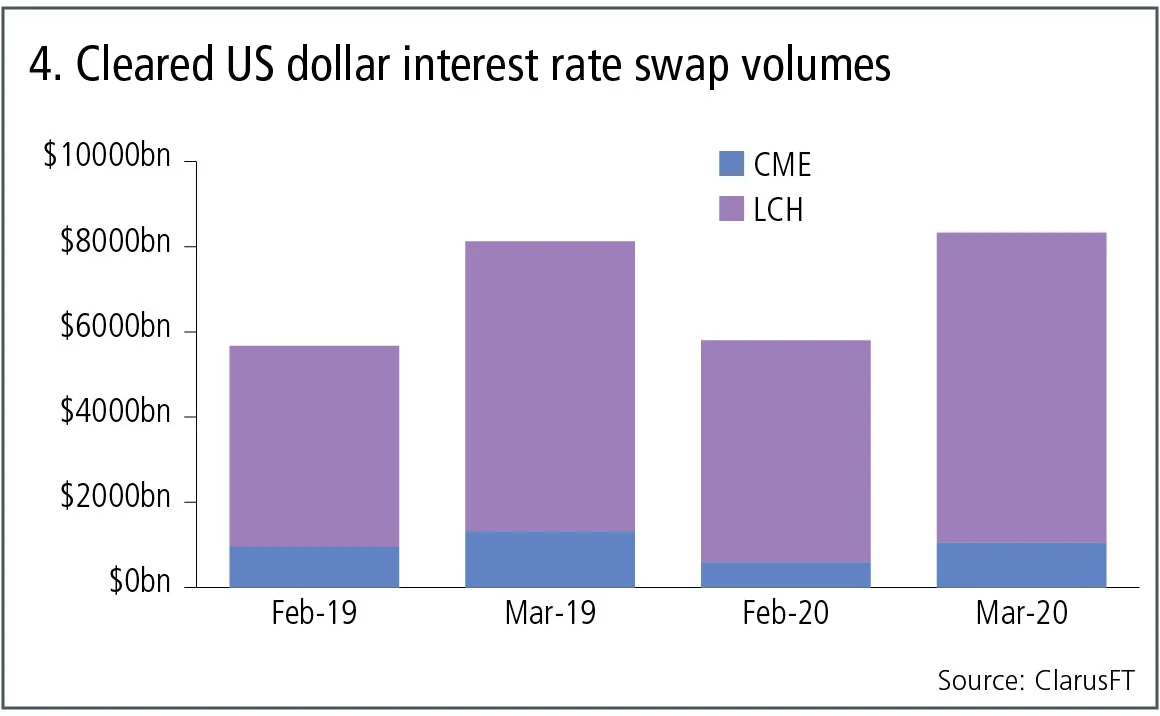
Figure 4 shows:
- March 2020 volumes at $8.3 trillion are slightly higher than for March 2019 and significantly higher than the $5.8 trillion in February 2020.
Cleared overnight index swaps
So far, we have focused on US dollar swaps, which reference Libor and are the largest in terms of risk traded. However, overnight index swaps (OIS) also see massive volumes – in particular, those that reference the Fed funds rate, which are mostly traded around Federal Open Market Committee meetings date decisions.
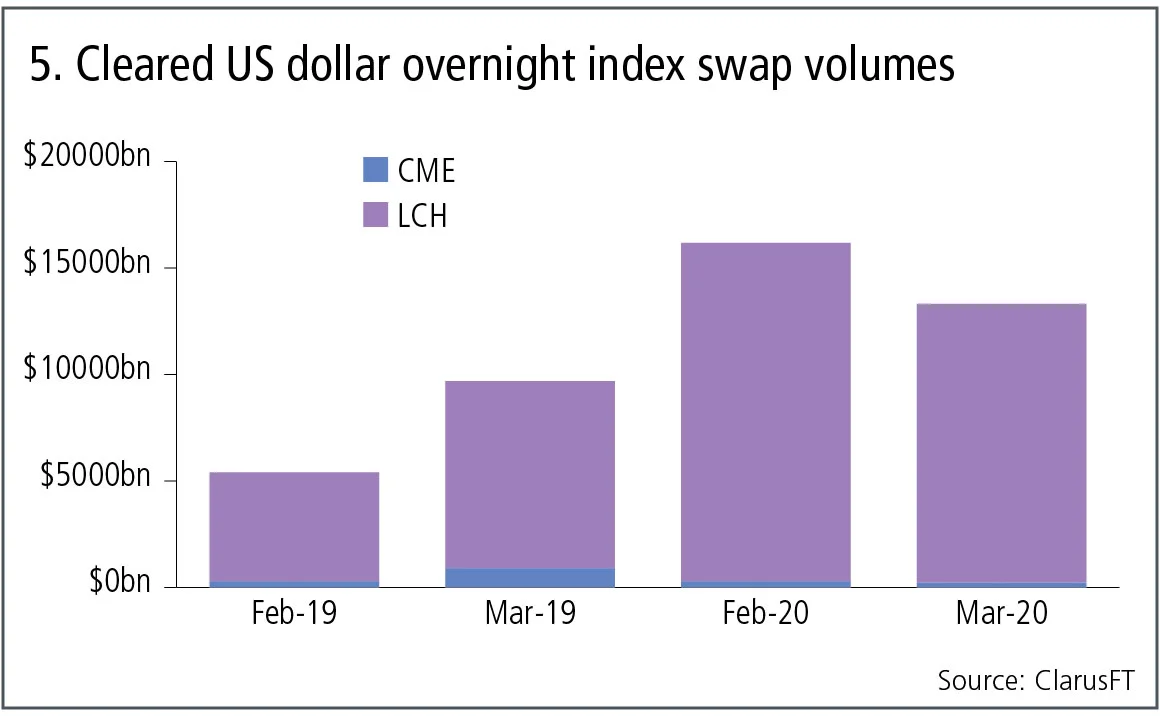
Figure 5 shows:
- February 2020 was a massive month, with $16.2 trillion of OIS.
- March 2020 was also a huge month, with $13.3 trillion gross notional.
- Both months are far higher than the corresponding months in 2019.
And finally, let’s look at daily gross notional for the February 18 to March 27 period.
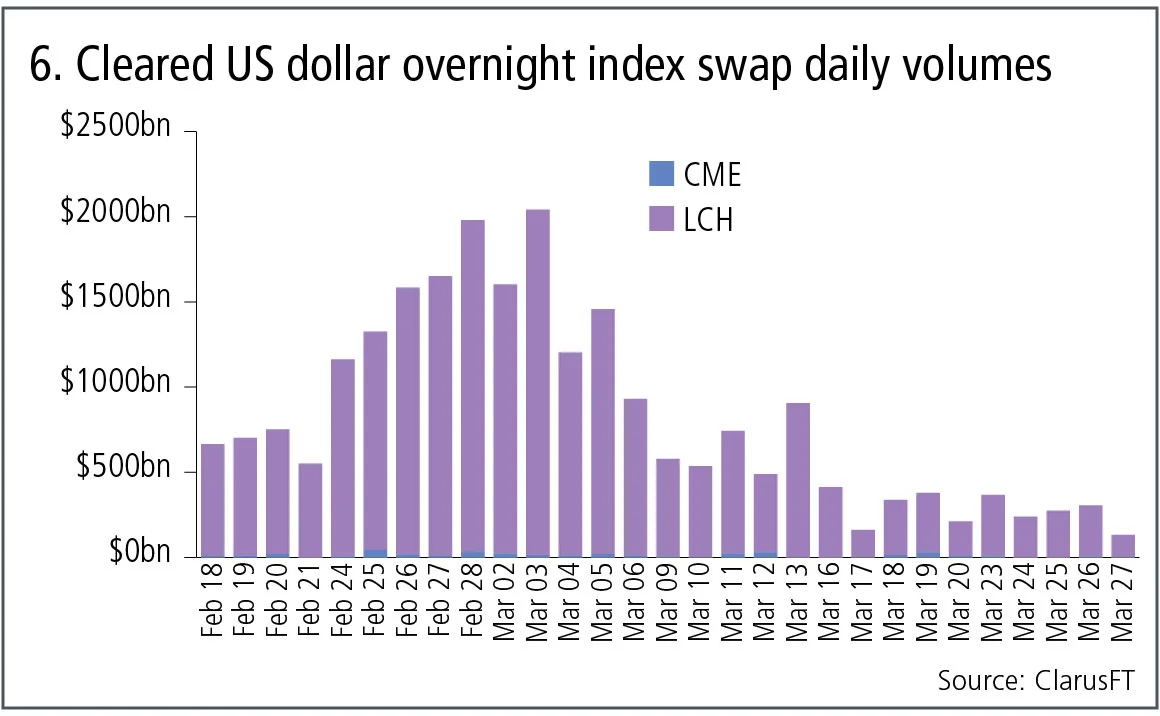
Figure 6 shows:
- Prior to February 18, volumes averaged roughly $400 billion a day.
- From February 24 onwards, we see a day-on-day rise in volumes as participants positioned themselves for the Federal Reserve to lower rates.
- We see a first peak of $1.98 trillion on February 28.
- And then on March 3, the date of the emergency rate cut, a new peak of $2.05 trillion gross notional traded in a single day.
- Volumes fell back to usual levels subsequently, particularly after March 13.
That’s a lot of data and charts to take in. Hopefully, they provide interesting insight and colour into how one of the largest markets in the world – US dollar swaps – performed during one of the most extraordinary months in recent memory. Let’s hope April is a normal month – or at least a new normal.
Amir Khwaja is chief executive of Clarus Financial Technology
コンテンツを印刷またはコピーできるのは、有料の購読契約を結んでいるユーザー、または法人購読契約の一員であるユーザーのみです。
これらのオプションやその他の購読特典を利用するには、info@risk.net にお問い合わせいただくか、こちらの購読オプションをご覧ください: http://subscriptions.risk.net/subscribe
現在、このコンテンツを印刷することはできません。詳しくはinfo@risk.netまでお問い合わせください。
現在、このコンテンツをコピーすることはできません。詳しくはinfo@risk.netまでお問い合わせください。
Copyright インフォプロ・デジタル・リミテッド.無断複写・転載を禁じます。
当社の利用規約、https://www.infopro-digital.com/terms-and-conditions/subscriptions/(ポイント2.4)に記載されているように、印刷は1部のみです。
追加の権利を購入したい場合は、info@risk.netまで電子メールでご連絡ください。
Copyright インフォプロ・デジタル・リミテッド.無断複写・転載を禁じます。
このコンテンツは、当社の記事ツールを使用して共有することができます。当社の利用規約、https://www.infopro-digital.com/terms-and-conditions/subscriptions/(第2.4項)に概説されているように、認定ユーザーは、個人的な使用のために資料のコピーを1部のみ作成することができます。また、2.5項の制限にも従わなければなりません。
追加権利の購入をご希望の場合は、info@risk.netまで電子メールでご連絡ください。
詳細はこちら コメント
オペリスク・データ:企業スパイがBBVAに脅威をもたらす
他にも:BofAがエプスタイン氏との関与疑惑で追及されています。また、少数株主がブルックフィールドに異議を唱えています。データ提供:ORX News

AI政治の台頭
MASの顧問であるデビッド・ハードーン氏は、AIを単なる一つの技術として扱うべきではないと述べています

AIリスク管理と能力制御への移行
リスク管理者によると、検証の枠組みを見直すことで、銀行はイノベーションと規制上の要件を両立させ、強固なリスク管理体制を維持することができます

トークン化された商品市場は、経済の円滑な運営に寄与する可能性がある
暗号資産の専門家は、実物資産をブロックチェーンに移行することで、担保に関する摩擦が緩和されると主張しています

GenAIの時代において、未だに優れたモデルが必要なのはなぜなのか?
ジャン=フィリップ・ブショー氏は、モデルが人工知能をレジームシフトの過程で導き、過学習から遠ざけることができると述べています

取引のスピードがガバナンスを上回る時:一瞬の統制の隙間
デリバティブの専門家によると、光駆動型エレクトロニクスの新たな形態が、市場インフラにおける次のリスクとなる可能性があるとのことです

先物とオプションが示す戦争のコスト
現物価格は大きな混乱を示していますが、先物市場はこれが一時的なものだと示唆しており、オプション市場は不安定な状況が続くと示唆しています

担保に関して、TINAはTIAになることができるのか
あるエコノミストは、レポ取引やデリバティブ取引における担保としての米国債の優位性は、もはや揺るぎないものではないと指摘しています