Swaps data: volumes up amid volatility
Data shows strong growth in cleared OTC derivative volumes in second half of 2018, says Amir Khwaja

As 2018 comes to an end, with Brexit dominating the news, trade tensions escalating and the Federal Reserve maintaining its rate-hike path, it is a good time to take stock of global swap volumes.
Instead of hiding from the uncertainty, swap users appear to have instead dived right in. Volumes are up across the board, with third-quarter numbers increasing in 2018 compared with the same period in 2017, and the October-November period following suit.
US dollar credit default swaps and euro interest rate swaps in particular have had a strong end to the year. The latter saw a 176% increase in volumes at Eurex and 63% at LCH in October-November 2018 versus 2017.
The only exception has been yen interest rate swaps, where volumes were down in the third quarter in 2018 versus 2017, but up in October-November 2018 versus the previous year.
Cleared US dollar swaps
Let’s start with the largest product: cleared US dollar interest rate swaps. We include all clearable types – vanilla fixed vs float, overnight index, basis, zero coupon and variable notional.
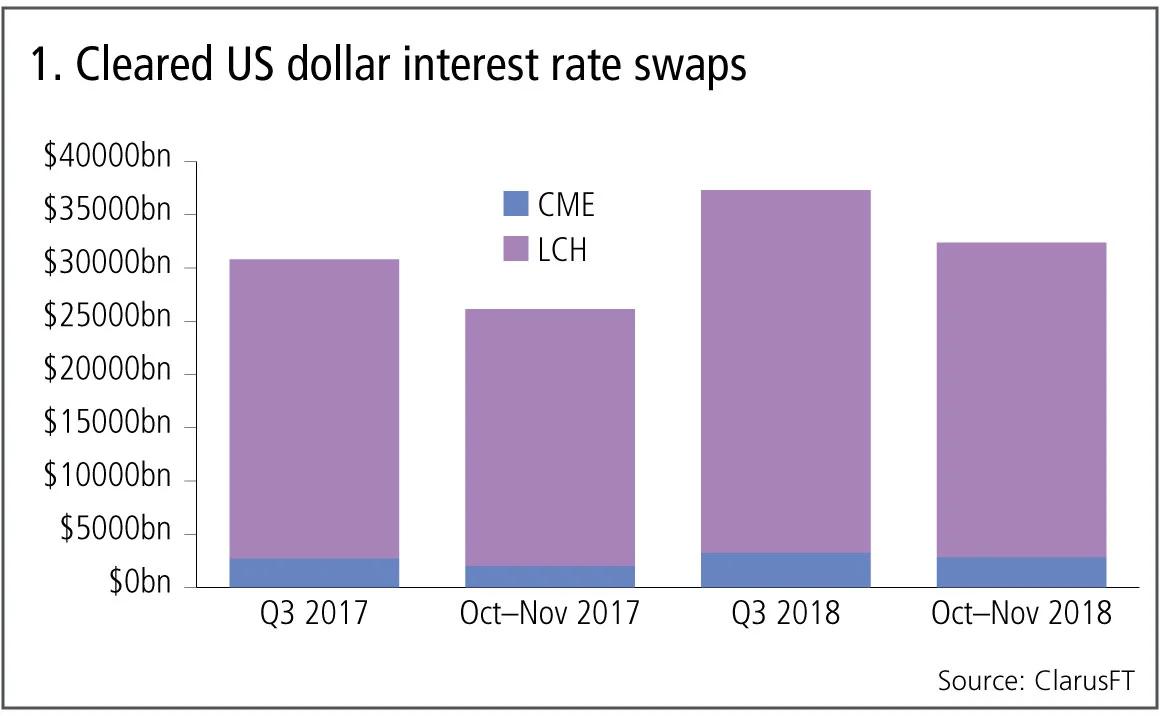
Figure 1 shows:
- Volumes are significantly higher in 2018.
- Overall volumes of $37 trillion in Q3 18 and $32 trillion in Oct–Nov 2018.
- LCH SwapClear with 91% share and CME with 9%.
- LCH SwapClear up 22% in each of these periods.
- CME over-the-counter up 20% in Q3 18 and up 40% in Oct–Nov 2018.
Both clearing houses saw significant growth in volumes in 2018 over the corresponding periods in 2017 and the US dollar swap market is in healthy shape.
Cleared euro swaps
Next, the second-largest product: cleared euro interest rate swaps, including all clearable types.
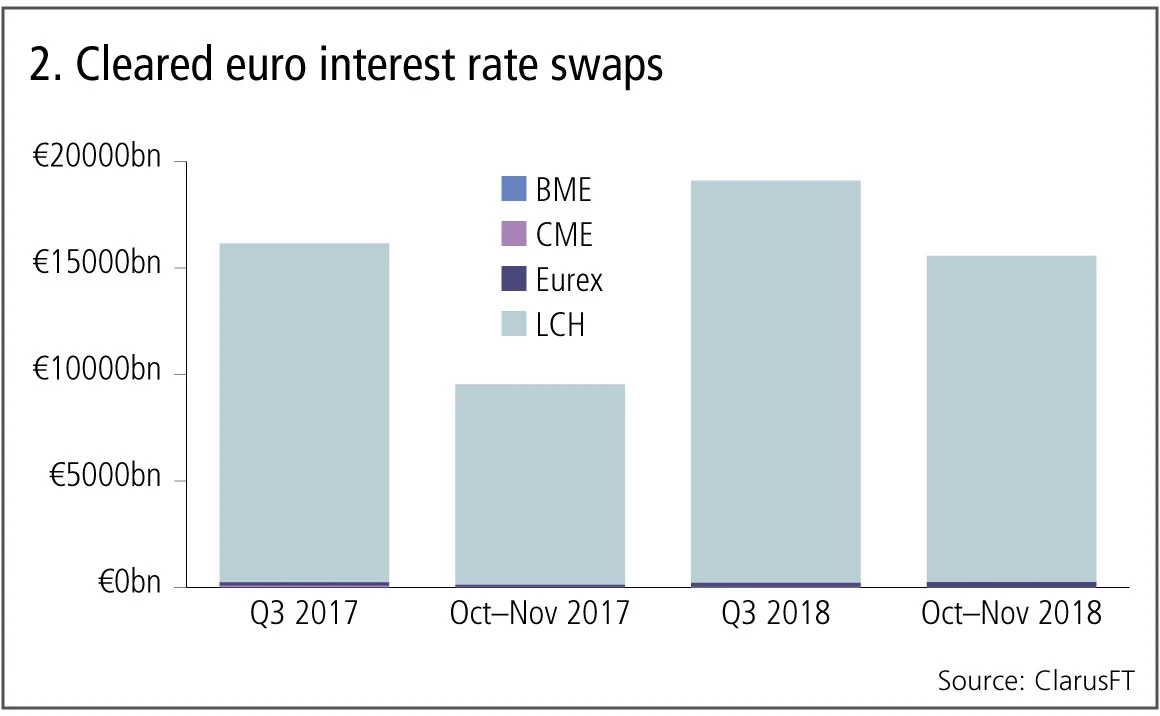
Figure 2 shows:
- Volumes also significantly higher in 2018.
- €19 trillion in Q3 18 and $15.6 trillion in Oct–Nov 2018.
- LCH SwapClear with 98.4% share in the most recent period.
- LCH SwapClear up 19% in Q3 18 and a massive 63% in Oct–Nov 2018, driven by 110% growth in OIS volumes and 39% in IRS.
- Eurex with 1.6% share in the Oct–Nov 2018.
- Eurex up 22% in Q3 18 and a massive 173% in Oct–Nov 2018.
- CME OTC down 75%.
- BME with no volume in the recent past.
LCH SwapClear continuing its dominance in euro swap volumes, with signs of Eurex growing fast from a much smaller base.
Cleared yen swaps
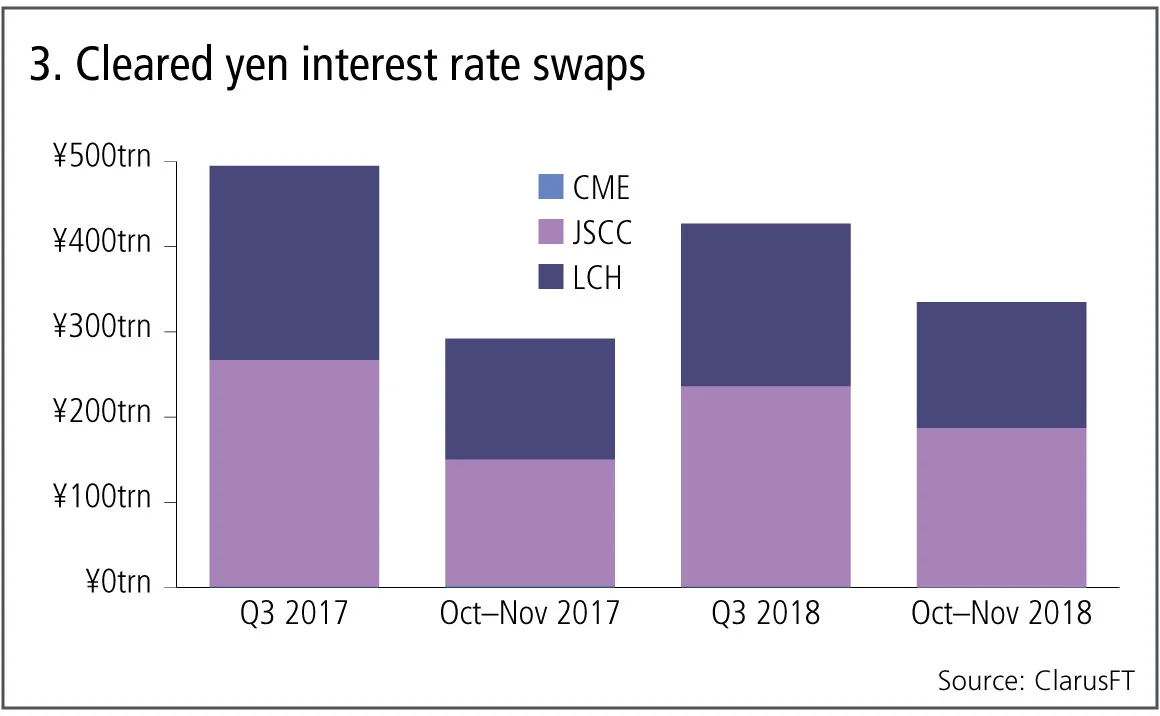
Figure 3 shows:
- Volumes for yen were down in Q3 18 but up for Oct–Nov 2018.
- 427 trillion yen in Q3 18 and 336 trillion yen in Oct–Nov 2018.
- JSCC with 56% share and LCH SwapClear with 44%.
- JSCC down 12% in Q3 18 and up 27% in Oct–Nov 2018.
- LCH down 16% in Q3 18 and up 4% in Oct–Nov 2018.
After three consecutive down quarters in 2018, finally the fourth quarter looks to be breaking the trend and showing growth and JSCC maintaining its lead over LCH.
Cleared US dollar credit default swaps
Let’s now switch focus to credit derivatives and the volume of credit indexes and single names in US dollars.
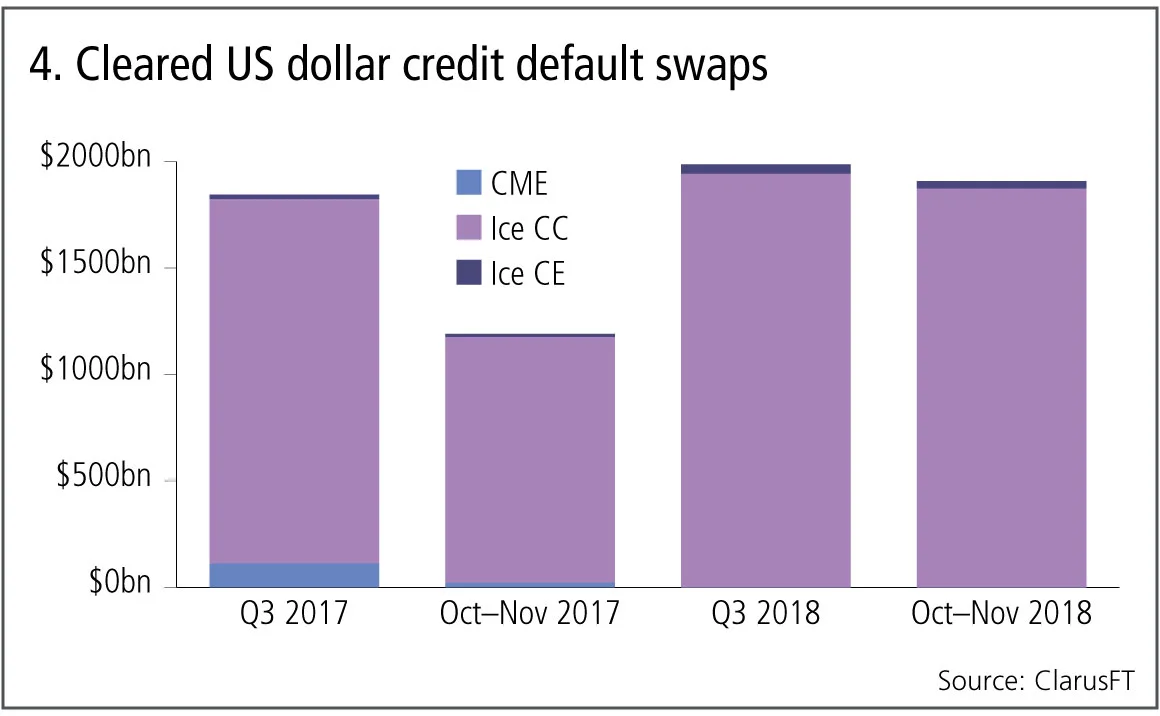
Figure 4 shows:
- Volumes significantly higher in 2018.
- $2 trillion in Q3 18 and $1.9 trillion in Oct–Nov 2018.
- Ice Clear Credit dominates with a 98% share.
- Ice Clear Credit up 14% in Q3 18 and 62% in Oct–Nov 2018.
- Ice Clear Europe also up due to new CDX volume.
- CME shutting down its service.
- LCH CDS with less than $1 billion in each period.
Cleared credit derivatives volumes in US dollars is showing good growth rates, specifically in indexes as opposed to single names.
Cleared euro credit default swaps
Next the volume of credit indexes and single names in euros.
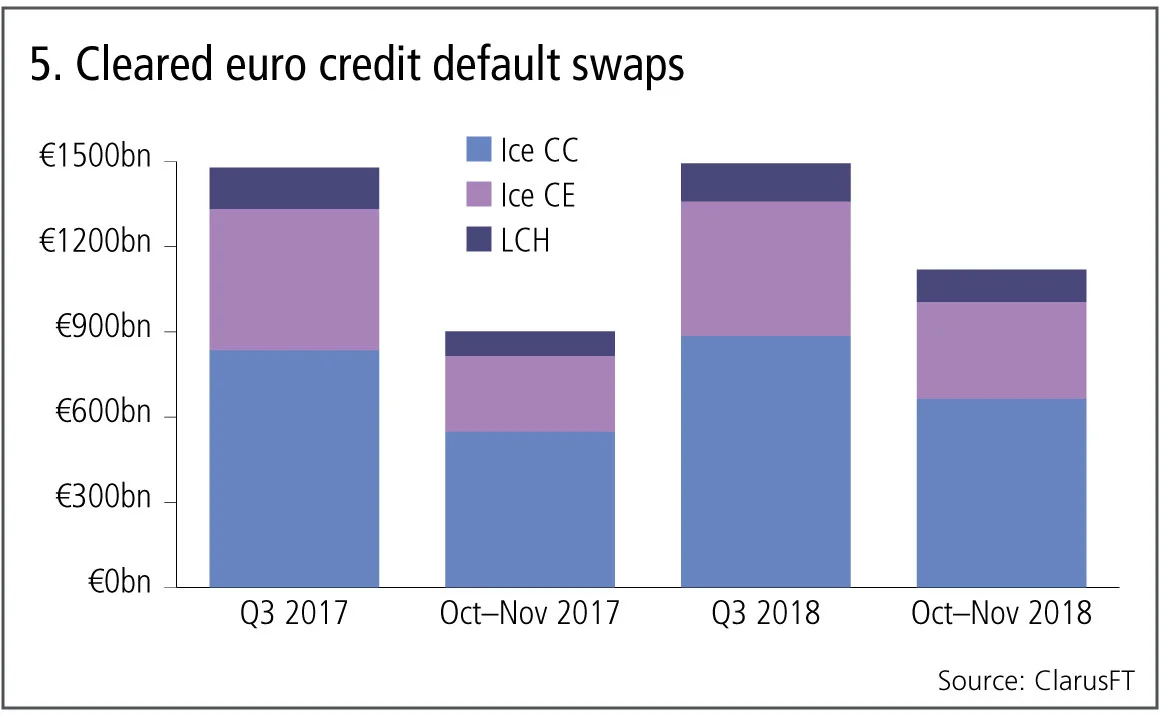
Figure 5 shows:
- Volumes higher in 2018.
- €1.5 trillion in Q3 18 and €1.1 trillion in Oct–Nov 2018.
- Ice Clear Credit with 59% share, Ice Clear Europe 31% and LCH CDSClear with 10%, similar to earlier quarters in 2018.
- Ice Clear Credit up 21% in Oct–Nov 2018.
- Ice Clear Europe up 28% in Oct–Nov 2018.
- LCH CDSClear up 32% in Oct–Nov 2018.
Cleared credit derivatives volumes in euros are also showing good growth rates.
Cleared non-deliverable forwards
Finally cleared non-deliverable forwards.
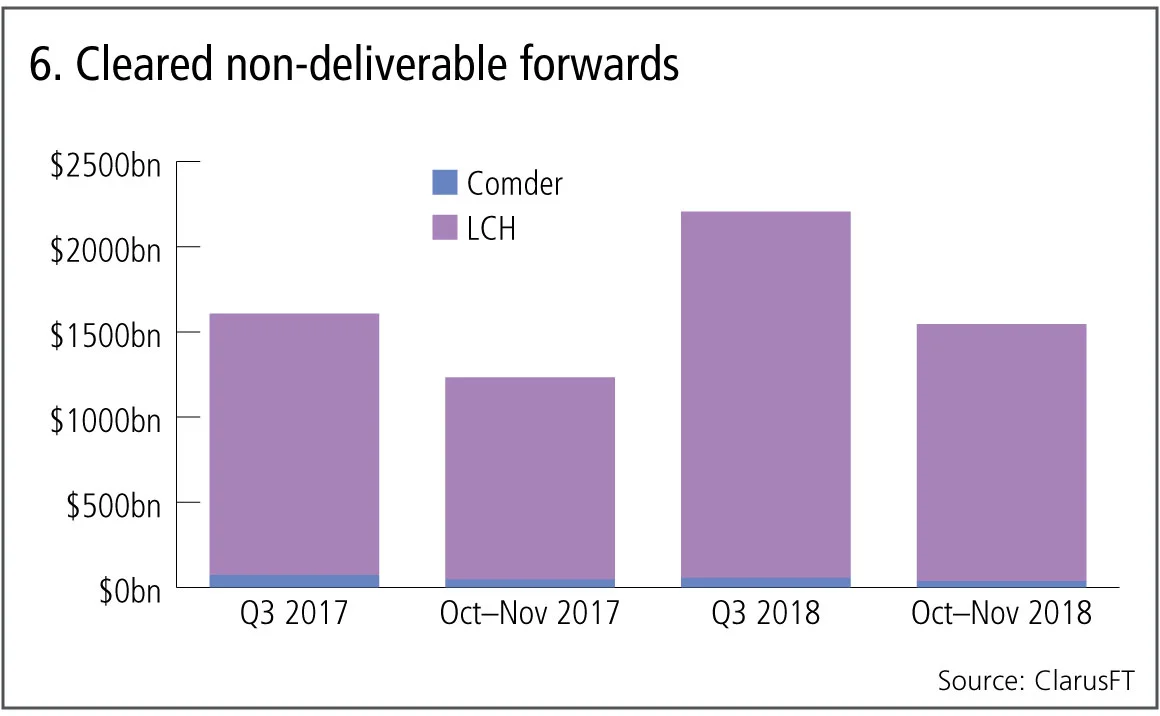
Figure 6 shows:
- Volumes massively higher in 2018.
- $2.2 trillion in Q3 18 and $1.5 trillion in Oct–Nov 2018.
- LCH ForexClear dominant with 98% share.
- LCH ForexClear up 40% in Q3 18 and 27% in Oct–Nov 2018.
- Comder down 18% in Oct–Nov 2018.
Cleared non-deliverable forwards volumes continue a long running trend of high growth rates.
All the other major cleared OTC derivatives markets that we have looked at have higher volumes in the most recent two months than the corresponding period in 2017, in most cases significantly higher.
2018 has been a year of increased price volatility and this is certainly one factor in the higher volumes that we have seen.
It will be interesting to see if next year maintains the growth trend, it certainly appears that political uncertainty and price volatility show no signs of ebbing away.
Amir Khwaja is chief executive of Clarus Financial Technology.
Editing by Lukas Becker
コンテンツを印刷またはコピーできるのは、有料の購読契約を結んでいるユーザー、または法人購読契約の一員であるユーザーのみです。
これらのオプションやその他の購読特典を利用するには、info@risk.net にお問い合わせいただくか、こちらの購読オプションをご覧ください: http://subscriptions.risk.net/subscribe
現在、このコンテンツを印刷することはできません。詳しくはinfo@risk.netまでお問い合わせください。
現在、このコンテンツをコピーすることはできません。詳しくはinfo@risk.netまでお問い合わせください。
Copyright インフォプロ・デジタル・リミテッド.無断複写・転載を禁じます。
当社の利用規約、https://www.infopro-digital.com/terms-and-conditions/subscriptions/(ポイント2.4)に記載されているように、印刷は1部のみです。
追加の権利を購入したい場合は、info@risk.netまで電子メールでご連絡ください。
Copyright インフォプロ・デジタル・リミテッド.無断複写・転載を禁じます。
このコンテンツは、当社の記事ツールを使用して共有することができます。当社の利用規約、https://www.infopro-digital.com/terms-and-conditions/subscriptions/(第2.4項)に概説されているように、認定ユーザーは、個人的な使用のために資料のコピーを1部のみ作成することができます。また、2.5項の制限にも従わなければなりません。
追加権利の購入をご希望の場合は、info@risk.netまで電子メールでご連絡ください。
詳細はこちら コメント
オペリスク・データ:企業スパイがBBVAに脅威をもたらす
他にも:BofAがエプスタイン氏との関与疑惑で追及されています。また、少数株主がブルックフィールドに異議を唱えています。データ提供:ORX News

AI政治の台頭
MASの顧問であるデビッド・ハードーン氏は、AIを単なる一つの技術として扱うべきではないと述べています

AIリスク管理と能力制御への移行
リスク管理者によると、検証の枠組みを見直すことで、銀行はイノベーションと規制上の要件を両立させ、強固なリスク管理体制を維持することができます

トークン化された商品市場は、経済の円滑な運営に寄与する可能性がある
暗号資産の専門家は、実物資産をブロックチェーンに移行することで、担保に関する摩擦が緩和されると主張しています

GenAIの時代において、未だに優れたモデルが必要なのはなぜなのか?
ジャン=フィリップ・ブショー氏は、モデルが人工知能をレジームシフトの過程で導き、過学習から遠ざけることができると述べています

取引のスピードがガバナンスを上回る時:一瞬の統制の隙間
デリバティブの専門家によると、光駆動型エレクトロニクスの新たな形態が、市場インフラにおける次のリスクとなる可能性があるとのことです

先物とオプションが示す戦争のコスト
現物価格は大きな混乱を示していますが、先物市場はこれが一時的なものだと示唆しており、オプション市場は不安定な状況が続くと示唆しています

担保に関して、TINAはTIAになることができるのか
あるエコノミストは、レポ取引やデリバティブ取引における担保としての米国債の優位性は、もはや揺るぎないものではないと指摘しています