
Credit data: zeroing in on supply chain risk
Data highlights the risks posed by economic protectionism, writes David Carruthers of Credit Benchmark

“An eye for an eye will make the whole world blind,” Gandhi is said to have observed. Sadly, behavioural economists would probably agree he was not far wrong: recent tit-for-tat episodes of tariff imposition by the US, the EU and China demonstrate just how hardwired retaliatory behaviour is. For banks managing their credit exposure to large global manufacturers, whose lengthy supply chains cross many of the impacted countries, the spat poses a more immediate problem: the rise in costs and attendant uncertainties imposed by tariffs has already sparked a material rise in the firms’ probabilities of default.
Trade and tariff disputes have focused attention on the length and fragility of supply chains. Supply chain risk is often seen as an operational problem, but typically supply chain disruption becomes a financial and credit problem.
This month, we look at supply chain risk for 17 large global original equipment manufacturers (OEMs), and their network of some 500 suppliers across the globe. Already, a clear deterioration in the number of investment grade firms they deal with is observable.
Elsewhere this month, we review credit trends for UK corporates, which we’ve been tracking since the Brexit referendum in June 2016. We also highlight regional credit rating differences raised in Basel 2017, and report on the distribution of senior unsecured loss given default estimates.
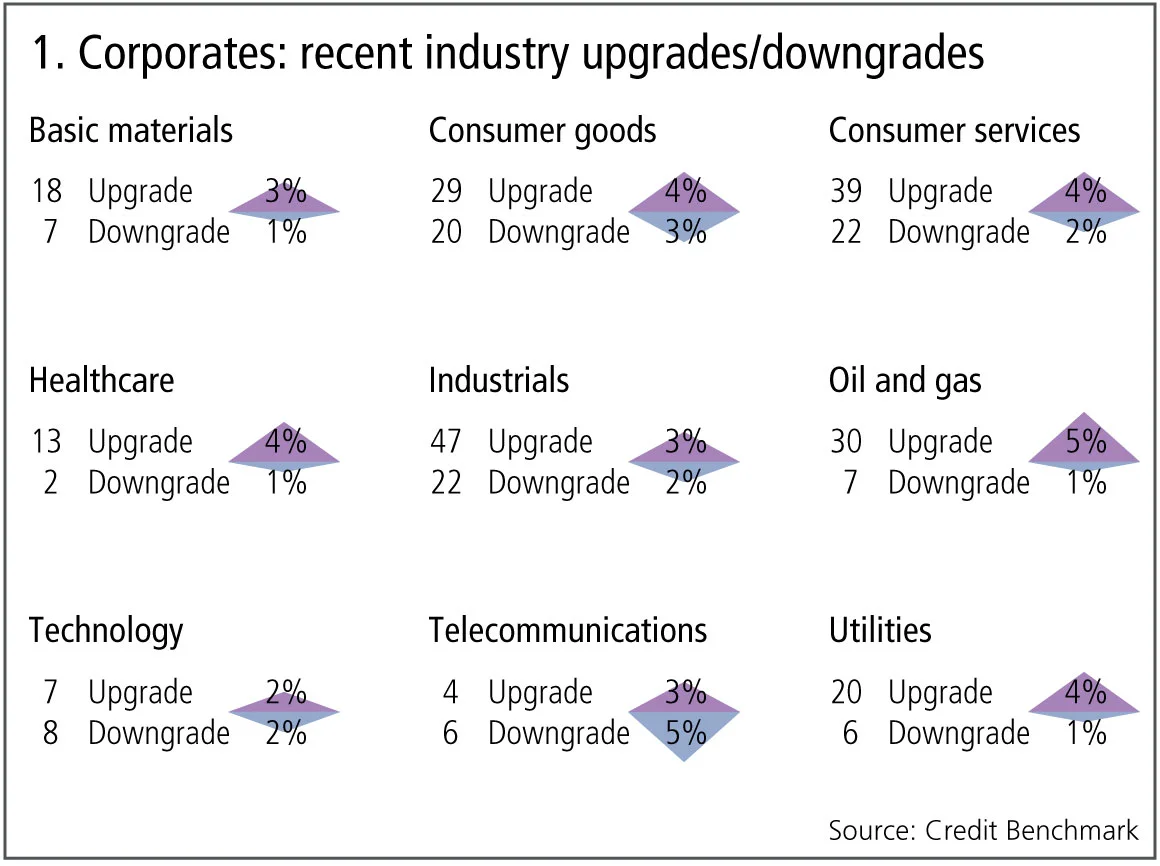
Figure 1 shows:
- Across global corporates, upgrades outnumber downgrades by two to one.
- Upgrades dominate downgrades in seven out of nine industries.
- Basic materials, consumer goods and oil and gas continue their trend of the past few months, with upgrades outweighing downgrades. This is especially marked in oil and gas.
- Technology has stabilised, with upgrades and downgrades balanced after three months that favoured upgrades.
- Telecommunications continues its recent pattern of downgrades slightly outweighing upgrades.
- Consumer services and industrials have moved to upgrades dominating downgrades; both industries were in balance last month and both were in a sustained downtrend in the months prior to that; this may suggest the beginning of a new positive trend.
- Healthcare and utilities have returned to upgrades outweighing downgrades.
Supply chain credit risk
Trade and tariff disputes have focused attention on the length and fragility of supply chains. Supply chain risk is often seen as an operational problem, but typically supply chain disruption becomes a financial and credit problem.
Figure 2 shows the credit and geographic distribution for a sample of more than 500 suppliers to 17 large, global – mainly US – corporate original equipment manufacturers (OEM).
Figure 2 shows:
- The majority (61%) of the suppliers are investment grade; those that are not are mainly in the bb categories. However, a small number are in the b or c categories. The presence of high-risk companies in the supply chain is probably unavoidable, because they may be the sole suppliers of key components or raw materials. But, from a credit perspective, they represent the weakest links in the relevant OEM supply chain.
- Geographically, these suppliers are mainly located in the US, China, South Korea and the UK.
- US companies dominate because most of the companies in the OEM sample are US based, but the importance of the UK is surprising, given that only one company in the OEM sample is UK based. Given the current Brexit debate, this shows the significance of UK companies in the global supply chain.
- A deterioration in credit quality versus a year ago.
UK industry credit trends
With Brexit officially about six months away, the debate about the economic impact has become increasingly polarised. Newspapers like dramatic headlines about shortages of food and medicines, but there is genuine concern about a more volatile economic environment. Bank-sourced credit data confirms the impact of a general increase in business uncertainty, but recent estimates show signs of stability and even a possible improvement.
Figure 3 shows credit trends since June 2016 for large UK industrials (left-hand chart) and large UK healthcare companies (right-hand chart).
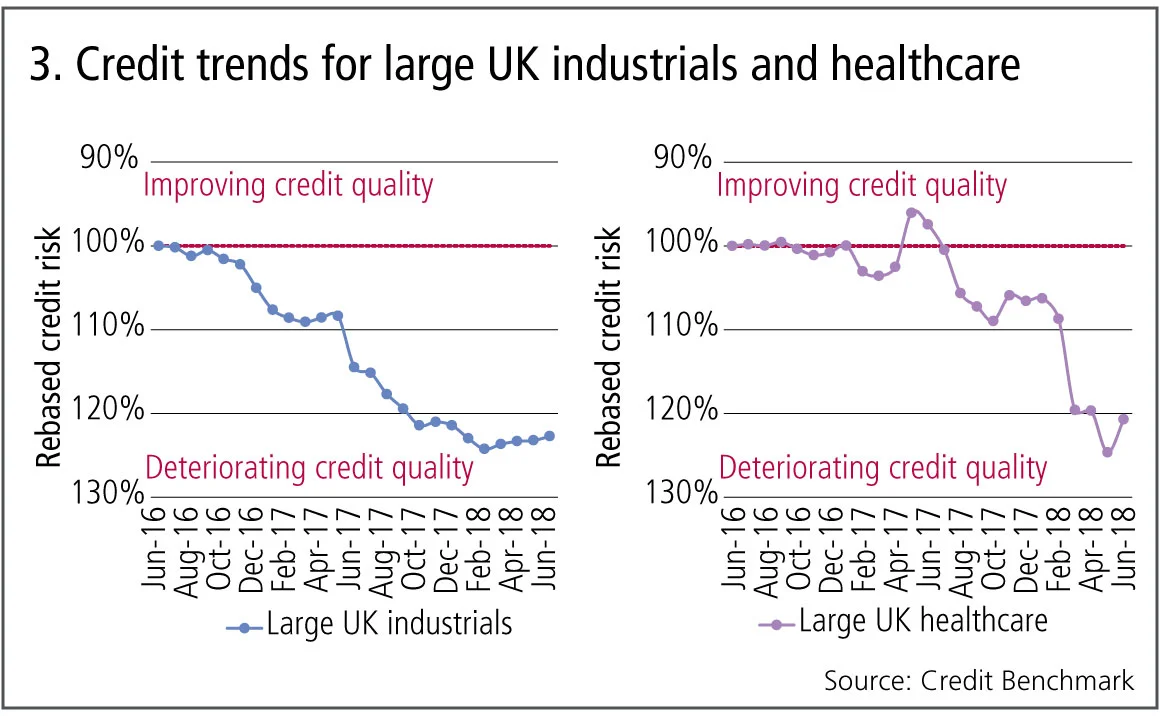
Figure 3 shows:
- Large UK industrials show a deterioration in credit quality since the 2016 referendum.
- At the trough, credit risk for the industrials had increased by about 25%. Since April 2018 it has shown a slight rebound.
- Large UK healthcare companies have been more volatile. Until late 2017, there was no obvious trend; since then there has been a marked deterioration.
- Since the 2016 referendum, the cumulative increase in credit risk for large UK healthcare companies is also 25%, on a par with industrials. Since May 2018, this has also shown a slight improvement.
- Banks anticipated the UK sovereign downgrade by some months in 2016. The recent stabilisation in the two key industries shown here may indicate that the impact of Brexit uncertainty on corporates is now also reflected in bank risk assessments.
Basel 2017 and investment-grade definitions in the US
The December 2017 Basel III reforms have sparked debates about the impact of regional differences in detailed implementation. A key issue is the inability of US banks to use traditional credit ratings for risk-weighted asset allocations. The rules require US banks to recognise borrowers as “investment grade” only if the bank can show that they meet traditional rating agency criteria for that definition and, in addition, have securities (equities or bonds) in issue on a recognised exchange.
Figure 4 shows the bank-sourced credit distribution for a large sample of US corporate borrowers split between those that do (1,394) and do not (1,087) satisfy the “securities in issue” rule.
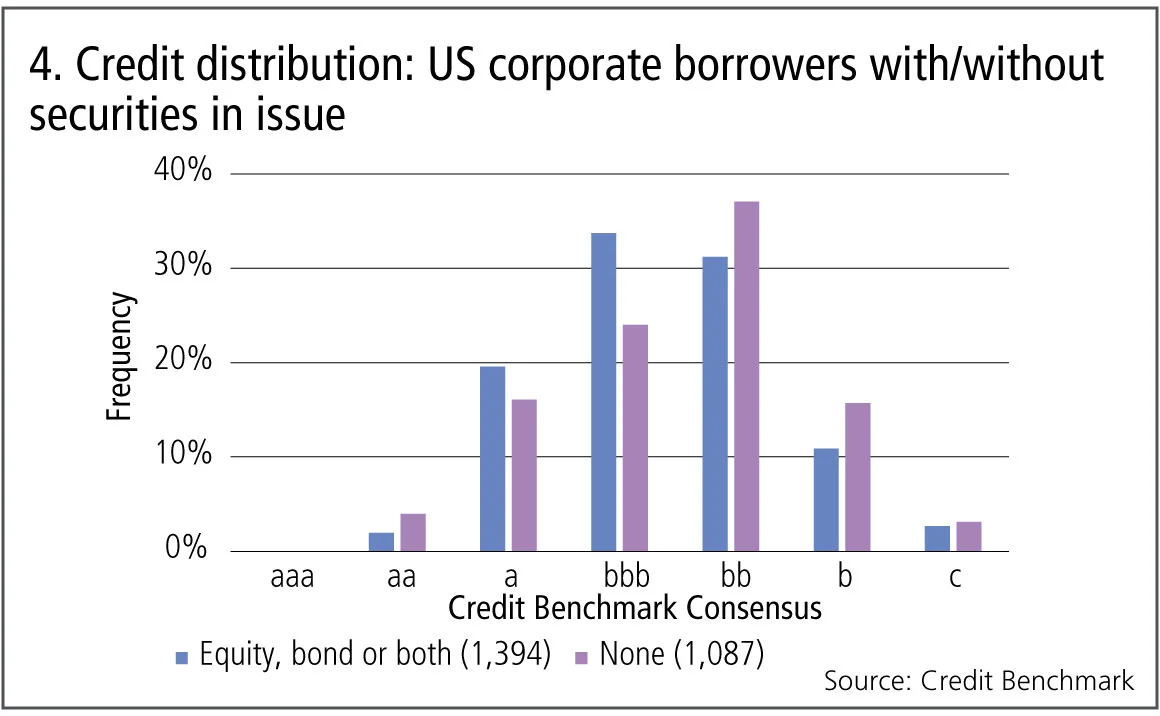
Figure 4 shows:
- US companies with securities in issue have significantly higher credit quality. The majority are in the bbb category and nearly 25% are in a or aa categories.
- However, more than 40% are non-investment-grade categories of bb, b or c.
- US companies without securities in issue have lower credit quality, with more than 40% in the bb category.
- However, bank-sourced estimates suggest that nearly 30% of the companies that do not have securities in issue are nevertheless viewed as investment grade.
Loss given default and recovery rates
Basel III standardises the loss given default (LGD) parameters for regulatory capital, but LGD remains a key driver of inter-bank variations in economic capital. For secured loans, the recovery rate implied by an LGD estimate depends heavily on the value and liquidity of the collateral taken as security. But banks also estimate LGDs for unsecured loans, and this provides a useful starting point for secured calculations.
Figure 5 shows the distribution of bank-sourced estimate for senior, unsecured LGD across 675 corporates.
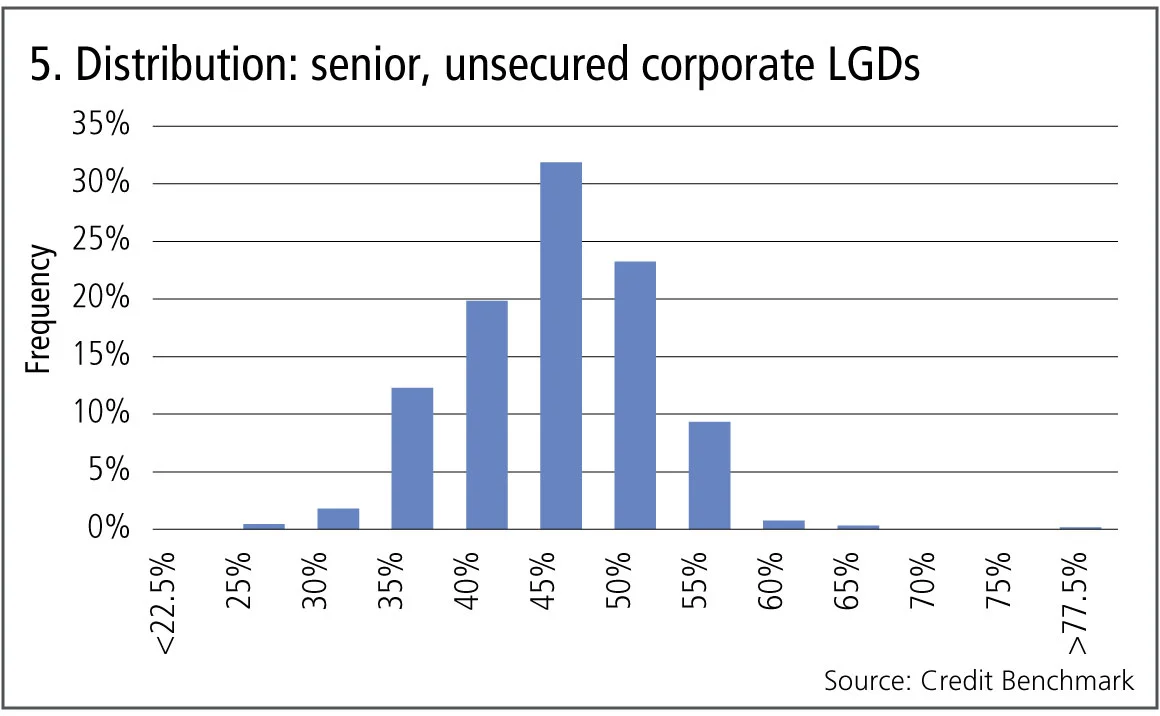
Figure 5 shows:
- The distribution of LGDs is broadly symmetric and approximately normal.
- The average and median are about 45%, which implies a 55% recovery rate assumption.
- Only 32% of the obligors are in the 45% +/–2.5% category, so the majority of LGDs are outside this range, although most are in the range of 35% to 55%.
- This distribution implies that a probability of default of 1% would result in a normal range (i.e. one standard deviation) for expected loss estimates of anything from 0.35% to 0.55% depending on the senior unsecured LGD assumption. For some banks, this could represent a significant difference in required capital.
- LGDs will be lower for secured loans, depending on the collateral held; this initial research applies to unsecured loans.
David Carruthers is the head of research at Credit Benchmark, a credit risk data provider.
About this data
The Credit Benchmark dataset is based on internally modelled credit ratings from a pool of contributor banks. These are mapped into a standardised 21-bucket ratings scale, so downgrades and upgrades can be tracked on a monthly basis. Obligors are only included where ratings have been contributed by at least three different banks, yielding a total dataset of almost 21,000 names, which is growing by 5% per month.
Editing by Tom Osborn
コンテンツを印刷またはコピーできるのは、有料の購読契約を結んでいるユーザー、または法人購読契約の一員であるユーザーのみです。
これらのオプションやその他の購読特典を利用するには、info@risk.net にお問い合わせいただくか、こちらの購読オプションをご覧ください: http://subscriptions.risk.net/subscribe
現在、このコンテンツを印刷することはできません。詳しくはinfo@risk.netまでお問い合わせください。
現在、このコンテンツをコピーすることはできません。詳しくはinfo@risk.netまでお問い合わせください。
Copyright インフォプロ・デジタル・リミテッド.無断複写・転載を禁じます。
当社の利用規約、https://www.infopro-digital.com/terms-and-conditions/subscriptions/(ポイント2.4)に記載されているように、印刷は1部のみです。
追加の権利を購入したい場合は、info@risk.netまで電子メールでご連絡ください。
Copyright インフォプロ・デジタル・リミテッド.無断複写・転載を禁じます。
このコンテンツは、当社の記事ツールを使用して共有することができます。当社の利用規約、https://www.infopro-digital.com/terms-and-conditions/subscriptions/(第2.4項)に概説されているように、認定ユーザーは、個人的な使用のために資料のコピーを1部のみ作成することができます。また、2.5項の制限にも従わなければなりません。
追加権利の購入をご希望の場合は、info@risk.netまで電子メールでご連絡ください。
詳細はこちら コメント
G-Sibの資本サーチャージ:指数化と平均化がインセンティブに与える影響
資本リスク戦略担当者は、バーゼルIIIの最終局面が米国の大手銀行の行動に与える影響を予測しています

ポッドキャスト:アビ=ジャバー氏とリー氏が語る「スティッキー」なボラティリティ問題
二人は、VIX、SPX、SSRを同時に捉えるためのモデルについて議論しています

市場は未来を非常に歪んだ形で捉えている
ジャン=フィリップ・ブショー氏は、割引のパラダイムはより現実的なものへと適応すべきだと述べています

オペリスクデータ:サイバー攻撃が暗号資産プロトコルを揺るがす
他にも:JPモルガンが投資家の損失をめぐり罰金処分を受けた、Symetraのメソジスト系年金基金をめぐる混乱など。データ提供:ORX News

予測市場は、炭鉱のカナリアのような役割を果たすことがある
リスクの専門家によると、Polymarketなどのプラットフォームにおける契約価格は、リスク管理やヘッジの指標となり得るとのことです

AIエージェントがリスク管理者の課題解決にどう役立つ
シティのリスク専門家は、取引や融資承認に関する構造化データと非構造化データを統合し、リスクに関する単一かつ統一されたビューを構築する自律型AIツールについて概説しました

オペリスク・データ:企業スパイがBBVAに脅威をもたらす
他にも:BofAがエプスタイン氏との関与疑惑で追及されています。また、少数株主がブルックフィールドに異議を唱えています。データ提供:ORX News

AI政治の台頭
MASの顧問であるデビッド・ハードーン氏は、AIを単なる一つの技術として扱うべきではないと述べています
