Swaps data: OTC margin up; futures margin down
Swaps initial margin jumps 22% year-on-year, against surprise fall in futures margin, writes Amir Khwaja of Clarus FT

There were surprises and mysteries in the latest set of quarterly quantitative disclosures from derivatives clearing houses.
In the 12 months leading up to the end of March, the amount of initial margin consumed by interest rate swap clearing houses jumped 22%. But, here’s one surprise: IM for listed futures and options declined 9% over the same period. That’s not easy to explain when some of the biggest contracts in the listed market, such as CME’s Eurodollar interest rate futures, have been posting record volumes.
It could be that the pool of outstanding interest rate futures contracts – containing a greater share of shorter-dated trades than the corresponding swaps pool – becomes rapidly more mixed when interest rates rise, generating more offsets. But that’s just one guess.
Mystery came in the form of stats revealing large variation margin calls during the first quarter, indicating some significant single-day swings in the value of cleared positions. At a group of six derivatives clearing houses, the largest VM calls during the quarter added up to $31 billion. It is unlikely the calls all took place at precisely the same time – and the clearing houses don’t have to disclose this – but they may not have been far from each other.
It’s reminiscent of the huge margin calls that took place in the days after the UK’s 2016 vote to leave the European Union – but without the very public backlash that followed that earlier episode.
Elsewhere, the data provides further support for a theme previously highlighted in this column: in clearing, the big generally tend to get bigger.
Cleared interest rate swaps
Let’s start with quarterly trends for the largest over-the-counter product: interest rate swaps.
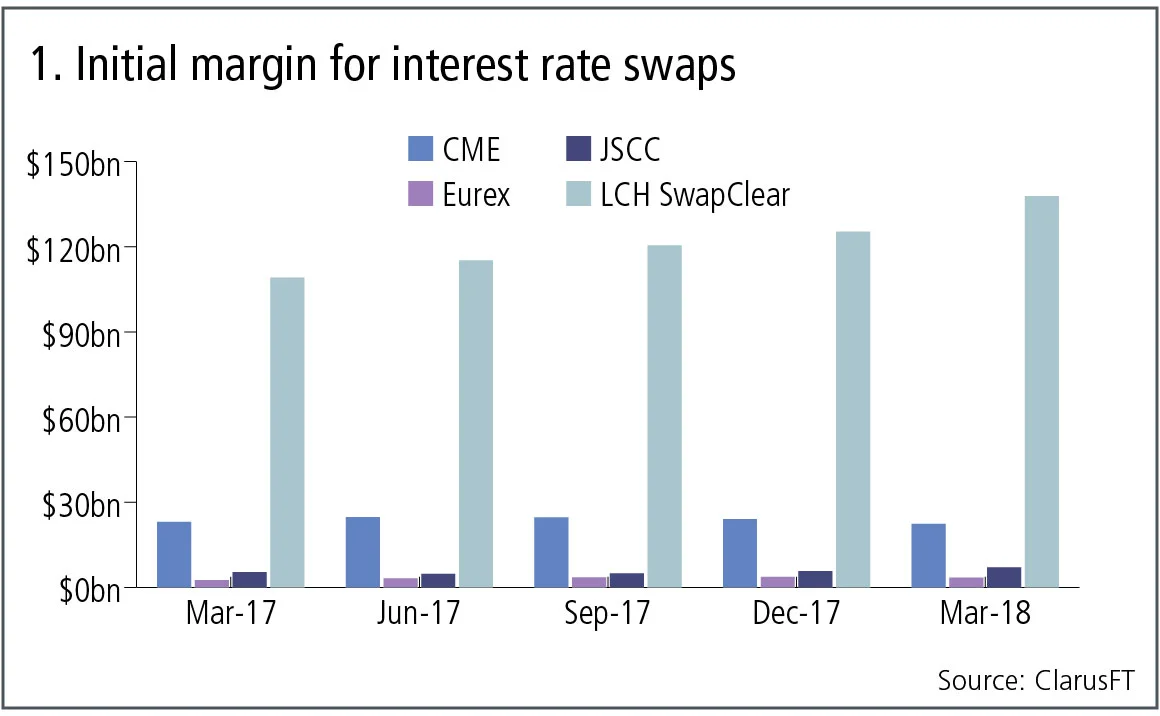
Figure 1 shows:
- Cumulative growth from $140 billion in IM at March 31, 2017 to $171 billion at March 31, 2018 – an increase of 22%.
- LCH SwapClear up 26% in US dollar terms, or 12% in sterling terms, with $138 billion of IM required at March 31, 2018, representing 81% of the total IM for the four selected clearing houses.
- CME down 3% in US dollar terms, with $22 billion of IM required at March 31, 2018, representing 13% of the total IM.
- Japan Securities Clearing Corporation (JSCC) up 32% in US dollar terms, or 25% in yen terms, with $7 billion of IM held at March 31, 2018, representing 4% of the total IM.
- Eurex up 33% in US dollar terms, or 15% in euro terms, with $3.5 billion of IM held at March 31, 2018, representing 2% of the total IM.
Apart from CME, all are showing continued strong growth in the amount of outstanding swaps risk held. One reason for this might be that in the US, mandatory clearing has long been in force, so all firms that are going to clear have been doing so for a while. In contrast, client clearing mandates and uptake in Europe and Japan are yet to reach a steady state.
Client clearing at LCH SwapClear
One way to get insight into this is to compare the trend in client margin with that for member firms’ own accounts.
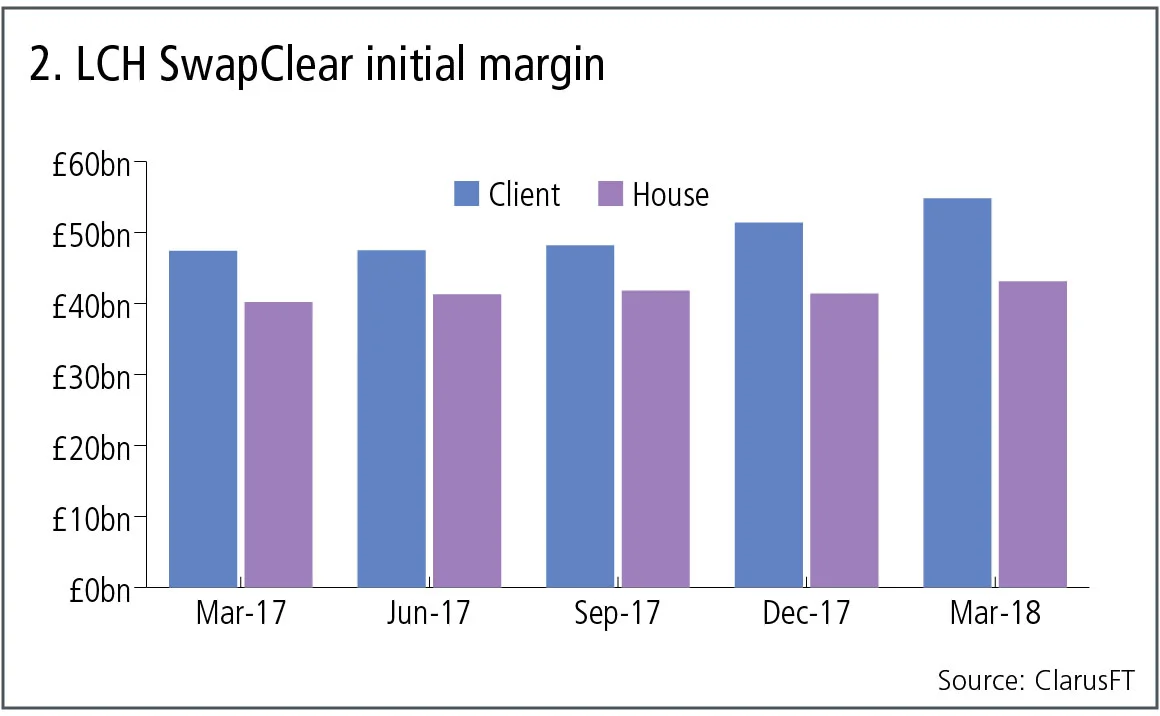
Figure 2 shows:
- Client IM higher than house and with a greater relative increase.
- Client IM of £55 billion, compared with £43 billion of house IM at March 31, 2018 – a 56% to 44% relative share.
- Client IM growing 31% over the year in US dollar terms, or 16% in sterling terms.
- House IM growing 21% over the year in US dollar terms, or 7% in sterling terms.
Cleared credit default swaps
Let’s turn next to credit default swaps, both index and single-name.
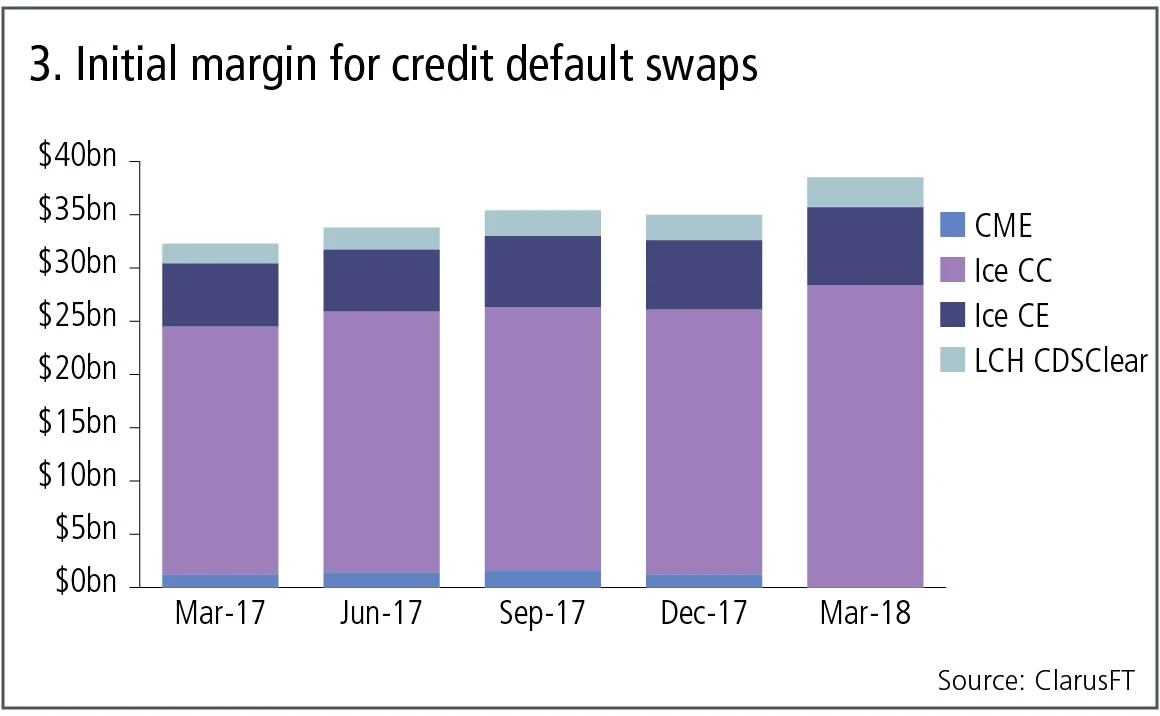
Figure 3 shows:
- Cumulative growth from $32 billion in IM at March 31, 2017, to $39 billion at March 31, 2018 – an increase of 20%.
- Ice Clear Credit up 22% in US dollar terms, with $28 billion of IM required at March 31, 2018, representing 74% of the total IM for the selected four clearing houses.
- Ice Clear Europe up 24% in US dollar terms, or 8% in euro terms, with $7 billion of IM held at March 31, 2018, representing 19% of the total IM.
- LCH CDSClear up 53% in US dollar terms, or 32% in euro terms, with $3 billion of IM held at March 31, 2018, representing 7% of the total IM.
- CME closed its CDS clearing offering at the end of 2017 and it looks like this volume is now at Ice Clear Credit.
Again, just as for interest rate swaps, credit default swaps also show strong growth in cleared risk held at clearing houses, most likely for similar clearing mandate reasons.
Futures and options
Let’s now turn to exchange-traded derivatives, to see if these markets show similar growth trends in IM.
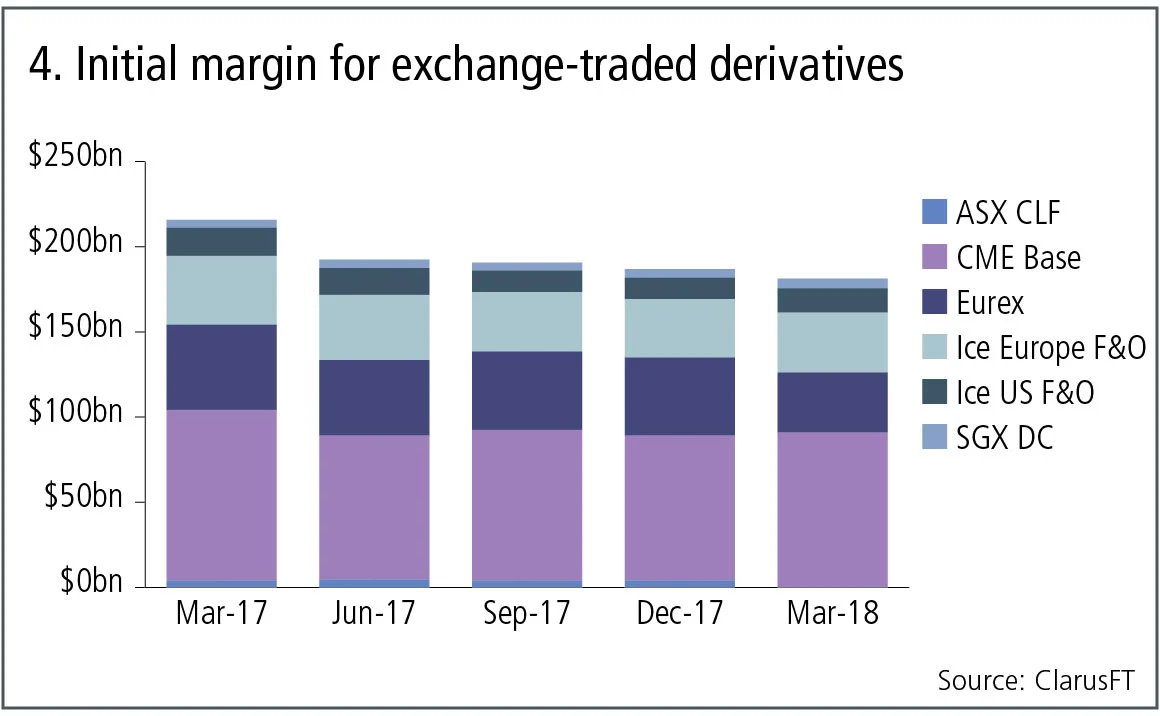
Figure 4 shows:
- Negative growth in IM requirements, which is surprising because of the growth in IM for OTC trades and the fact we have seen record volumes in some contracts, for example CME Eurodollar in the first quarter of 2018.
- For our selected six clearing houses, we see a 9% decrease in total IM from $216 billion to $197 billion.
- CME down 9% in US dollar terms, with $91 billion of IM required at March 31, 2018, which represents 46% of the total IM for these six clearing houses.
- Eurex down 5% in US dollar terms, or 18% in euro terms, with $47 billion of IM at March 31, 2018, representing 24% of the total IM.
- Ice Europe, futures and options down 13% in US dollar terms, with $35 billion of IM at March 31, 2018, representing 18% of the total IM.
- Ice US futures and options down 13% in US dollar terms, with $14 billion of IM at March 31, 2018, representing 7% of the total IM.
- SGX DC up 17% in US dollar terms, with $6 billion of IM at March 31, 2018, representing 3% of the total IM.
- ASX CLF (Concentrated Leaders Fund) flat, with $4 billion of IM at December 31, 2017, representing 2% of the total IM.
Cash movements
One of the other quantitative disclosures that drives home the size and importance of clearing, is the daily movement of cash between members and clearing houses to cover VM, and cash or securities to cover IM. In particular, the largest single-day movements in a quarter can be striking.
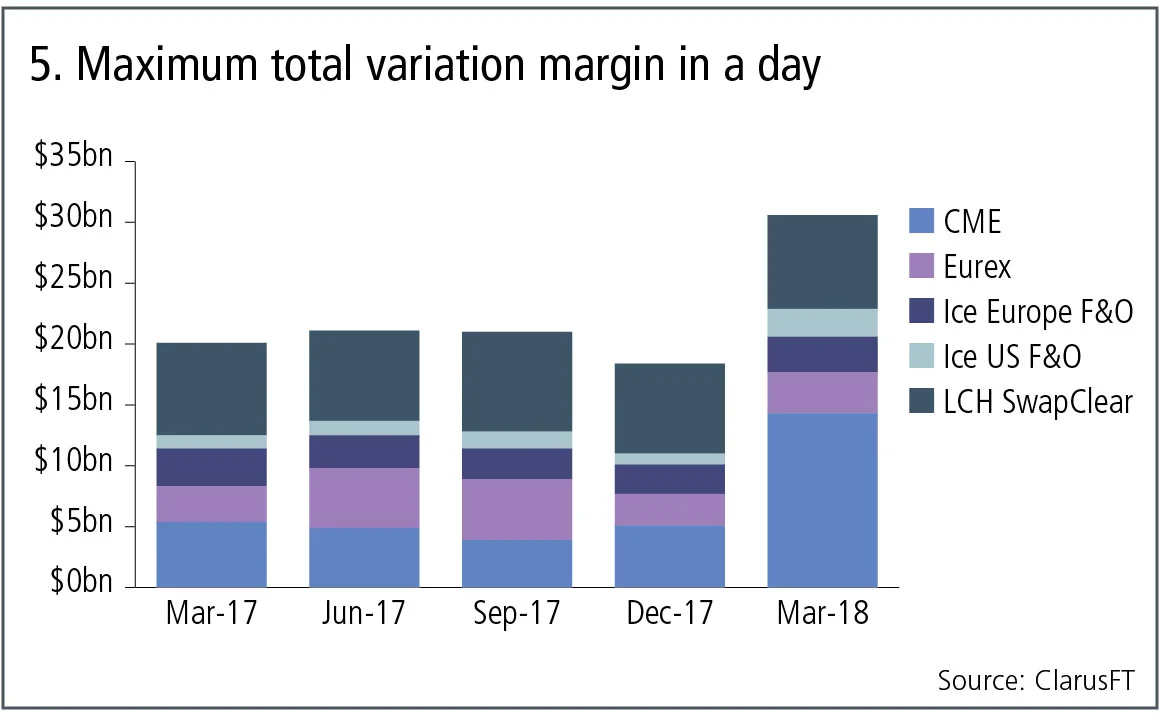
Figure 5 shows:
- That the quarter ending March 31, 2018, was the largest in the past 15 months, with a maximum total VM aggregated for the selected six clearing services of $31 billion. Probably these were not all on the same day, but most likely close in time.
- CME in particular, with a huge $14 billion daily VM call in the quarter, is much higher than its usual $5 billion.
A similar chart for the maximum aggregate IM call on a given day would show $9 billion in the quarter ending March 3, 2018, but some clearing houses include intra-day VM within this disclosure, because for IM to change that much in a day would not be credible for a measure meant to cover losses due to large market moves.
Amir Khwaja is chief executive of Clarus Financial Technology.
コンテンツを印刷またはコピーできるのは、有料の購読契約を結んでいるユーザー、または法人購読契約の一員であるユーザーのみです。
これらのオプションやその他の購読特典を利用するには、info@risk.net にお問い合わせいただくか、こちらの購読オプションをご覧ください: http://subscriptions.risk.net/subscribe
現在、このコンテンツを印刷することはできません。詳しくはinfo@risk.netまでお問い合わせください。
現在、このコンテンツをコピーすることはできません。詳しくはinfo@risk.netまでお問い合わせください。
Copyright インフォプロ・デジタル・リミテッド.無断複写・転載を禁じます。
当社の利用規約、https://www.infopro-digital.com/terms-and-conditions/subscriptions/(ポイント2.4)に記載されているように、印刷は1部のみです。
追加の権利を購入したい場合は、info@risk.netまで電子メールでご連絡ください。
Copyright インフォプロ・デジタル・リミテッド.無断複写・転載を禁じます。
このコンテンツは、当社の記事ツールを使用して共有することができます。当社の利用規約、https://www.infopro-digital.com/terms-and-conditions/subscriptions/(第2.4項)に概説されているように、認定ユーザーは、個人的な使用のために資料のコピーを1部のみ作成することができます。また、2.5項の制限にも従わなければなりません。
追加権利の購入をご希望の場合は、info@risk.netまで電子メールでご連絡ください。
詳細はこちら コメント
先物とオプションが示す戦争のコスト
現物価格は大きな混乱を示していますが、先物市場はこれが一時的なものだと示唆しており、オプション市場は不安定な状況が続くと示唆しています

担保に関して、TINAはTIAになることができるのか
あるエコノミストは、レポ取引やデリバティブ取引における担保としての米国債の優位性は、もはや揺るぎないものではないと指摘しています

オペリスクデータ:香港、2億ドルの買収案件で厳しい姿勢を示す
また、インドでは銀行職員が公的資金を横領したほか、ヴァンガードは米国のネットゼロ訴訟で和解に至りました。データ提供:ORX News

「エピサイクル」を超えて:モデルは市場に「適合」するだけでなく、市場を「説明」できなければならない
ジャン=フィリップ・ブショー氏は、モデリングにおいてボラティリティのパターンの複雑さを考慮に入れる必要があると述べています

FRTB内部モデル:クォ・ヴァディス(どこへ行く?)
2人のリスク専門家が、内部モデルの利用を促進するためにFRTBフレームワークをどのように調整すべきかについて考察しています

ポッドキャスト:ゴードン・リーが語る、若手クオンツが新人からMVPへ成長する方法
BNYの主任クオンタティブアナリストは、仕事の優先順位付けと境界線の設定がキャリアアップの鍵であると述べています。
イタリアのスプレッド問題は(常に)信用問題というわけではない
イタリアの通貨同盟における役割に対する時折の疑念が、政治リスクプレミアムを増すと、経済学者は主張しています。

市場は決して忘れない:平方根則の持続的な影響
ジャン=フィリップ・ブショー氏はトレードの流れは資産価格に大きく、かつ長期的な影響があると主張する。