
Swaps data: the big get bigger in cleared swaps
First half of 2018 sees strong growth in cleared OTC derivatives volumes, and a reinforcing of the leaders’ positions, writes Amir Khwaja of Clarus FT

As the second quarter of 2018 ends, with escalating trade tensions dominating the news, continuing uncertainty in European politics and the Federal Reserve maintaining its rate-hike path, it is a good time to take stock of cleared swap volumes.
There is a fairly simple story of growing activity across most of the big cleared products: US dollar and euro interest rate swaps, as well as US and European credit derivatives, and non-deliverable forwards, all posted a big jump in volume compared with the first half of last year.
The exception is yen interest rate swaps, with volumes dropping for both the Japan Securities Clearing Corporation and LCH’s SwapClear. But in another respect, yen swaps confirms the trend – when it comes to market share, the biggest central counterparty in each product has tended to see its position reinforced over the past six months.
Cleared US dollar swaps
Let’s start with the largest product; cleared US dollar interest rate swaps.
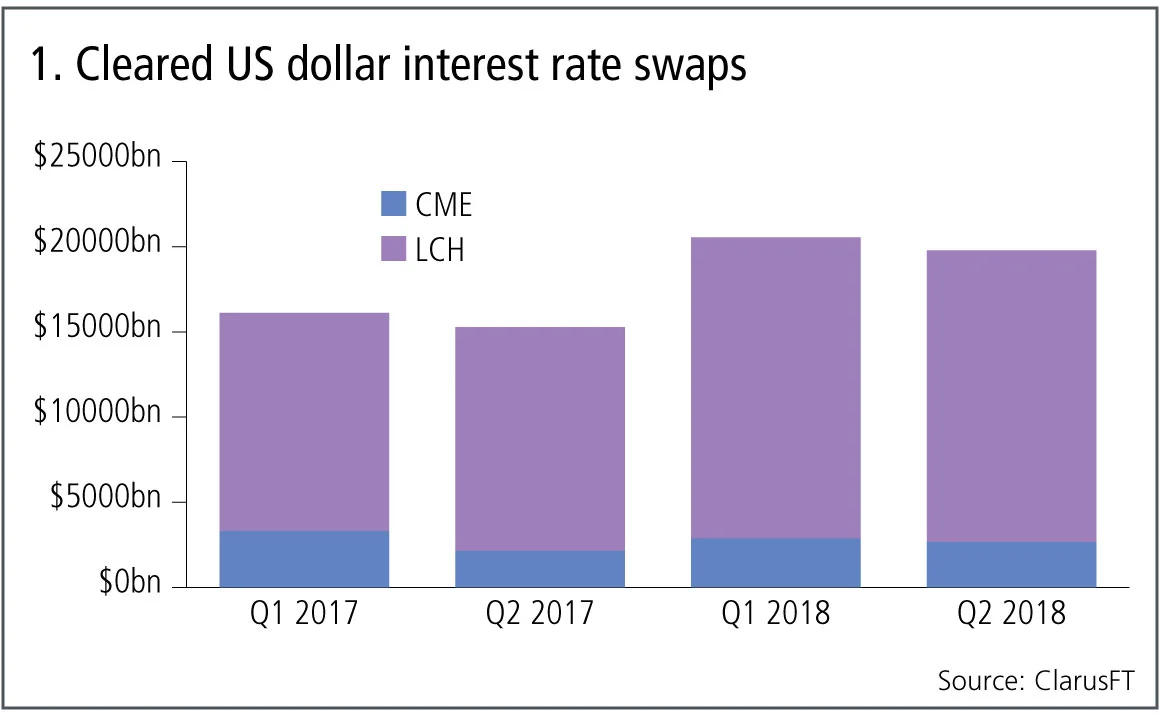
Figure 1 shows:
- Volumes significantly higher in 2018.
- $20.5 trillion in Q1 2018 and $19.8 trillion in Q2 2018.
- LCH SwapClear with 87% share and CME with 13% in Q2 2018.
- LCH SwapClear up 38% in Q1 2018 from Q1 2017 and 30% in Q2 2018 from Q2 2017.
- CME over-the-counter down 13% in Q1 2018 and up 24% in Q2 2018.
- This year has brought two strong quarters, and we also know from underlying data that a number of days in the second quarter of 2018 saw record – or close to record – daily cleared volumes.
Cleared euro swaps
Next, the second-largest product – cleared euro interest rate swaps.
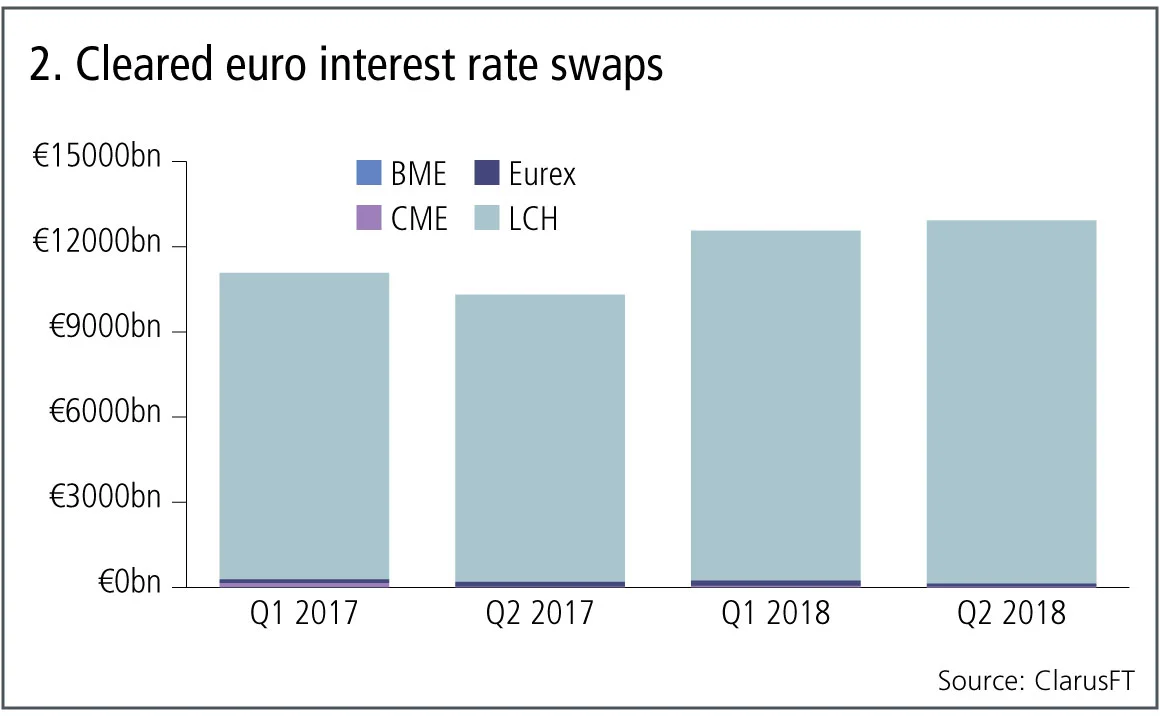
Figure 2 shows:
- Volumes again significantly higher in 2018.
- €12.6 trillion in Q1 2018 and $12.9 trillion in Q2 2018.
- LCH SwapClear with 99% volume share in Q2 2018.
- LCH SwapClear up 14% in Q1 2018 and 27% in Q2 2018.
- Eurex up 38% in Q1 2018 and down 36% in Q2 2018.
- CME OTC down 61% in Q1 2018 and down 24% in Q2 2018.
- BME with tiny volume in 2017, but little in 2018.
LCH SwapClear continues its long dominance in euro volumes with no evidence of any increase in market share at Eurex – despite some reporting to the contrary.
Cleared yen swaps
And now, looking at cleared yen interest rate swaps.
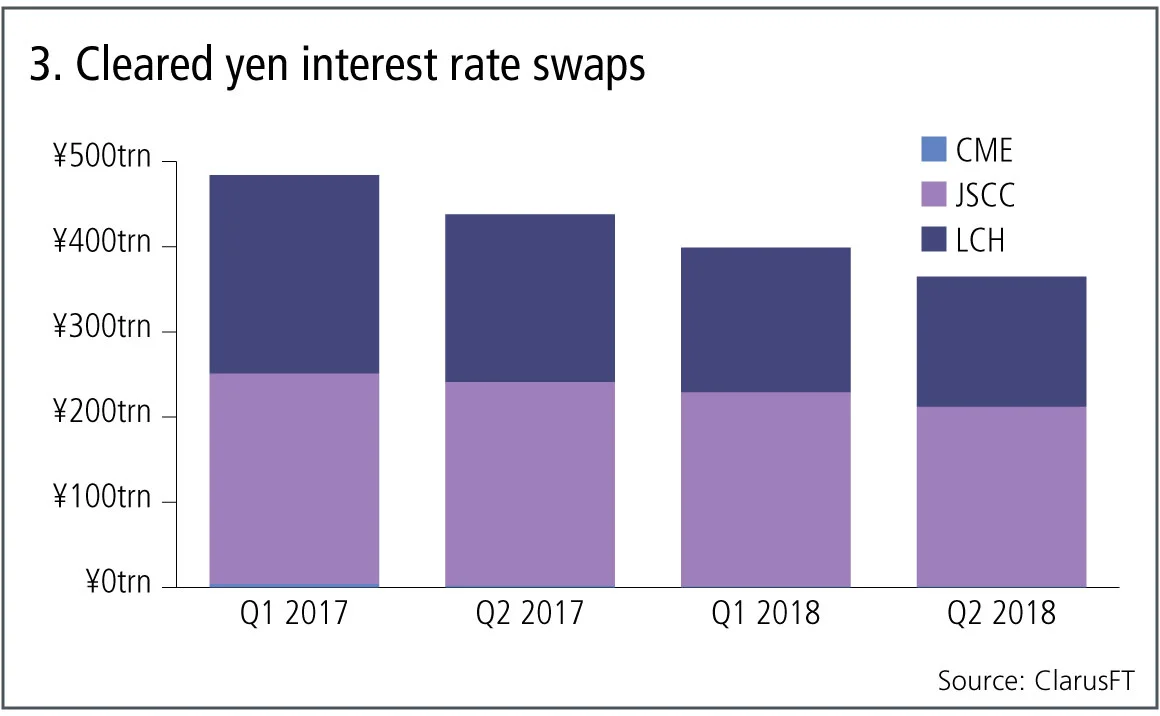
Figure 3 shows:
- Volumes for yen on a downward trend.
- ¥400 trillion in Q1 2018 and ¥365 trillion in Q2 2018.
- JSCC with 58% share and LCH SwapClear with 42% in Q2 2018.
- JSCC down 8% in Q1 2018 and down 12% in Q2 2018.
- LCH SwapClear down 27% in Q1 2018 and 22% in Q2 2018.
Cleared US dollar credit default swaps
Let’s now switch focus to credit derivatives and the volume of credit indexes and single names in US dollars.
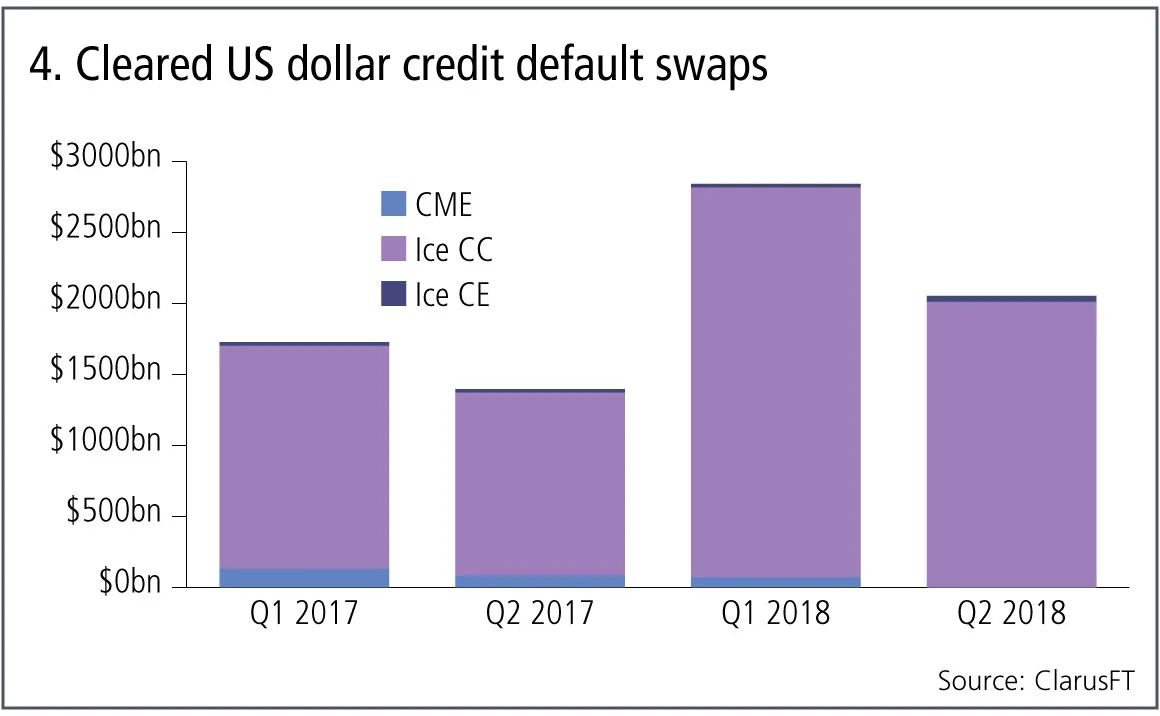
Figure 4 shows:
- Volumes significantly higher in 2018.
- $2.8 trillion in Q1 2018 and $2 trillion in Q2 2018.
- As March is the index roll month, Q1 volume is inflated by roll -volumes.
- Ice Clear Credit dominates with 98% share.
- Ice Clear Credit up 75% in Q1 2018 and 56% in Q2 2018.
- CME shutting down its service in Q2 2018.
Cleared credit derivatives volumes showing even higher growth than cleared interest rate swaps, though a much smaller market with $2 trillion to $20 trillion in gross notional over a quarter.
Cleared euro credit default swaps
Next, let’s look at the volume of credit indexes and single names in euro.
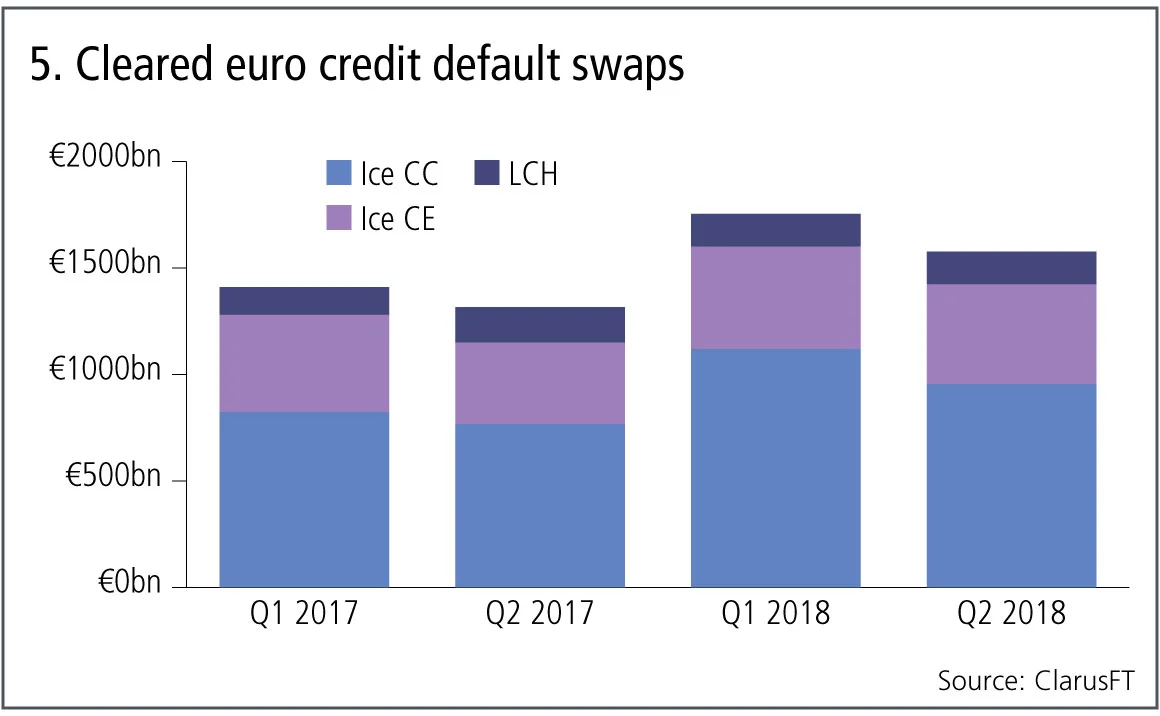
Figure 5 shows:
- Volumes also significantly higher in 2018.
- €1.75 trillion in Q1 2018 and €1.6 trillion in Q2 2018.
- Ice Clear Credit with 60% share, Ice Clear Europe 30% and LCH CDSClear with 10%.
- Ice Clear Credit up 36% in Q1 2018 and 24% in Q2 2018.
- Ice Clear Europe up 6% in Q1 2018 and 22% in Q2 2018.
- LCH CDSClear up 17% in Q1 2018 and down 8% in Q2 2018.
Cleared non-deliverable forwards
Finally let’s look at cleared non-deliverable forwards.
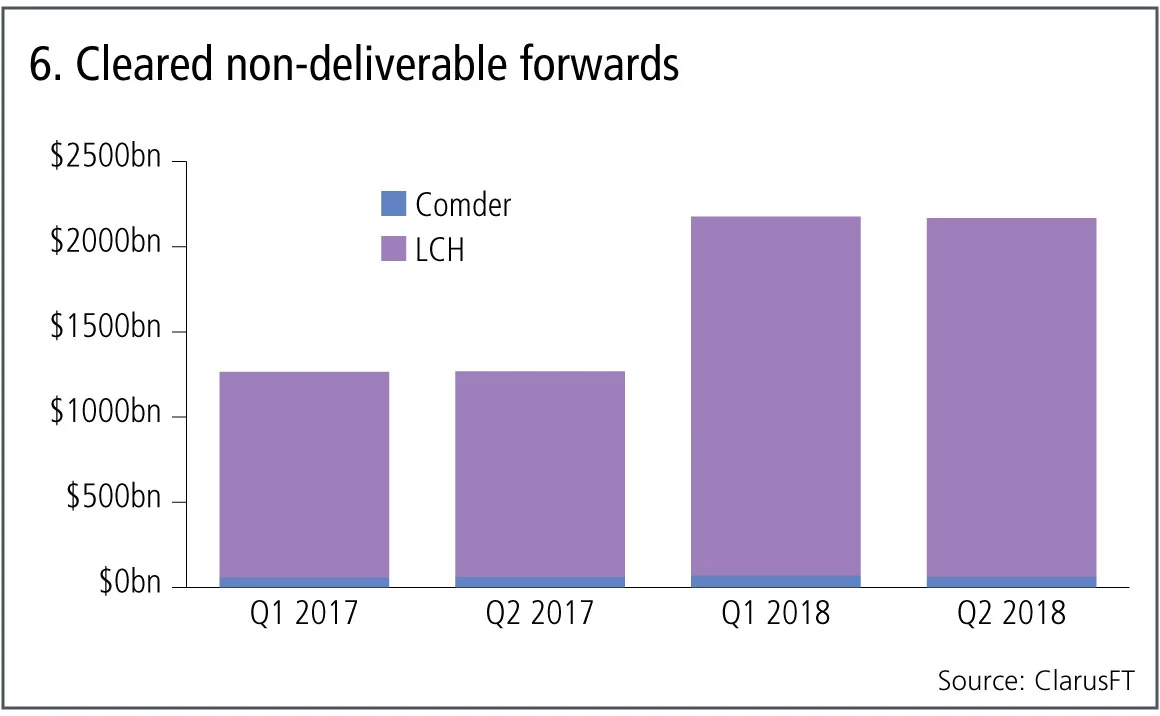
Figure 6 shows:
- Volumes again significantly higher in 2018.
- $2.2 trillion in Q1 2018 and Q2 2018.
- LCH ForexClear dominant with 97% share.
- LCH ForexClear up 74% in Q1 2018 and 74% in Q2 2018.
- Comder up 22% in Q1 2018 and 4% in Q2 2018.
Cleared non-deliverable forwards volumes are exhibiting the highest growth rates of any of the products we have covered today.
In fact, with the exception of yen interest rate swaps, all the other major cleared OTC derivatives we have looked at are significantly up in 2018 compared with 2017. In each case, the bulk of volume growth has been captured by the clearing house with the largest share in that product, and there is no visible material change in market share.
It will be interesting to see whether the upcoming quarters maintain the growth trend.
Amir Khwaja is chief executive of Clarus Financial Technology.
Only users who have a paid subscription or are part of a corporate subscription are able to print or copy content.
To access these options, along with all other subscription benefits, please contact info@risk.net or view our subscription options here: http://subscriptions.risk.net/subscribe
You are currently unable to print this content. Please contact info@risk.net to find out more.
You are currently unable to copy this content. Please contact info@risk.net to find out more.
Copyright Infopro Digital Limited. All rights reserved.
As outlined in our terms and conditions, https://www.infopro-digital.com/terms-and-conditions/subscriptions/ (point 2.4), printing is limited to a single copy.
If you would like to purchase additional rights please email info@risk.net
Copyright Infopro Digital Limited. All rights reserved.
You may share this content using our article tools. As outlined in our terms and conditions, https://www.infopro-digital.com/terms-and-conditions/subscriptions/ (clause 2.4), an Authorised User may only make one copy of the materials for their own personal use. You must also comply with the restrictions in clause 2.5.
If you would like to purchase additional rights please email info@risk.net
More on Comment
Vinicius fortune: quantifying luck in the World Cup draw
Julien Guyon explains how bias, variance and luck affect teams in this summer’s tournament – and explores wider relevance for portfolio managers

G-Sib capital surcharge: how indexing and averaging alter incentives
Capital risk strategist anticipates Basel III endgame impact on US big-bank behaviour

Podcast: Abi-Jaber and Li on a ‘sticky’ volatility problem
The pair discuss their model to jointly capture Vix, SPX and SSR

Markets perceive the future in very distorted ways
Discounting paradigms should adapt to be more realistic, says Jean-Philippe Bouchaud

Op risk data: Cyber hacks shake crypto protocols
Also: JP Morgan fined over investor losses; Symetra’s Methodist pensions mess. Data by ORX News

Prediction markets can be a canary in the coal mine
Prices of contracts on the likes of Polymarket can act as signals for risk management and hedging, says risk expert

How AI agents can join the dots for risk managers
Citi risk expert outlines agentic AI tool that would pull together structured and unstructured data on trading and lending approvals to create single, unified view of risk

Op risk data: Corporate spies spell trouble for BBVA
Also: BofA buttonholed for alleged Epstein links; minority shareholders take a bite of Brookfield. Data by ORX News
