Credit data: default risk still growing for Italy’s banks
Despite a drop in the bad loan ratio, default estimates continue to rise, writes David Carruthers of Credit Benchmark

Since the 2008 financial crisis, Italian banks have seen particularly rapid growth in non-performing loans (NPLs) compared with other eurozone countries. In the past decade, the ratio of Italian bank NPLs to total loan value increased from 5.8% in 2007 to 18.1% in 2016.
The problem is particularly acute in construction and real estate loans; these sectors make up more than 40% of corporate NPLs in Italy. While nearly three-quarters of Italian bank loans are secured by personal guarantees or real estate collateral, the Italian House Price index has fallen by more than 15% since 2010.
Italy’s oldest and third-largest bank, Monte dei Paschi (MPS), was bailed out by the Italian government in mid-2017. This may have represented a turning point – World Bank data shows the NPL ratio decreased from 18.1% to 17.1% in 2017. But this is still nearly four times that of the European Union average, and International Montetary Fund data shows that under current projections, Italian GDP may not return to its pre-crisis level until 2025 – that may help explain why, despite the recent reduction in bad loans over the past year, default risk has continued to increase in 2018.
Elsewhere this month, we look at sovereign credit risk in sub-Saharan Africa, and report on credit trends of the top 500 global companies vs the top 500 US companies. We also discuss the credit distribution of small and medium-sized enterprises (SMEs) in the US.
Global credit industry trends
Figure 1 shows industry migration trends for the most recent published data.
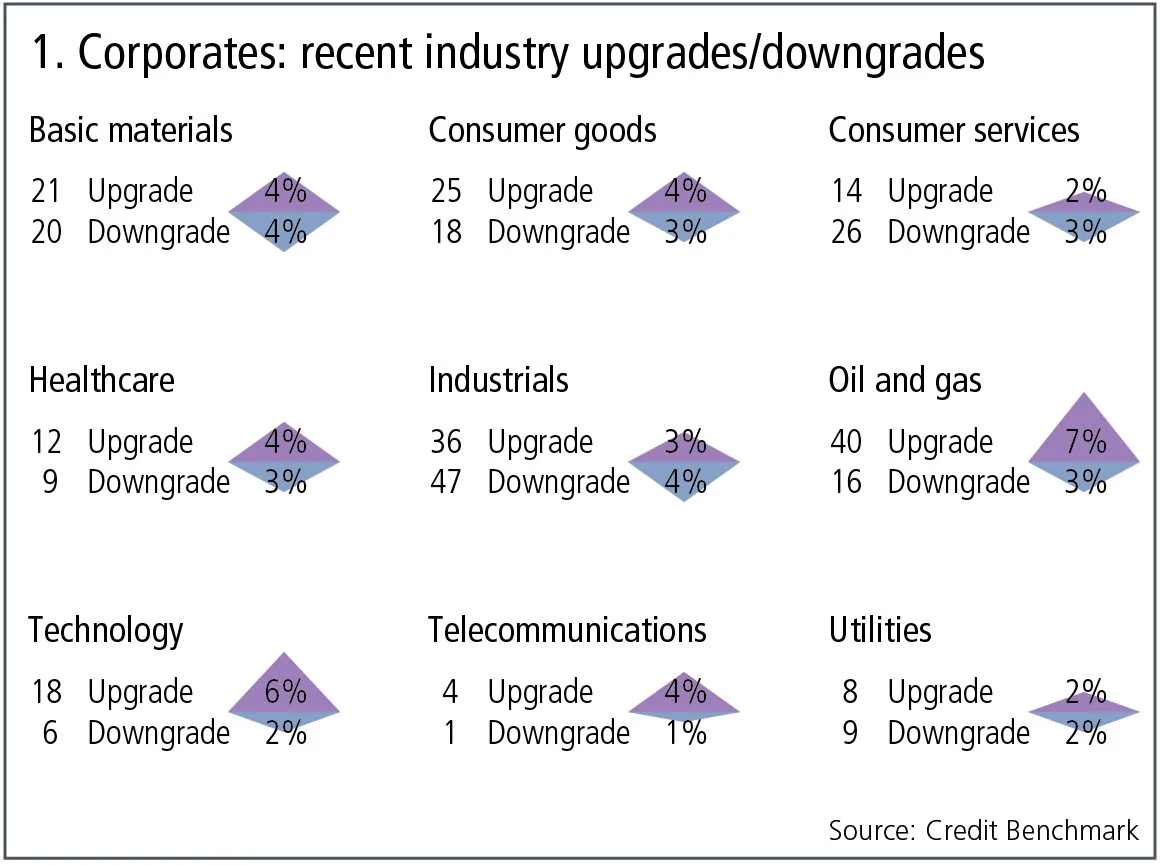
Figure 1 shows:
- In global corporates, consensus upgrades outnumber downgrades. Upgrades dominate downgrades in five out of nine industries. Two industries are dominated by upgrades and two are balanced.
- Overall, 4% of the global corporates obligors have improved and 3% show a deterioration. Compared with the previous month, the imbalance has switched in favour of upgrades.
- Consumer services and industrials continue their trend from last month, with downgrades outnumbering upgrades.
- Healthcare, consumer goods and telecommunications now favour upgrades after a period of downgrades outweighing upgrades.
- After a month of balance, both oil and gas and technology have continued their previous trend of upgrades outweighing downgrades.
- Utilities has returned to balance after a quarter of downgrades outweighing upgrades, as has basic materials, which saw a period of upgrades outnumbering downgrades.
Italian banks
Figure 2 shows the average credit quality level and trends for large Italian banks (45 banks), large EU banks (540 banks), and the top 30 global systemically important banks.
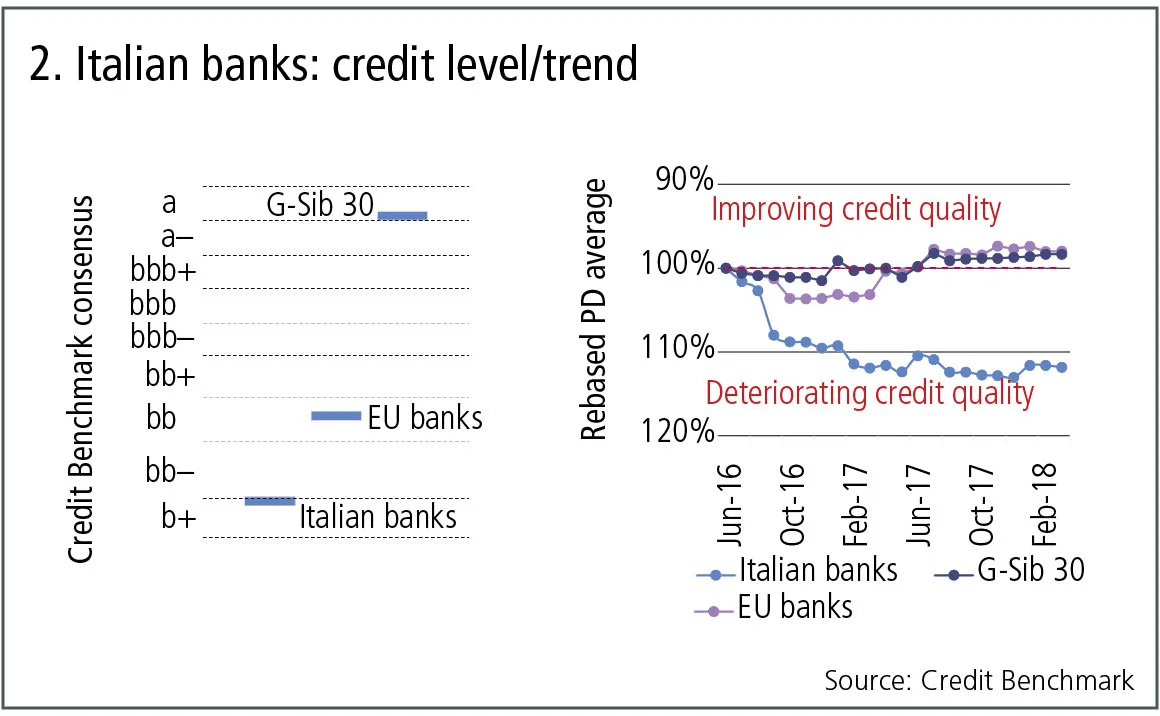
Figure 2 shows:
- Large Italian banks have the lowest Credit Benchmark consensus (CBC), which is b+, while the CBC of EU banks is bb and the CBC of the G-Sib 30 is a.
- The credit quality of these Italian banks has deteriorated by just over 10%, while the credit quality of the EU and G-Sib banks has slightly improved.
- The decline was particularly sharp in 2016, but the trend has been towards deterioration in 15 out of the 21 months plotted here.
Sub-Saharan Africa
In a recent Regional Economic Outlook, the IMF discusses the increase in debt levels across sub-Saharan African countries. This debt growth is mainly a response to very favourable frontier market borrowing terms offered during the cheap money environment of the past few years.
But the IMF report estimates 40% of low-income sub-Saharan African countries are now in or close to debt distress. These countries typically rely on debt-driven public investment to drive growth, but much of the recent issuance has been in foreign currency. If US interest rates continue to rise and potentially strengthen the dollar, there will be considerable refinancing pressure on all indebted frontier countries.
The following chart is based on bank-sourced estimates for 21 sovereigns in the region. It plots the balance of sovereigns with improving vs deteriorating credit quality, and also shows the rebased trend for sovereign risk in these countries.
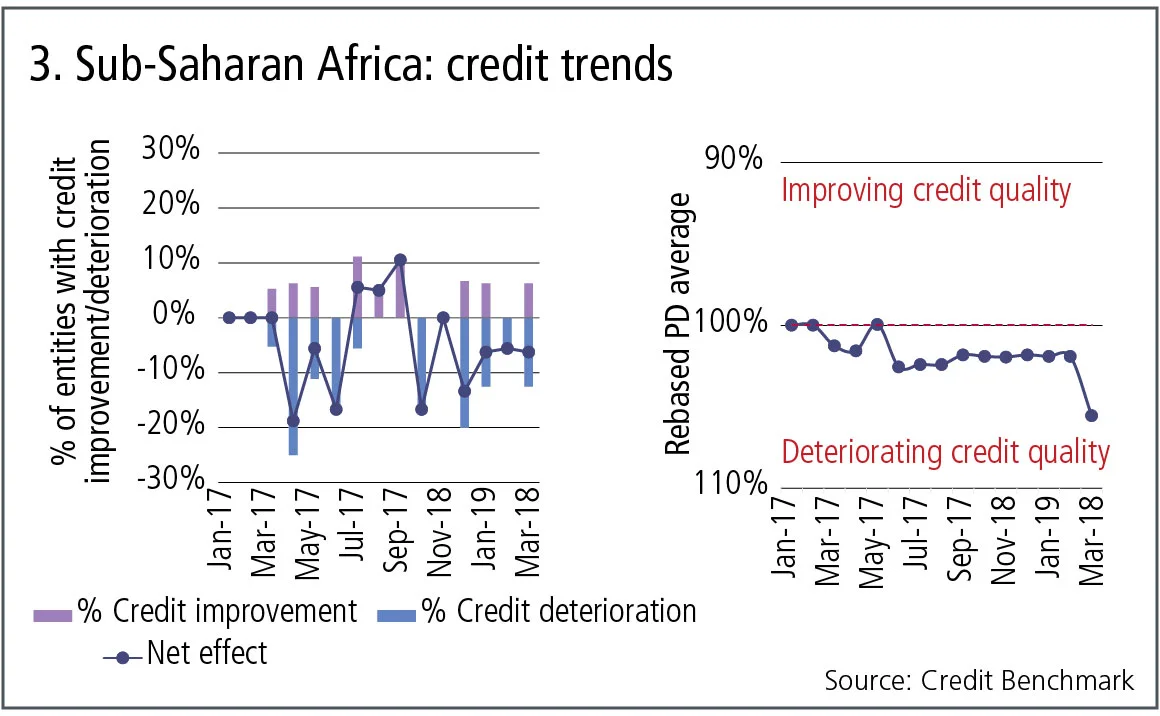
Figure 3 shows:
- A sustained trend towards credit deterioration – the increasing risk of debt distress has already affected the credit quality of sub-Saharan African countries.
- Over the past 20 months, credit risk has increased for 10 countries and has improved for only five.
- Apart from a modest recovery in Q2 2017, the credit quality trend has been stable or down for most of this period, with one country – Angola – driving a particularly sharp deterioration in the most recent month.
Global 500 vs US 500 – the Trump effect?
Since Donald Trump took office, US government policy has focused on creating a business-friendly environment for corporate America. A combination of tax cuts and selective increases in spending has been good for profits, share prices and consensus credit ratings. There is more uncertainty about the long-term effects of trade tariffs – there is a risk that some US industries may see short-term windfall gains eroded by long-term declines in trading volumes.
Figure 4 shows the credit distribution and credit trends for the largest 500 companies in the US compared with the global equivalent.
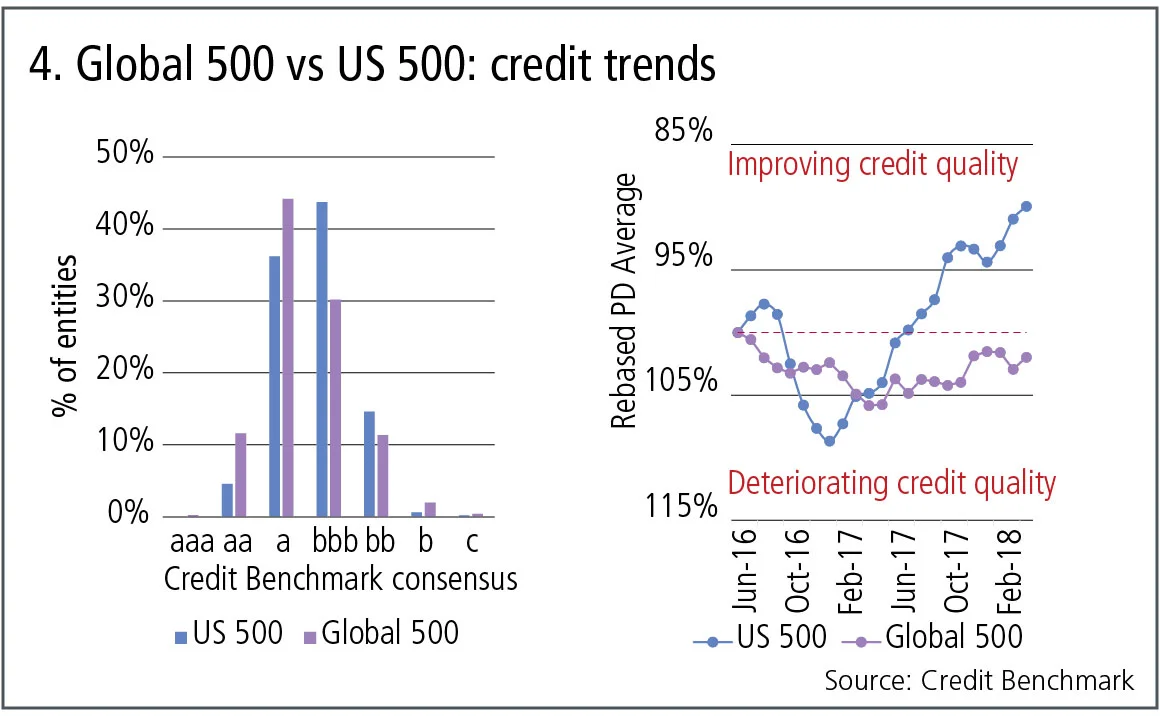
Figure 4 shows:
- Both the top 500 global companies and the top US companies have an average Credit Benchmark consensus of bbb–.
- Compared with the US 500, the global 500 has a higher proportion of companies in the a category, but the distribution is positively skewed.
- The global 500 has been broadly stable over the period, with a 5% deterioration followed by a modest improvement.
- The US 500 saw a rapid deterioration in credit quality until early 2017, having decreased by about 10%. However, it has shown a steady improvement over the past year and now shows an overall improvement of 10%.
SME corporate credit distribution
The Basel revisions published in December 2017 include a risk-weighted average (RWA) weight of 85% for SMEs. This may create some unusual lending incentives depending on the typical credit quality of these smaller companies.
Figure 5 compares the US SME credit distribution with that of large US corporates; both of these samples cover private companies – ie, they have no bonds or equities in issue – so they would not qualify as investment grade under the Basel 2017 rules for the US and similar jurisdictions where nationally recognised statistical rating organisation ratings are inadmissible for RWA purposes.
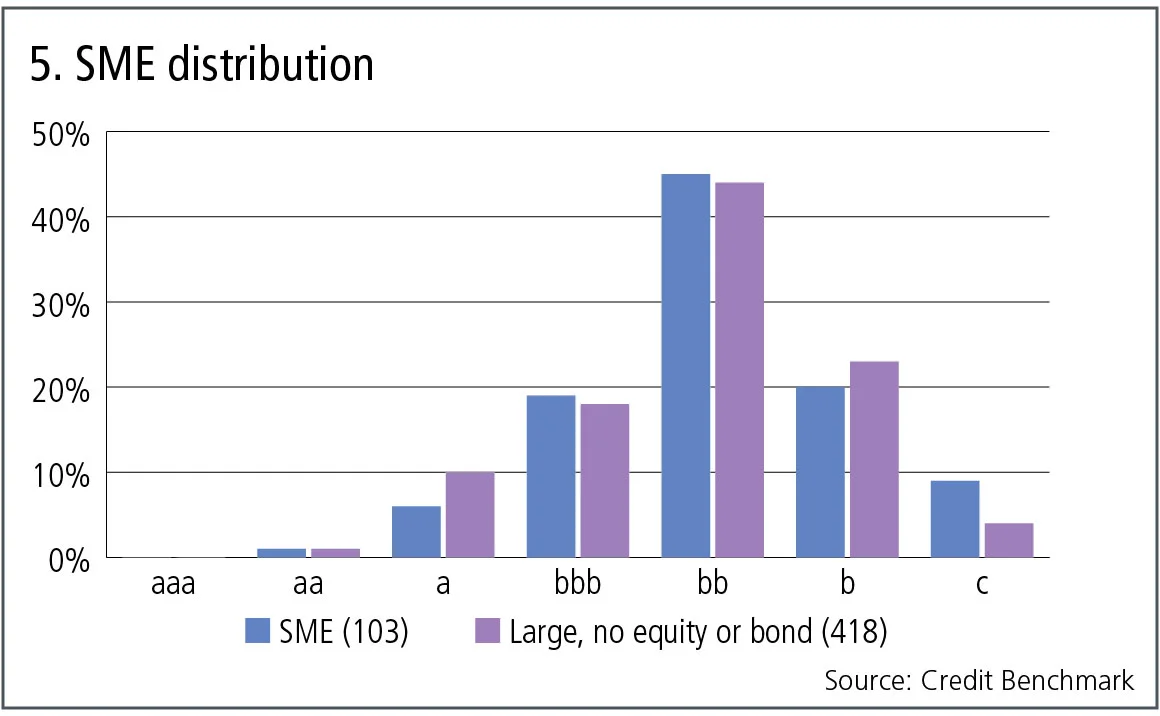
Figure 5 shows:
- The credit risk of 103 private SME companies is slightly lower than that of 418 large private companies.
- Both categories are dominated by the bb category.
- Both categories show a very low share of investment-grade obligors; these account for 26% of private SMEs and 29% of large private companies.
About this data
The Credit Benchmark dataset is based on internally modelled credit ratings from a pool of contributor banks. These are mapped into a standardised 21-bucket ratings scale, so downgrades and upgrades can be tracked on a monthly basis. Obligors are only included where ratings have been contributed by at least three different banks, yielding a total dataset of almost 19,400 names, which is growing by 5% per month.
David Carruthers is head of research at Credit Benchmark.
コンテンツを印刷またはコピーできるのは、有料の購読契約を結んでいるユーザー、または法人購読契約の一員であるユーザーのみです。
これらのオプションやその他の購読特典を利用するには、info@risk.net にお問い合わせいただくか、こちらの購読オプションをご覧ください: http://subscriptions.risk.net/subscribe
現在、このコンテンツを印刷することはできません。詳しくはinfo@risk.netまでお問い合わせください。
現在、このコンテンツをコピーすることはできません。詳しくはinfo@risk.netまでお問い合わせください。
Copyright インフォプロ・デジタル・リミテッド.無断複写・転載を禁じます。
当社の利用規約、https://www.infopro-digital.com/terms-and-conditions/subscriptions/(ポイント2.4)に記載されているように、印刷は1部のみです。
追加の権利を購入したい場合は、info@risk.netまで電子メールでご連絡ください。
Copyright インフォプロ・デジタル・リミテッド.無断複写・転載を禁じます。
このコンテンツは、当社の記事ツールを使用して共有することができます。当社の利用規約、https://www.infopro-digital.com/terms-and-conditions/subscriptions/(第2.4項)に概説されているように、認定ユーザーは、個人的な使用のために資料のコピーを1部のみ作成することができます。また、2.5項の制限にも従わなければなりません。
追加権利の購入をご希望の場合は、info@risk.netまで電子メールでご連絡ください。
詳細はこちら コメント
オペリスクデータ:サイバー攻撃が暗号資産プロトコルを揺るがす
他にも:JPモルガンが投資家の損失をめぐり罰金処分を受けた、Symetraのメソジスト系年金基金をめぐる混乱など。データ提供:ORX News

予測市場は、炭鉱のカナリアのような役割を果たすことがある
リスクの専門家によると、Polymarketなどのプラットフォームにおける契約価格は、リスク管理やヘッジの指標となり得るとのことです

AIエージェントがリスク管理者の課題解決にどう役立つ
シティのリスク専門家は、取引や融資承認に関する構造化データと非構造化データを統合し、リスクに関する単一かつ統一されたビューを構築する自律型AIツールについて概説しました

オペリスク・データ:企業スパイがBBVAに脅威をもたらす
他にも:BofAがエプスタイン氏との関与疑惑で追及されています。また、少数株主がブルックフィールドに異議を唱えています。データ提供:ORX News

AI政治の台頭
MASの顧問であるデビッド・ハードーン氏は、AIを単なる一つの技術として扱うべきではないと述べています

AIリスク管理と能力制御への移行
リスク管理者によると、検証の枠組みを見直すことで、銀行はイノベーションと規制上の要件を両立させ、強固なリスク管理体制を維持することができます

トークン化された商品市場は、経済の円滑な運営に寄与する可能性がある
暗号資産の専門家は、実物資産をブロックチェーンに移行することで、担保に関する摩擦が緩和されると主張しています

GenAIの時代において、未だに優れたモデルが必要なのはなぜなのか?
ジャン=フィリップ・ブショー氏は、モデルが人工知能をレジームシフトの過程で導き、過学習から遠ざけることができると述べています