Swaps data: the allure of liquidity
Liquidity in OTC trading concentrates at one venue, or splits across three, writes Amir Khwaja of Clarus FT

It’s often said that clearing is a business that naturally tends to monopoly. The primary burden for most users is the funding cost generated by margin calls, so bigger central counterparties – that are able to reduce margin demands via netting – will attract more business.
That’s the theory, and it seems to hold true in practice, as an earlier column showed.
But what about trading? A similar argument could be made here – liquidity is a force that exerts a strong gravitational pull, with bigger venues crowding out smaller ones.
This month, I look at market share by venue for different over-the-counter derivatives products. In some cases, there is a single, dominant player; in others, liquidity tends to be split across three competitors.
Credit index
Let’s start with credit index swap (CDX and iTraxx) volumes at swap execution facilities (Sefs). US persons are required to trade these products on these venues, which are regulated by the Commodity Futures Trading Commission.
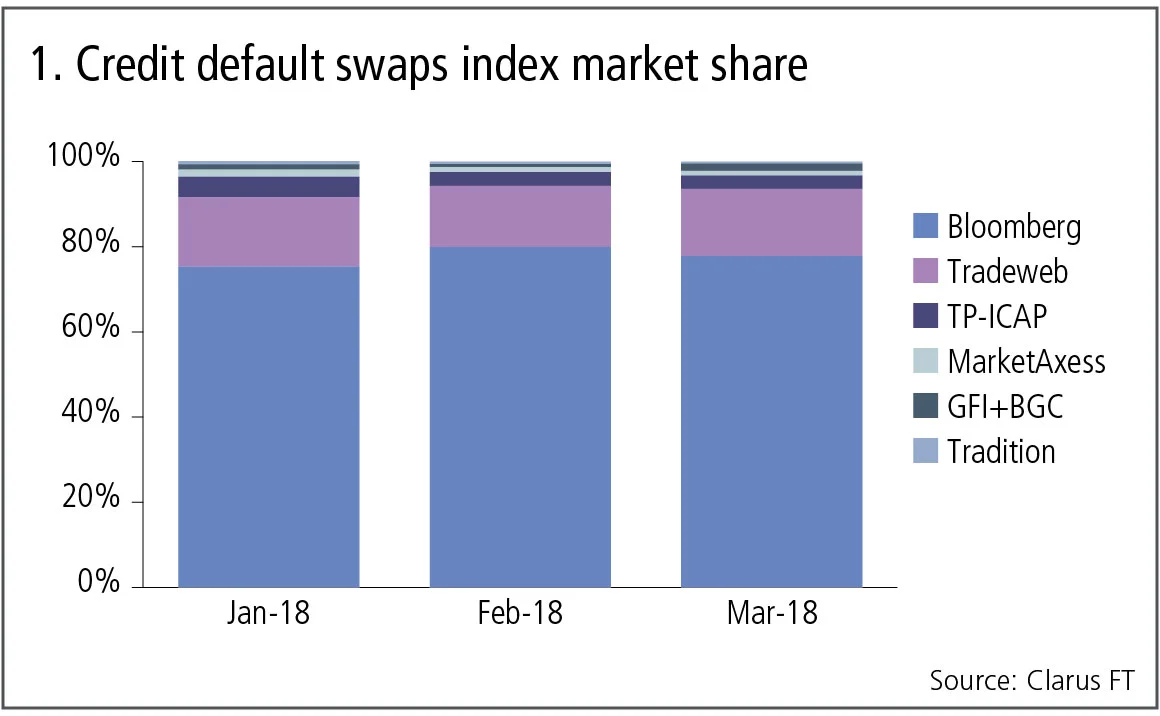
Figure 1 shows:
- Bloomberg dominates market share with a 78% average in Q1 2018.
- Tradeweb has 15%, with the other venues a long way behind.
For this product, execution volumes are highly concentrated and similar to the dominant clearing concentration of CDS indexes at Ice Clear Credit.
Non-deliverable forwards
Next let’s look at non-deliverable forward (NDF) volumes at Sefs, a product that has moved decisively from bilateral to cleared.
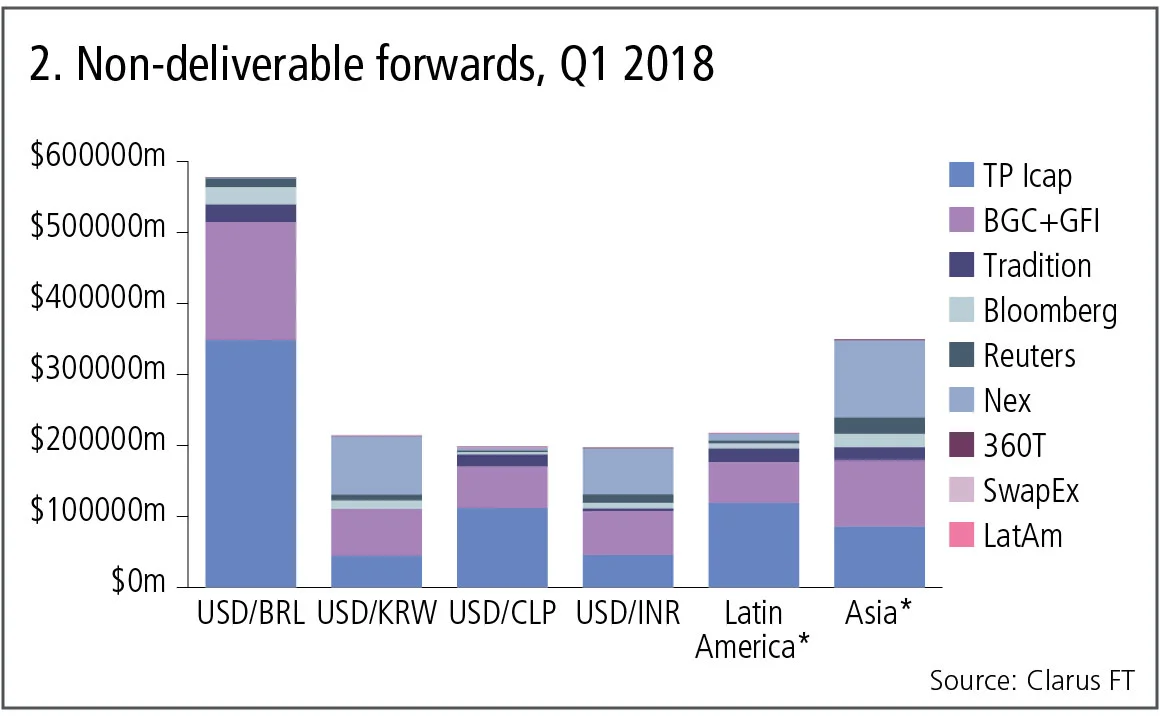
Figure 2 shows:
- US dollar/Brazilian real is by far the largest currency pair with $575 billion traded in the quarter. TP Icap dominates with a 60% share, as it does in US dollar/Chilean peso and other Latin American currency pairs.
- US dollar/Korean won and US dollar/Indian rupee are much more evenly shared with Nex, BGC/GFI and TP Icap, as are the other Asian currency pairs.
In all then, there is more diversity for NDFs, with Latin American currency pairs exhibiting significant liquidity concentration at one execution venue, while Asian pairs are split between three competing venues.
Forex options
Foreign exchange options are the next big product that clearing houses are targeting in 2018, so let’s again turn to Sef volumes for the largest currency pairs.
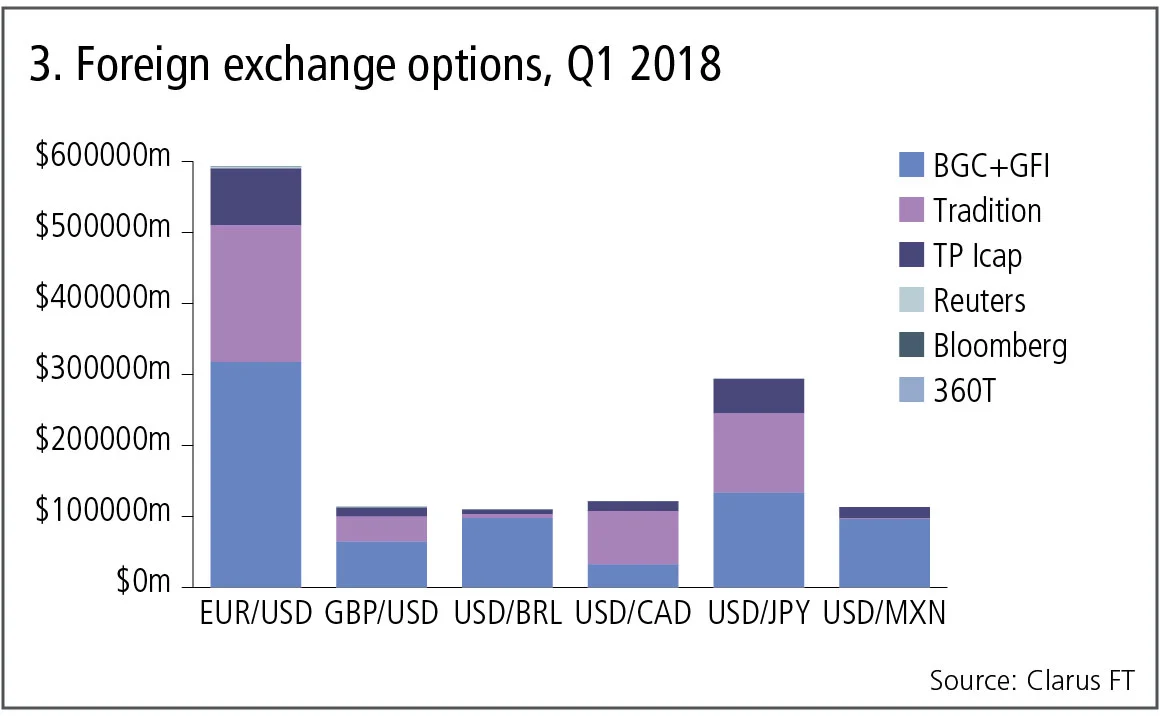
Figure 3 shows:
- Euro/US dollar is by far the largest currency pair with $600 billion traded in the quarter. Market share is split between BGC/GFI with 54%, Tradition 33% and TP Icap 13%.
- US dollar/yen shows a similar split but is slightly more even.
- US dollar/Brazilian real and US dollar/Mexican peso are dominated by BGC/GFI.
- US dollar/Canadian dollar is dominated by Tradition.
- BGC/GFI has the lion’s share of trading in sterling/US dollar.
Broadly, the picture for options is similar to that for NDFs, with some currency pairs highly concentrated at one execution venue, while others are split between three competing venues.
Interest rate swaps
Next let’s turn to the largest product, interest rate swaps.
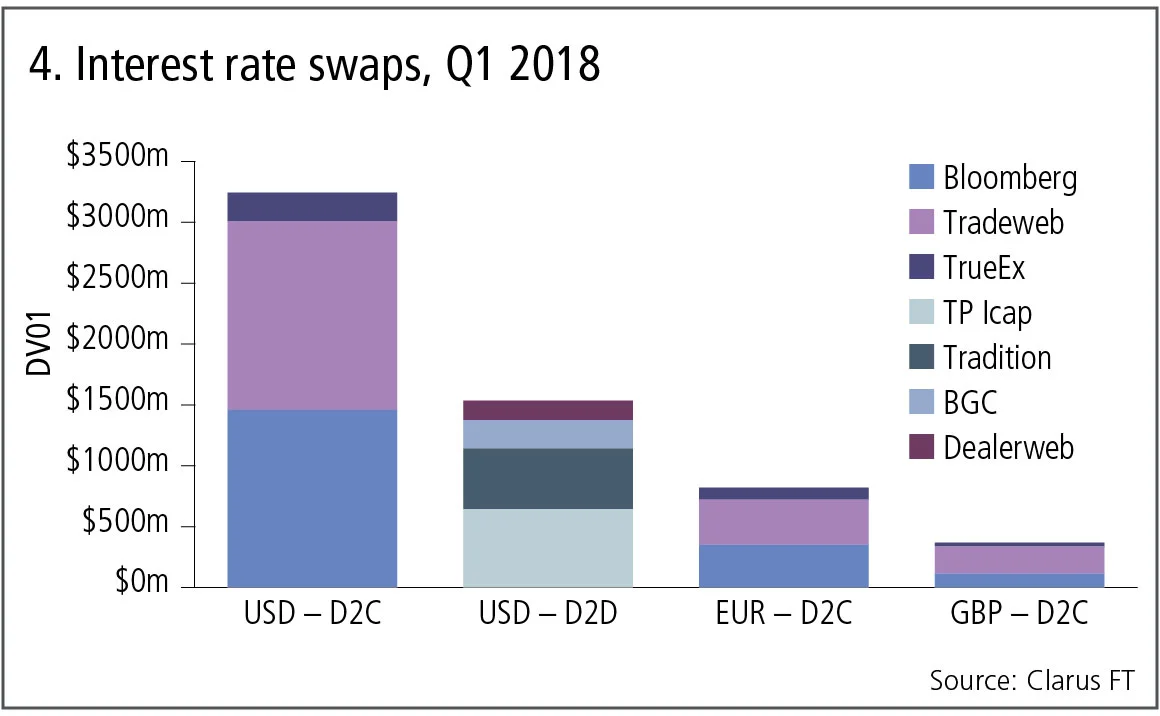
Figure 4 shows:
- US dollar interest rate swaps at dealer-to-client Sefs is the largest market, at $3 billion in DV01 or $6 trillion in gross notional, with market share evenly split between Bloomberg and Tradeweb.
- US dollar swaps at dealer-to-dealer Sefs adds up to $1.5 billion in DV01, where TP-Icap has 42% and Tradition has 32%.
- For euro and sterling interest rate swaps in the dealer-to-client segment, Tradeweb is ahead of Bloomberg, but significant chunks of the business is non-price forming list trading.
Turning next to non-US dollar interest rate swaps in the dealer-to-dealer venues.
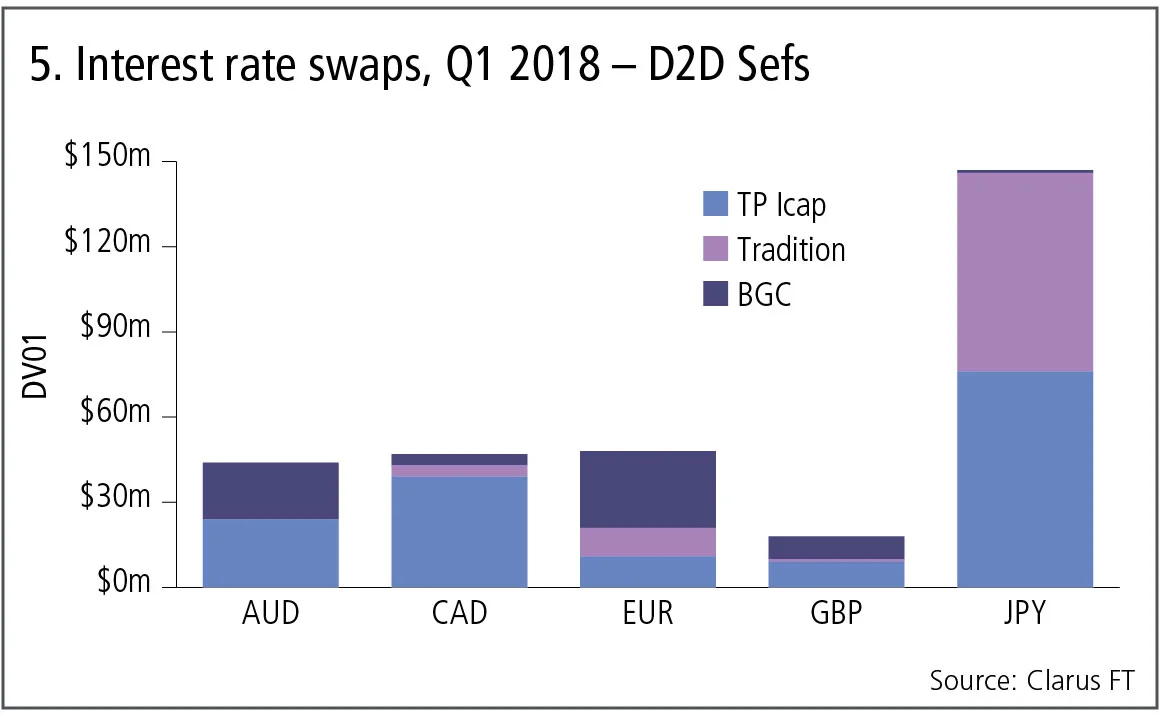
Figure 5 shows:
- Volumes are much lower here. Even yen interest rate swaps, as the largest, is only $150 million in DV01.
- TP Icap is the largest in Australian and Canadian dollars.
- Sterling and yen is split between two venues.
- BGC is the largest in euros.
- Euro swap volumes are just $50 million in DV01 or $75 billion gross notional, a small fraction of the US dollar interest rate swap volume.
Clearly very little interdealer trading of euro swaps takes place on US Sefs.
Europe and MTFs
For that, we need to turn to Europe, and the equivalent of Sefs, namely multilateral and organised trading facilities (MTFs and OTFs).
Unfortunately, as discussed in last month’s swap data review, four months after the implementation of new post-trade transparency rules in the Markets in Financial Instruments Directive, it remains a massively complex task to answer even the simple question of the market share split for euro interest rate swaps.
Today, all I can point to is Bloomberg MTF, one of the largest venues, which has been exemplary in publishing post-trade transparency data and making it public in a simple, machine-readable format.
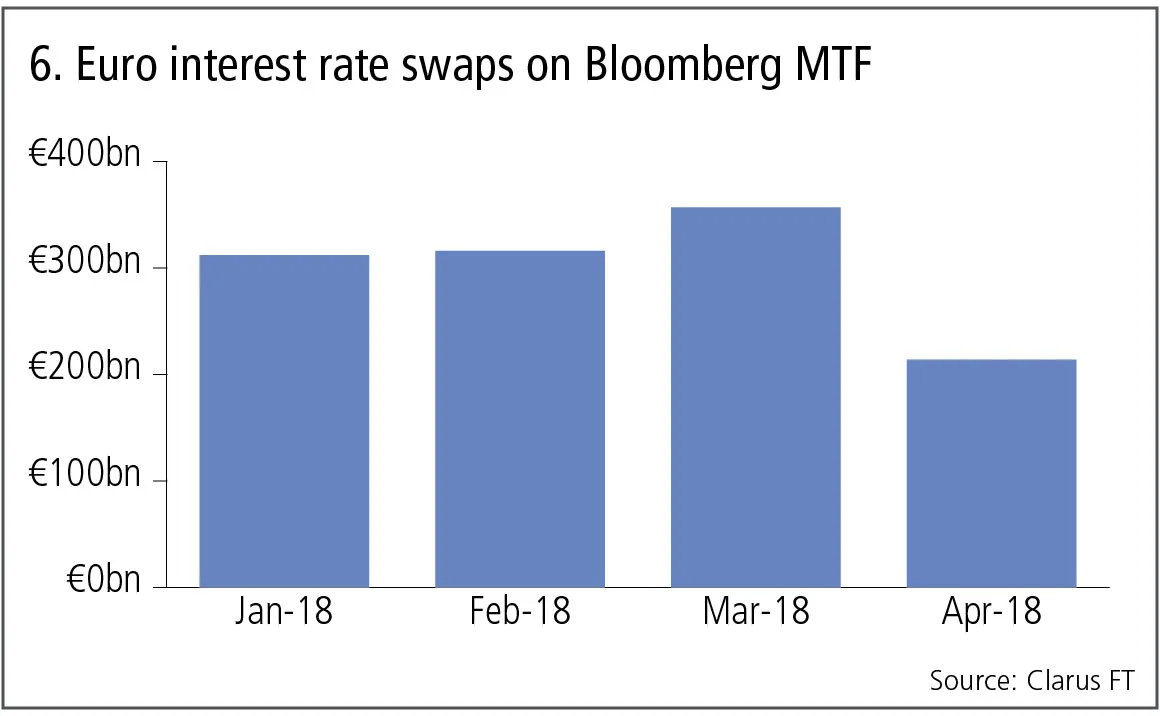
Figure 6 shows:
- Just over €300 billion gross notional was traded in each of the first two months.
- In March, volumes hit €360 billion.
- April appears low, but that is a result of four-week deferral rules that are currently in place, meaning we need to wait to see the full volume.
I can only hope that, when I write this column in a year’s time, the situation has changed. It would be a colossal waste of effort, money and regulation if it remains impossible to produce a simple chart of swaps market share.
Amir Khwaja is chief executive of Clarus Financial Technology.
コンテンツを印刷またはコピーできるのは、有料の購読契約を結んでいるユーザー、または法人購読契約の一員であるユーザーのみです。
これらのオプションやその他の購読特典を利用するには、info@risk.net にお問い合わせいただくか、こちらの購読オプションをご覧ください: http://subscriptions.risk.net/subscribe
現在、このコンテンツを印刷することはできません。詳しくはinfo@risk.netまでお問い合わせください。
現在、このコンテンツをコピーすることはできません。詳しくはinfo@risk.netまでお問い合わせください。
Copyright インフォプロ・デジタル・リミテッド.無断複写・転載を禁じます。
当社の利用規約、https://www.infopro-digital.com/terms-and-conditions/subscriptions/(ポイント2.4)に記載されているように、印刷は1部のみです。
追加の権利を購入したい場合は、info@risk.netまで電子メールでご連絡ください。
Copyright インフォプロ・デジタル・リミテッド.無断複写・転載を禁じます。
このコンテンツは、当社の記事ツールを使用して共有することができます。当社の利用規約、https://www.infopro-digital.com/terms-and-conditions/subscriptions/(第2.4項)に概説されているように、認定ユーザーは、個人的な使用のために資料のコピーを1部のみ作成することができます。また、2.5項の制限にも従わなければなりません。
追加権利の購入をご希望の場合は、info@risk.netまで電子メールでご連絡ください。
詳細はこちら コメント
オペリスク・データ:企業スパイがBBVAに脅威をもたらす
他にも:BofAがエプスタイン氏との関与疑惑で追及されています。また、少数株主がブルックフィールドに異議を唱えています。データ提供:ORX News

AI政治の台頭
MASの顧問であるデビッド・ハードーン氏は、AIを単なる一つの技術として扱うべきではないと述べています

AIリスク管理と能力制御への移行
リスク管理者によると、検証の枠組みを見直すことで、銀行はイノベーションと規制上の要件を両立させ、強固なリスク管理体制を維持することができます

トークン化された商品市場は、経済の円滑な運営に寄与する可能性がある
暗号資産の専門家は、実物資産をブロックチェーンに移行することで、担保に関する摩擦が緩和されると主張しています

GenAIの時代において、未だに優れたモデルが必要なのはなぜなのか?
ジャン=フィリップ・ブショー氏は、モデルが人工知能をレジームシフトの過程で導き、過学習から遠ざけることができると述べています

取引のスピードがガバナンスを上回る時:一瞬の統制の隙間
デリバティブの専門家によると、光駆動型エレクトロニクスの新たな形態が、市場インフラにおける次のリスクとなる可能性があるとのことです

先物とオプションが示す戦争のコスト
現物価格は大きな混乱を示していますが、先物市場はこれが一時的なものだと示唆しており、オプション市場は不安定な状況が続くと示唆しています

担保に関して、TINAはTIAになることができるのか
あるエコノミストは、レポ取引やデリバティブ取引における担保としての米国債の優位性は、もはや揺るぎないものではないと指摘しています