
Swaps data: the monopoly effect in clearing
There are only a handful of products where clearing volumes are evenly split between rivals

Regulators made swaps clearing a plank of their post-crisis reforms for good reasons – they wanted the management of counterparty risk to be carried out by tightly regulated, centralised hubs, in a more visible, standardised way. They probably did not want to create a tiny group of systemically important monopolies, but that was always one possible outcome.
Exchanges and central counterparties (CCPs) benefit immensely from netting effects, so scale tends to win out.
This tendency can be seen when breaking down cleared derivatives volumes for the full year of 2017 by asset class. LCH dominates the interest rate and foreign exchange markets, while Ice is by far the biggest clearer of credit derivatives.
A more nuanced picture emerges when asset classes are broken down by currency. Suddenly, other names appear: for example, ASX in Australian dollars, CME in Brazilian reals, Mexican peso and US dollar, Comder in Chilean peso, Japan Securities Clearing Corporation (JSCC) in yen, Shanghai Clearing House in yuan.
In some cases, these CCPs have a foothold, in others they are completely dominant – only in a couple of cases is market share evenly split between a couple of strong venues.
There are reasons to think this may change for some products over the coming year – Eurex may be able to capitalise on the uncertainty created by Brexit, for example. But if liquidity continues to attract liquidity, it will be interesting to see how regulators – and the market itself – responds.
Cleared interest rate swaps in major currencies
First, let’s look at gross notionals for cleared swaps in 2017 – encompassing vanilla interest rate swaps, overnight index swaps, basis swaps, zero coupon swaps and variable notional swaps for the six major currencies.
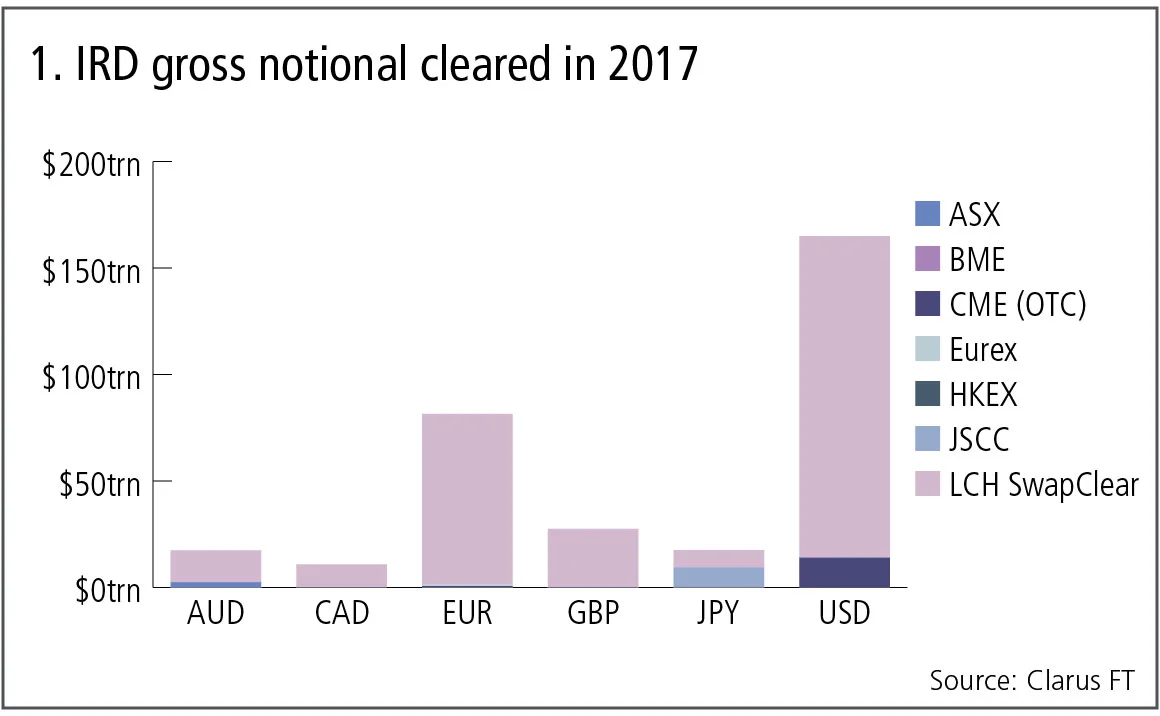
Figure 1 shows:
- The US dollar is by far the largest with $165 trillion of gross notional (single-sided).
- Euro next with $81.5 trillion of gross notional.
- Sterling follows with $27.5 trillion.
- Australian dollar and yen are similar with $17.5 trillion.
- Canadian dollar has $11 trillion.
- This means there is a cumulative gross notional of $320 trillion.
LCH’s SwapClear dominates the volume in each of these major currencies, which we can represent in a 100% stacked bar chart.
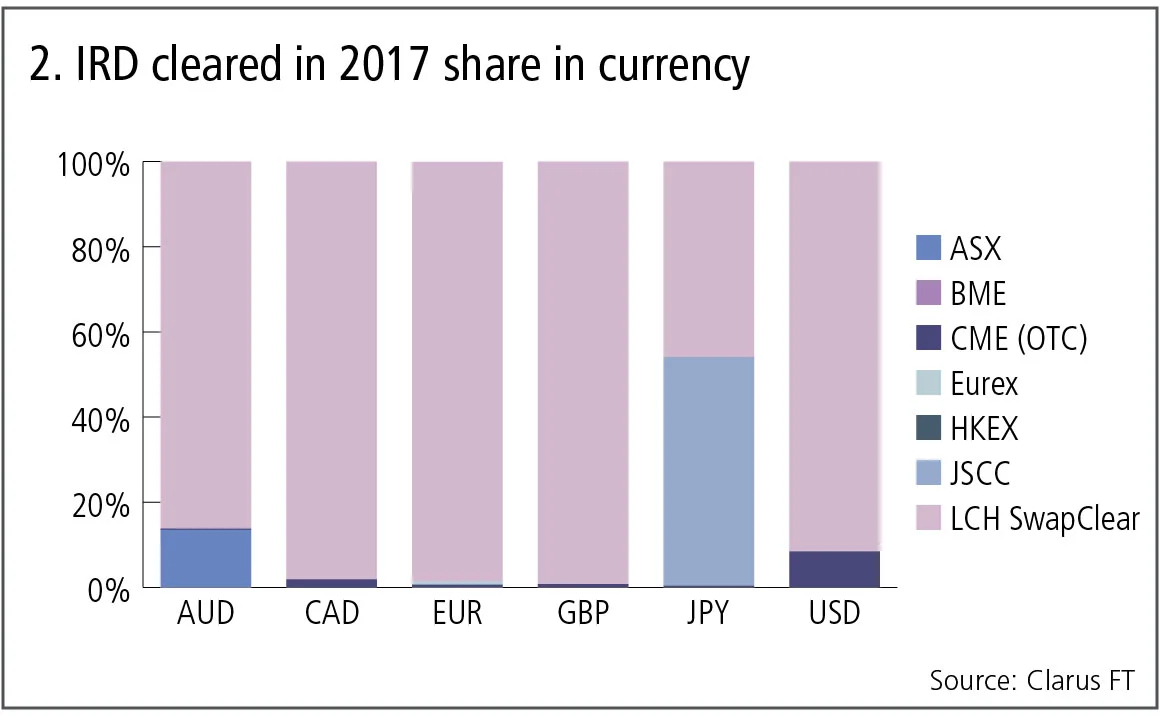
Figure 2 shows:
- In Australian dollars, SwapClear has 86% share and ASX 13.5%.
- In Canadian dollars, euros and sterling, SwapClear has more than a 98% share.
- In yen, JSCC has 53.7% and SwapClear has a 45.9% share.
- In US dollars, SwapClear has 91.6% and CME has an 8.4% share.
The dominance of LCH SwapClear is understandable as it was the first clearing house to offer interest rate swaps clearing – starting in 1999 – and there are significant network netting and cost efficiencies for members and clients in having all currencies in one clearing service.
However, the growth of JSCC, which for the first time in 2017 exceeded SwapClear in yen volume, shows it is possible for regional clearing houses to dominate in their domestic currency. ASX and CME have also captured positions in their domestic currencies.
Leading up to Brexit in March 2019, it is likely we will see BME and Eurex gain market share. Whether this reduces SwapClear’s share in euro swaps to 90% or 50% - and in what timeframe – is impossible to predict. The best we can do is observe month-on-month data and project trends. Last year’s data doesn’t suggest an impending sea-change, but 2018 is a key year in this regard.
Cleared interest rate swaps in more currencies
Let’s now turn to other currencies where 2017 cleared gross notional exceeded $1 trillion.
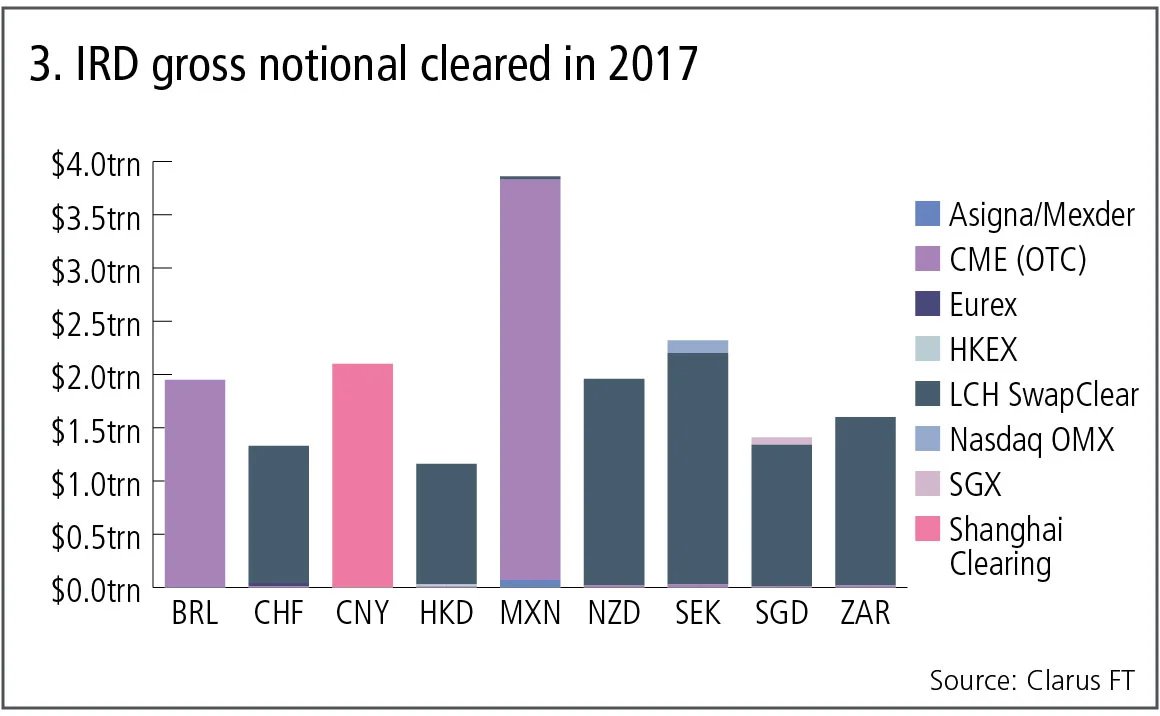
Figure 3 shows:
- The Mexican peso is by far the largest with $4 trillion gross notional.
- The Swedish krona is next with $2.3 trillion.
- The yuan, Brazilian real and New Zealand dollar follow, each with around $2 trillion.
- The cumulative gross notional in these nine currencies is $18 trillion.
- CME dominates the Brazilian real and Mexican peso.
- Yuan is dominated by Shanghai Clearing House.
- LCH dominates in the rest.
- Nasdaq in Swedish krona, SGX in Singapore dollar and Mexder in Mexican peso are also visible in the chart.
Interestingly, none of the Danish krone, Hungarian forint, Norwegian kroner or Polish zloty – each active swap markets – makes this list.
Cleared credit derivatives
Next up: volumes of cleared credit index trades and single-name credit default swaps (CDSs).
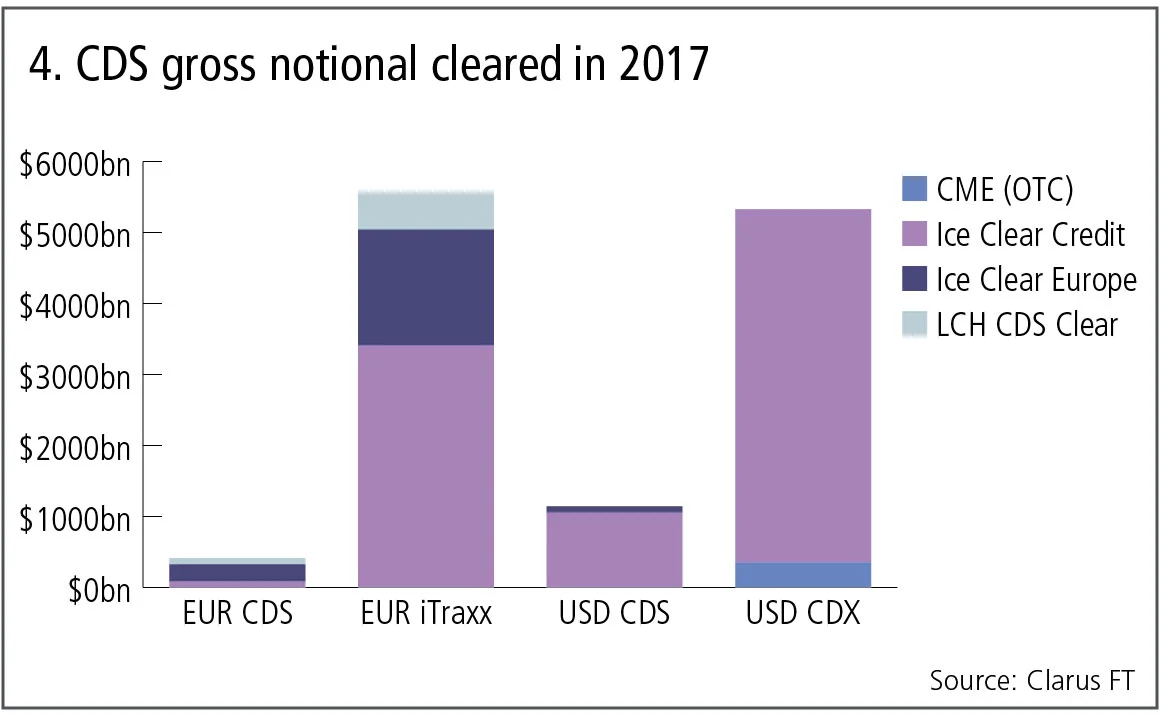
Figure 4 shows:
- Euro iTraxx and US dollar CDX are similar in size, each at $5.5 trillion gross notional.
- US dollar CDS notionals are much lower at $1.1 trillion.
- Euro CDS notionals are lower still at $400 billion.
- Yen iTraxx and CDSs – at JSCC – are too small to show on the chart.
- Ice Clear Credit dominates US dollar CDX with 93% share and US dollar CDSs with 92% share.
- Ice Clear Credit is also the largest in euro iTraxx with 61%.
- Ice Clear Europe has 59% of euro CDS notionals and 29% of euro iTraxx.
- LCH CDSClear has 21% of euro CDS notionals and 9.5% of euro iTraxx.
In a similar manner to interest rates, one clearing house – in this case, Ice – dominates volumes.
Cleared foreign exchange derivatives
Non-deliverable forwards (NDFs) are currently the only cleared OTC forex derivative, so let’s look next at their volumes in 2017, broken out by the largest currency pairs.
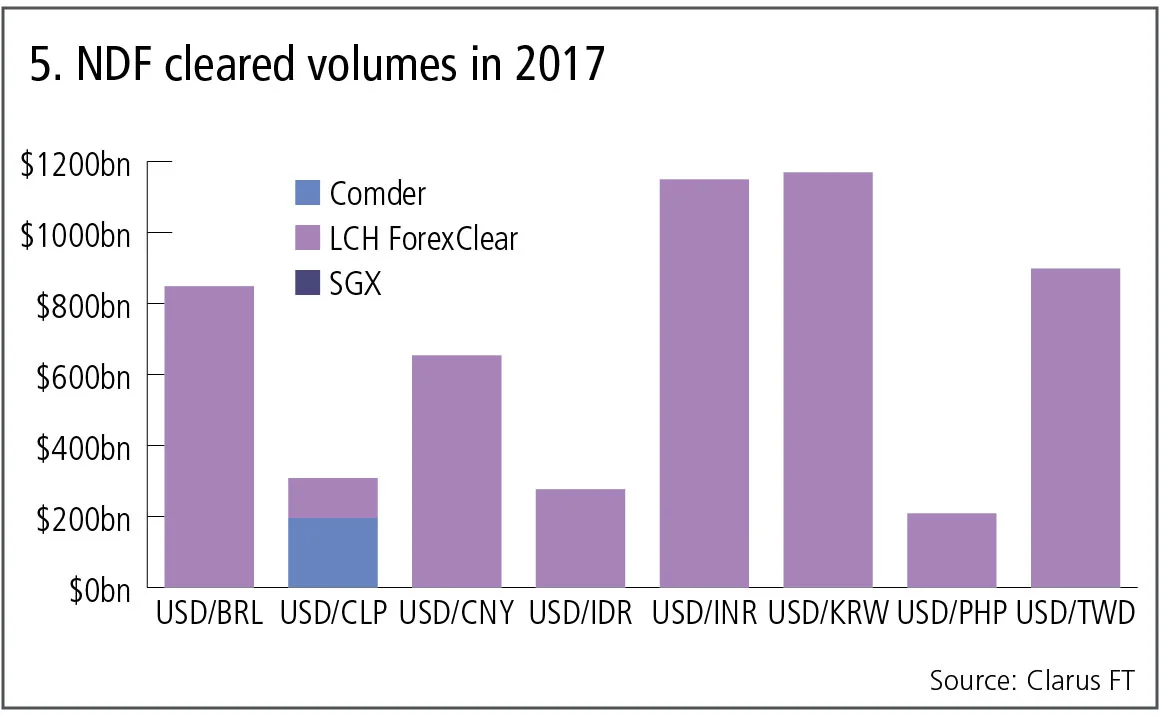
Figure 5 shows:
- South Korean won and Indian rupee are the largest currency pairs, each with $1.15 trillion gross notional.
- Taiwan dollar and Brazilian real are next with $0.9 trillion and $0.85 trillion, respectively.
- Yuan with $0.65 trillion is the other currency greater than $0.5 trillion.
- The cumulative volume of the largest eight currencies is $5.5 trillion.
- That makes the market roughly comparable to US dollar CDX or euro iTraxx.
- Volumes are dominated by LCH’s ForexClear.
We know cleared NDF volumes at ForexClear saw massive year-on-year growth in 2017 – a well-reported consequence of the imposition of new margin requirements for non-cleared derivatives. It will be interesting to see whether this growth continues into 2018 and beyond.
Even more interesting is the fact that both CME and LCH expect to launch clearing of forex options this year – a big derivatives product, and one to watch in 2018.
In summary, the data shows market share in each asset class is currently dominated by a single clearing house with a few regional exceptions.
Only users who have a paid subscription or are part of a corporate subscription are able to print or copy content.
To access these options, along with all other subscription benefits, please contact info@risk.net or view our subscription options here: http://subscriptions.risk.net/subscribe
You are currently unable to print this content. Please contact info@risk.net to find out more.
You are currently unable to copy this content. Please contact info@risk.net to find out more.
Copyright Infopro Digital Limited. All rights reserved.
As outlined in our terms and conditions, https://www.infopro-digital.com/terms-and-conditions/subscriptions/ (point 2.4), printing is limited to a single copy.
If you would like to purchase additional rights please email info@risk.net
Copyright Infopro Digital Limited. All rights reserved.
You may share this content using our article tools. As outlined in our terms and conditions, https://www.infopro-digital.com/terms-and-conditions/subscriptions/ (clause 2.4), an Authorised User may only make one copy of the materials for their own personal use. You must also comply with the restrictions in clause 2.5.
If you would like to purchase additional rights please email info@risk.net
More on Comment
G-Sib capital surcharge: how indexing and averaging alter incentives
Capital risk strategist anticipates Basel III endgame impact on US big-bank behaviour

Podcast: Abi-Jaber and Li on a ‘sticky’ volatility problem
The pair discuss their model to jointly capture Vix, SPX and SSR

Markets perceive the future in very distorted ways
Discounting paradigms should adapt to be more realistic, says Jean-Philippe Bouchaud

Op risk data: Cyber hacks shake crypto protocols
Also: JP Morgan fined over investor losses; Symetra’s Methodist pensions mess. Data by ORX News

Prediction markets can be a canary in the coal mine
Prices of contracts on the likes of Polymarket can act as signals for risk management and hedging, says risk expert

How AI agents can join the dots for risk managers
Citi risk expert outlines agentic AI tool that would pull together structured and unstructured data on trading and lending approvals to create single, unified view of risk

Op risk data: Corporate spies spell trouble for BBVA
Also: BofA buttonholed for alleged Epstein links; minority shareholders take a bite of Brookfield. Data by ORX News

The rise of AI politics
AI should not be treated as just another technology, writes MAS adviser David Hardoon
