Credit data: Brexit gloom lifting for UK companies?
David Carruthers of Credit Benchmark looks at the most recent trends in bank-sourced credit data

Economically, the world is doing well. Growth forecasts paint a picture of strong, synchronous expansion across the globe. Of course, there are laggards, and one is the UK, with its relative underperformance often chalked up to the uncertainty wreaked by the country’s 2016 vote to end its membership of the European Union.
This was the scenario that Remain campaigners, who wanted the UK to stay in the EU, warned about. But it did not kick in as quickly as some expected. A previous analysis of default probabilities (PDs) for UK companies, using data for the 12 months to April 2017, showed credit risk increasing after initially seeming resilient to the vote.
Now, the data shows an improvement in the strength of certain sectors. Over the past three months, there has been a significant increase in strength for consumer goods, telecommunications and utilities companies. Default risk for the basic materials sector has worsened over that timeframe, but the longer-term trend is positive.
What does all of this mean? It may simply be that a rising tide elsewhere in the world is lifting the UK’s slightly leaky boats. The long-term outlook is hard to assess, and there may be signs of that in a more detailed look at the basic materials sector. In other cases, when credit quality improves, banks use it as an opportunity to lend to riskier companies, but that does not appear to be happening here; one explanation is that lenders are being particularly careful.
Also this month, we compare credit risk trends in the UK and the US – assessing the credit risk ranking and credit risk trends of financials and health services – and we review the diversity of banks’ PD estimates by industry.
Global credit industry trends
Figure 1 shows industry migration trends for the most recently published data.
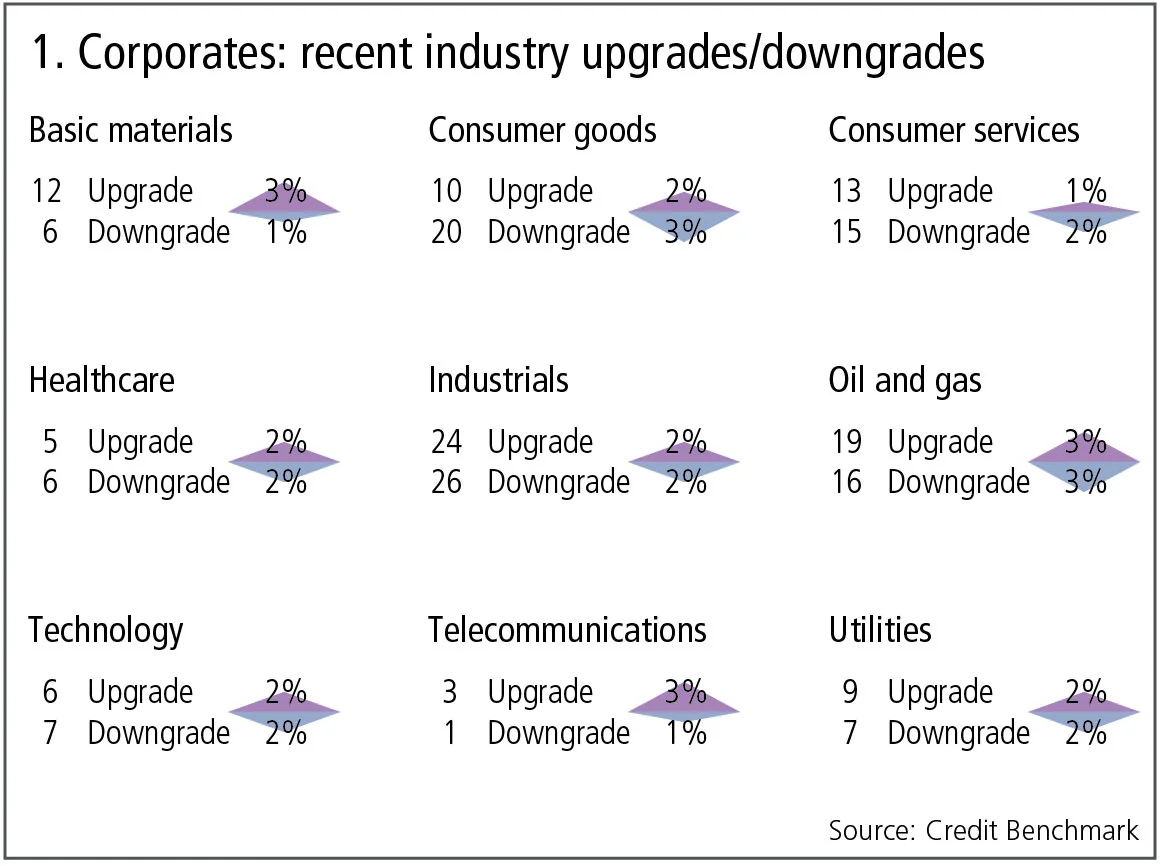
Figure 1 shows:
- Global corporate downgrades and upgrades are balanced, with 2% of global corporate obligors deteriorating and the same proportion improving.
- There are four industries where upgrades outnumber downgrades and five industries where downgrades dominate. The imbalance between upgrades and downgrades has generally reduced.
- Basic materials and utilities continue to show a bias towards upgrades, repeating the pattern of the past two months.
- In healthcare, downgrades have dominated upgrades for four consecutive months, but the imbalance has significantly reduced. The balance in telecommunications has moved in favour of upgrades after four months when downgrades predominated.
- Consumer services, industrials and technology are broadly balanced.
- Consumer goods have reverted back to the recent pattern of downgrades outnumbering upgrades.
- Oil and gas shows an imbalance in favour of upgrades.
Credit risk after the EU referendum
There is considerable debate about the impact of the EU referendum vote on the UK economy, both now and in the future. The Bank of England has publicly acknowledged there has been less of an immediate impact on growth than initially expected, while the currency has recovered most of its losses. In the interim, currency weakness has boosted inflation, but has also been good for the export sector. With rising interest rates, private finance initiative problems and ongoing negotiations with the EU, the future remains uncertain, but the credit trends are encouraging. After some extended declines, a number of UK industries are showing improvements in the bank-sourced credit view. Figure 2 shows the most recent three-month changes by industry and the longer-term trend for the basic materials industry.

Figure 2 shows:
- Industries such as consumer goods, utilities and telecommunications all show significant reductions in credit risk over the most recent three months. Increases in oil and gas, and technology are minimal.
- The basic materials industry shows a recent increase in credit risk. But, over the past 15 months, the various baskets used to track the UK basic materials industry have moved from non-investment grade to investment grade.
- The basket levels have converged in recent months. This is unusual – it is more typical for banks to extend credit to lower-quality obligors when overall credit improves. This may suggest banks are being particularly cautious in their lending policies in this industry, but it could also mean the credit risk estimates for all industry borrowers are increasingly similar.
- Although there are several months where consensus upgrades and downgrades have been in balance, the overall picture favours upgrades, with a particularly dramatic spike in June 2017.
Transatlantic comparisons
Global stock markets had a strong January, appearing to confirm the popular view of a global, synchronised economic boom. However, synchronisation can work in either direction. The financial sector is large and diverse, and regulatory changes are being framed and implemented in differing ways across different regions. But there are some common factors: the phased removal of quantitative easing has already led to some interest rate increases, which are largely beneficial for the sector; and global growth is leading an expansion in what are now well-capitalised bank balance sheets. Healthcare, meanwhile, faces a funding crisis in several geographies and the pharmaceutical sector is suffering from a lack of new blockbuster drugs, clouding its growth outlook and leading to an equity de-rating. These contrasting fortunes are reflected in the credit data.
Figure 3 shows the contrasting credit trends for these two large industry groups in Europe and North America.

Figure 3 shows:
- Credit risk in financials has been improving steadily, particularly in North America. Europe has traditionally been a better credit risk, but North America is closing the gap.
- Healthcare in Europe has shown a steady credit deterioration, but North America is now heading in the same direction.
- As with financials, North American healthcare has closed the historic gap with Europe and has now crossed over; it is viewed as a slightly better credit risk. If these trends continue, healthcare could slip below investment grade.
Transatlantic industry credit rankings
Some industries, such as oil and gas, are traditionally viewed as ‘global’, especially in respect of their equity price correlations. Credit profiles tend to be more geographically specific. In this section, we look at the relative credit rankings of the main industries in Europe and North America.

Figure 4 shows:
- North American industries show significantly greater dispersal in credit risk than those of Europe.
- In both regions, utilities and financials have the highest credit quality.
- In both regions, healthcare and consumer goods are currently almost identical, but note the time-series changes in healthcare in the previous section.
- Oil and gas occupies a similar rank in both regions, at or close to the lowest ranking, but North American oil and gas shows lower credit quality.
- The rank order is not identical across the regions, but the rank differences are not material – industrials is the only industry to show a significantly different rank.
Credit risk estimates: diversity by industry for US and UK
Bank-sourced credit data provides insight into the diversity of bank estimates. This is significant for a number of reasons: diversity supports a broad and liquid credit market due to competing views of the same borrower; diversity helps to control systemic risk – at the macro level, differences in opinion help to avoid concentration in specific industries or geographies; and differences in diversity by industry show where bank views are least clustered, suggesting more uncertainty on the credit outlook.
Figure 5 shows the interquartile range for each industry. Each bar represents a large number of individual borrowers and the metric used is the relative standard deviation. For example, if the average PD estimate for a borrower across 10 banks is 15 basis points and the standard deviation of those estimates is 10bp, then the relative standard deviation is 10/15 = 0.66.

Figure 5 shows:
- Credit views for UK utilities and UK telecommunications show tight ranges (close agreement between banks).
- US basic materials and UK industrials show the widest ranges.
- In the top chart, three industries in each region have been highlighted with a red outline: basic materials, oil and gas, and utilities. The right-hand chart shows each of these in detail, showing that in utilities and basic materials, the range of relative standard deviations is significantly wider for the US compared with the UK; in basic materials the median standard deviation is also higher in the US; and in oil and gas the median standard deviation is higher in the UK.
- These types of chart highlight where the banks are in agreement or highly divergent in their views. Large divergences are typical in lower-quality obligors, but if they are present in otherwise high-quality industries it may indicate an impending reduction in credit quality.
About this data
The Credit Benchmark dataset is based on internally modelled credit ratings from a pool of contributor banks. These are mapped into a standardised 21-bucket ratings scale, so downgrades and upgrades can be tracked on a monthly basis. Obligors are only included where ratings have been contributed by at least three different banks, yielding a total dataset of roughly 13,000 names, which is growing by 5% per month.
David Carruthers is the head of research at Credit Benchmark, a credit risk data provider.
コンテンツを印刷またはコピーできるのは、有料の購読契約を結んでいるユーザー、または法人購読契約の一員であるユーザーのみです。
これらのオプションやその他の購読特典を利用するには、info@risk.net にお問い合わせいただくか、こちらの購読オプションをご覧ください: http://subscriptions.risk.net/subscribe
現在、このコンテンツを印刷することはできません。詳しくはinfo@risk.netまでお問い合わせください。
現在、このコンテンツをコピーすることはできません。詳しくはinfo@risk.netまでお問い合わせください。
Copyright インフォプロ・デジタル・リミテッド.無断複写・転載を禁じます。
当社の利用規約、https://www.infopro-digital.com/terms-and-conditions/subscriptions/(ポイント2.4)に記載されているように、印刷は1部のみです。
追加の権利を購入したい場合は、info@risk.netまで電子メールでご連絡ください。
Copyright インフォプロ・デジタル・リミテッド.無断複写・転載を禁じます。
このコンテンツは、当社の記事ツールを使用して共有することができます。当社の利用規約、https://www.infopro-digital.com/terms-and-conditions/subscriptions/(第2.4項)に概説されているように、認定ユーザーは、個人的な使用のために資料のコピーを1部のみ作成することができます。また、2.5項の制限にも従わなければなりません。
追加権利の購入をご希望の場合は、info@risk.netまで電子メールでご連絡ください。
詳細はこちら コメント
What futures and options say about the cost of war
Spot prices reveal major disruption, futures indicate this will pass, options imply ongoing instability

担保に関して、TINAはTIAになることができるのか
あるエコノミストは、レポ取引やデリバティブ取引における担保としての米国債の優位性は、もはや揺るぎないものではないと指摘しています

Op risk data: HK gets tough on takeover in $200m takedown
Also: Bank staff steal state funds in India; Vanguard settles US net zero lawsuit. Data by ORX News

「エピサイクル」を超えて:モデルは市場に「適合」するだけでなく、市場を「説明」できなければならない
ジャン=フィリップ・ブショー氏は、モデリングにおいてボラティリティのパターンの複雑さを考慮に入れる必要があると述べています

FRTB内部モデル:クォ・ヴァディス(どこへ行く?)
2人のリスク専門家が、内部モデルの利用を促進するためにFRTBフレームワークをどのように調整すべきかについて考察しています

ポッドキャスト:ゴードン・リーが語る、若手クオンツが新人からMVPへ成長する方法
BNYの主任クオンタティブアナリストは、仕事の優先順位付けと境界線の設定がキャリアアップの鍵であると述べています。

イタリアのスプレッド問題は(常に)信用問題というわけではない
イタリアの通貨同盟における役割に対する時折の疑念が、政治リスクプレミアムを増すと、経済学者は主張しています。

市場は決して忘れない:平方根則の持続的な影響
ジャン=フィリップ・ブショー氏はトレードの流れは資産価格に大きく、かつ長期的な影響があると主張する。