Credit data: a sharp turning point in CCP credit risk
The credit risk of CCPs is worsening, even as margin requirements rise, writes David Carruthers

For anyone who shudders at the mere thought of a clearing house failure, the latest bank-sourced data from Credit Benchmark could make for uncomfortable reading.
After improving by more than 5% from November 2017 to September 2019, the credit risk of 30 central counterparties (CCPs) reversed sharply at the end of last year. The 2.6% deterioration seen in October and November was the worst in two years, and compares with a drop of less than 2% following the default of power trader Einar Aas at Nasdaq Clearing in September 2018.
The sudden shift in sentiment defies easy explanation. CCPs have made a concerted effort to improve their risk management since the Nasdaq default, resulting in higher margin requirements and deeper liquidity buffers.
Following changes to its value-at-risk model for client clearing, required initial margin at LCH’s SwapClear service hit ₤145.1 billion ($189.6 billion) at the end of the third quarter of 2019, up 46% from a year ago. At Eurex and CME, initial margin was up 25% and 18%, respectively, over the same period.
Meanwhile, as Risk.net reported in January, the Japan Securities Clearing Corporation (JSCC) is making changes to its futures margin model that will result in higher margin requirements for clients with riskier positions.
All of this should make CCPs safer from a credit risk perspective. The data tells a different story.
That is not to say a default is on the cards. The credit risk of CCPs is notoriously hard to measure and often overstated. Still, the sudden deterioration in credit risk could be costly for banks that apply a credit valuation adjustment (CVA) charge to reflect the counterparty risk of centrally cleared trades.
This month, we also look at the credit risk of European Union banks and the healthcare and global technology industries.
Global credit industry trends
The latest consensus credit data shows credit activity for corporates and financials has slightly increased, with 4.6% of entities moving by at least one notch, compared with 4.3% last month. Figure 1 shows detailed industry migration trends for the most recent published data, adjusted for changes in contributor mix.
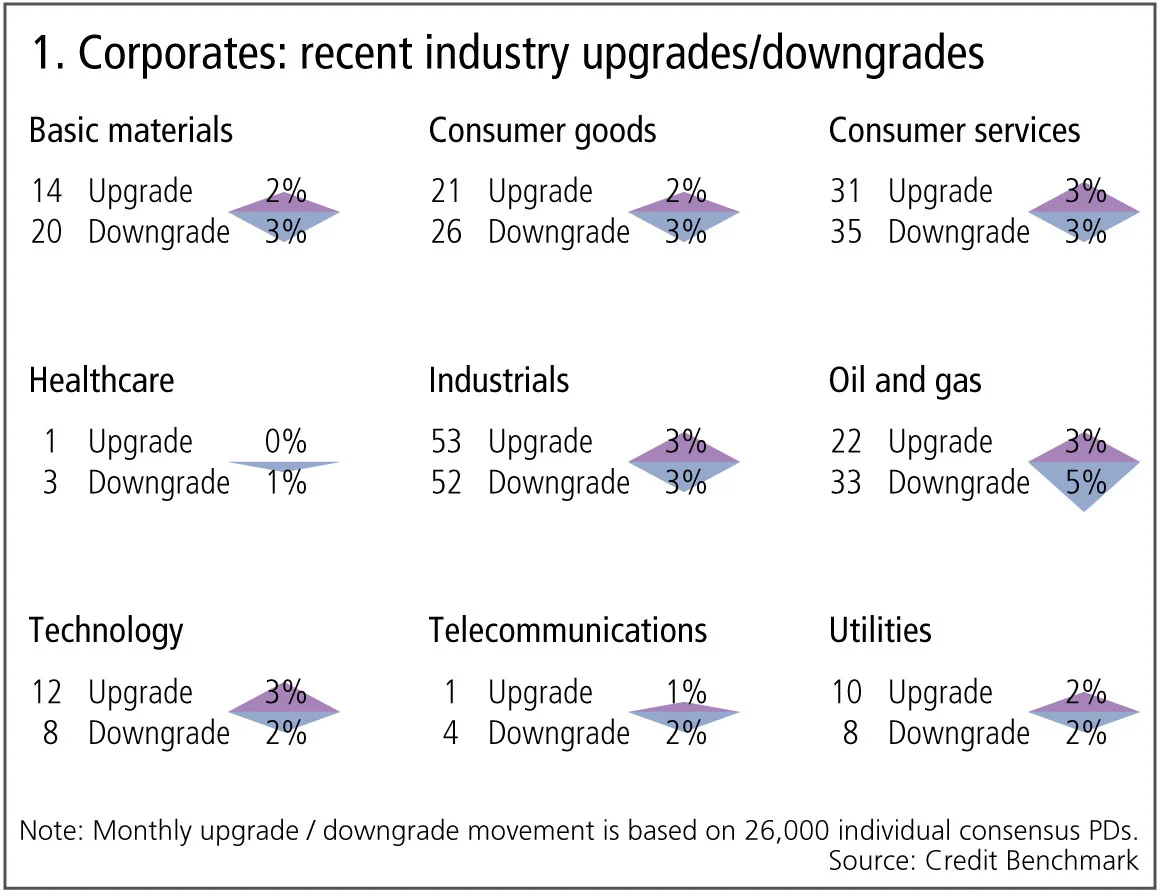
Figure 1 shows:
- Globally, corporate downgrades and upgrades are in balance.
- Upgrades outnumber downgrades in one of the nine industries, five industries are biased towards downgrades and three are in balance.
- Technology has more upgrades than downgrades, after four months of the opposite.
- Oil and gas and telecommunications see downgrades dominating for a third month.
- Basic materials and consumer goods return to downgrades outweighing upgrades after a period of balance.
- Healthcare shows volatility with downgrades now outnumbering upgrades.
- Consumer services are in balance for the third month.
- Industrials remain in balance for the second month.
- Utilities return to balance after two months of upgrades dominating.
Central counterparty clearing firms
There are currently more than 70 central counterparty (CCP) firms, ranging from global industry giant DTCC to specialised regional CCPs focused on specific sectors and derivatives types. The growing dominance of CCPs is a direct response to the systemic risks of derivatives trading that became apparent in 2008. Concerns that CCPs themselves are also a source of systemic risk come and go. A number of recent studies have attempted to map the shifting web of systemic connections between CCPs, seeking to answer the question “How sensitive is the CCP network to an individual CCP or CCP member failure?”.
Figure 2 shows the credit trend and distribution of 30 CCPs.
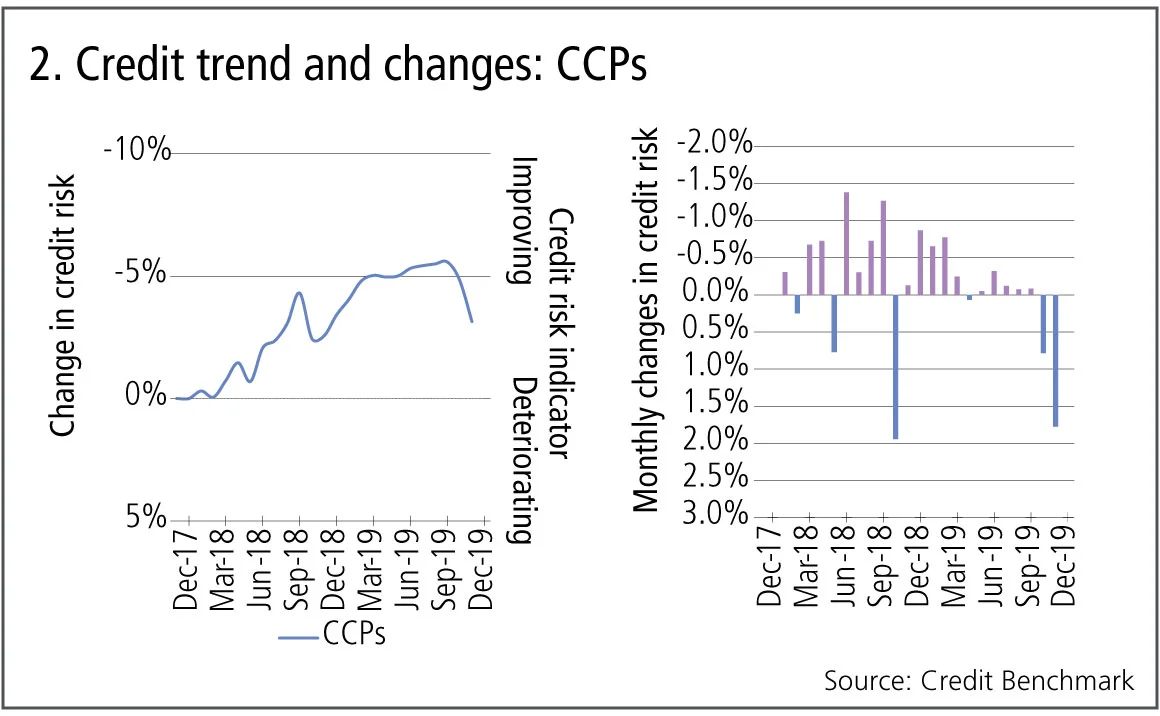
Figure 2 shows:
- Credit risk of CCPs improved by more than 5% from November 2017 to September 2019.
- In the past two months there has been a sharp turning point, with credit risk deteriorating by 2.6%.
- The right-hand chart shows these monthly changes, with positive momentum slowing from mid-2018. Since then, the size of improvements has gradually decreased, and the latest two months show large consecutive deteriorations.
EU banks
Most EU banks improved their capital ratios in 2019 but loan growth has been weak, reflecting the sluggish economy. EU bank shares also underperformed their US counterparts. Brexit is likely to create banking winners and losers across the EU, and this has been reflected in very mixed share price performances from UK and continental European bank shares.
Figure 3 shows the credit trends and distributions of 470 EU ex-UK and 140 UK banks.
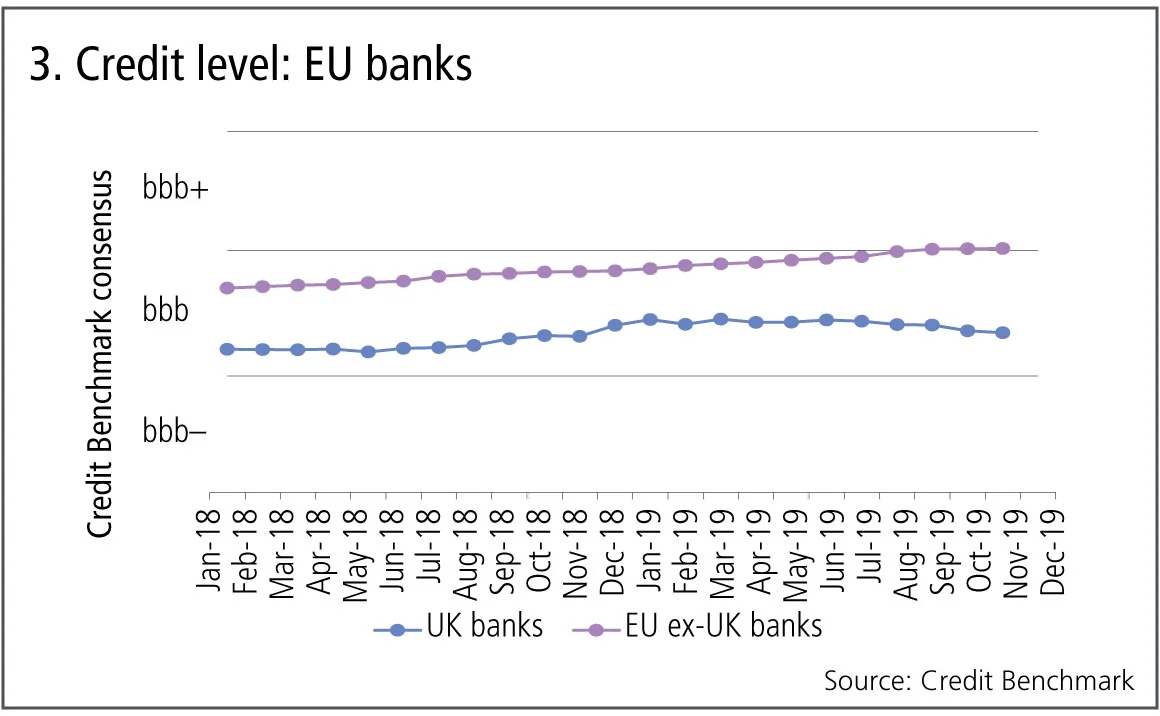
Figure 3 shows:
- EU ex-UK bank credit risk has been steadily improving since early 2018, but has stabilised in the past few months.
- The EU ex-UK bank average credit moved from bbb to bbb+ in September 2019.
- UK banks began to improve from May 2018, moving into the centre of the bbb category by the end of 2018.
- UK banks have given up some of these gains, deteriorating since January 2019.
US v UK healthcare
The US healthcare industry has a number of positive drivers: increasing longevity, the development of virtual care, a steadily rising population. But the drive for pricing transparency and increased competition will mitigate some of these. In the UK, the steady growth of private health spending has mitigated some of the impact on the healthcare industry of the relentless NHS focus on value.
Figure 4 shows the credit trend and distribution of 310 US and 160 UK healthcare companies.
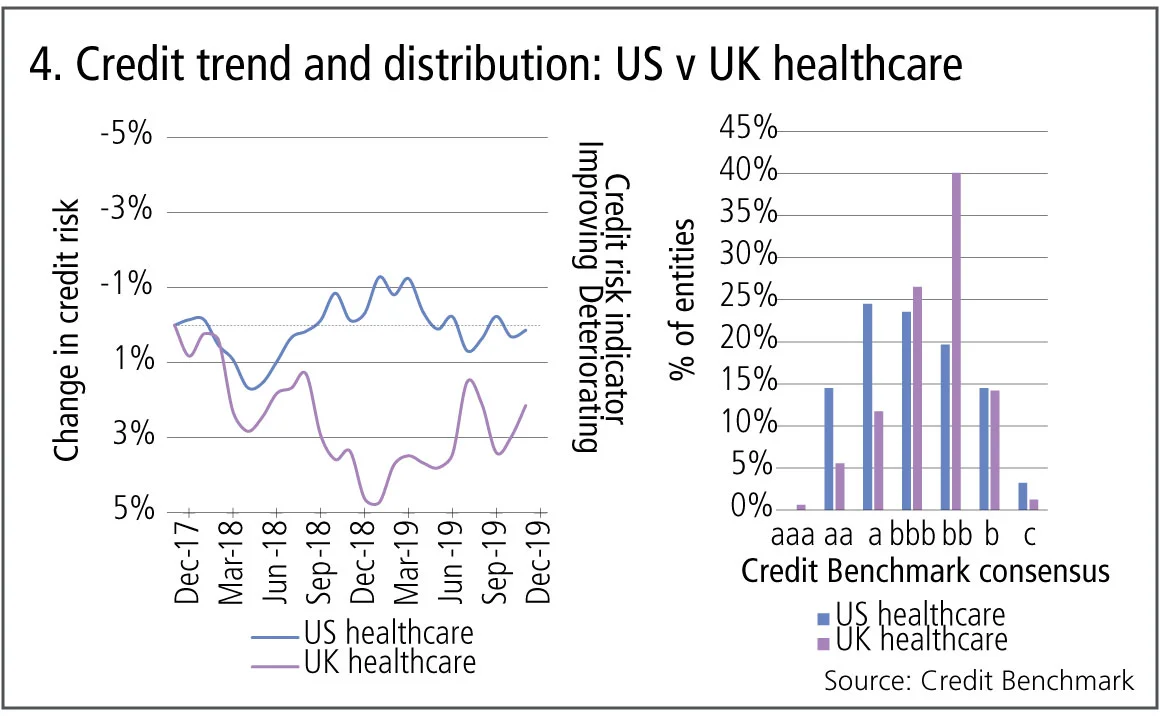
Figure 4 shows:
- Both US and UK healthcare show choppy credit risk trends within the last two years.
- UK healthcare had an overall deterioration throughout 2018, but saw recovery in 2019. US healthcare also saw an improvement in the second half of 2018, although this turned towards slight deterioration in the first half of 2019.
- The latest data shows an improvement in UK healthcare, while US healthcare is stable.
- Nearly two-thirds of US healthcare firms are investment grade, in comparison with 45% of UK firms; 40% of UK healthcare firms have a Credit Benchmark consensus of bb.
Global technology
Big tech has been an easy target for politicians in recent years, with criticisms based on anti-trust, tax avoidance and data abuse. The demand for new technology is exponentially growing, but individual businesses can quickly fall from grace if they make the wrong product decision or run into production delays. There is an increasing shift towards software as the main source of value add.
Figure 5 shows the credit trends and distributions for 615 global software and computer services companies and 250 global technology hardware and equipment companies.
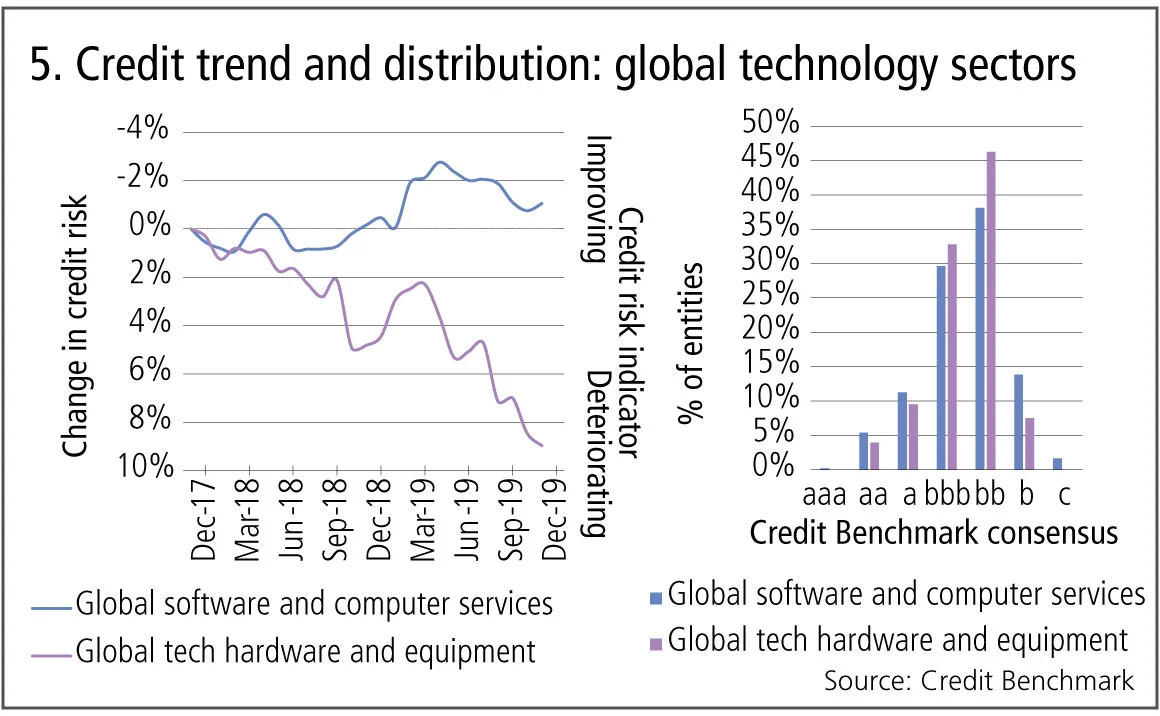
Figure 5 shows:
- Overall, global software and computer services companies show a slight credit improvement (1%) since November 2017. On the other hand, global technology hardware and equipment companies firms have seen a deterioration of nearly 10%.
- The two sectors have similar distributions; each has the same proportion (46%) of entities in investment grade. However, the distribution of software and computer services has a slightly greater spread.
About this data
Credit Benchmark collects monthly credit risk inputs from 40-plus of the world’s leading financial institutions, making it possible to follow credit trends across geographies and industries. In all, the dataset contains consensus ratings on about 50,000 rated and unrated entities globally.
David Carruthers is head of research at Credit Benchmark.
コンテンツを印刷またはコピーできるのは、有料の購読契約を結んでいるユーザー、または法人購読契約の一員であるユーザーのみです。
これらのオプションやその他の購読特典を利用するには、info@risk.net にお問い合わせいただくか、こちらの購読オプションをご覧ください: http://subscriptions.risk.net/subscribe
現在、このコンテンツを印刷することはできません。詳しくはinfo@risk.netまでお問い合わせください。
現在、このコンテンツをコピーすることはできません。詳しくはinfo@risk.netまでお問い合わせください。
Copyright インフォプロ・デジタル・リミテッド.無断複写・転載を禁じます。
当社の利用規約、https://www.infopro-digital.com/terms-and-conditions/subscriptions/(ポイント2.4)に記載されているように、印刷は1部のみです。
追加の権利を購入したい場合は、info@risk.netまで電子メールでご連絡ください。
Copyright インフォプロ・デジタル・リミテッド.無断複写・転載を禁じます。
このコンテンツは、当社の記事ツールを使用して共有することができます。当社の利用規約、https://www.infopro-digital.com/terms-and-conditions/subscriptions/(第2.4項)に概説されているように、認定ユーザーは、個人的な使用のために資料のコピーを1部のみ作成することができます。また、2.5項の制限にも従わなければなりません。
追加権利の購入をご希望の場合は、info@risk.netまで電子メールでご連絡ください。
詳細はこちら コメント
オペリスクデータ:サイバー攻撃が暗号資産プロトコルを揺るがす
他にも:JPモルガンが投資家の損失をめぐり罰金処分を受けた、Symetraのメソジスト系年金基金をめぐる混乱など。データ提供:ORX News

予測市場は、炭鉱のカナリアのような役割を果たすことがある
リスクの専門家によると、Polymarketなどのプラットフォームにおける契約価格は、リスク管理やヘッジの指標となり得るとのことです

AIエージェントがリスク管理者の課題解決にどう役立つ
シティのリスク専門家は、取引や融資承認に関する構造化データと非構造化データを統合し、リスクに関する単一かつ統一されたビューを構築する自律型AIツールについて概説しました

オペリスク・データ:企業スパイがBBVAに脅威をもたらす
他にも:BofAがエプスタイン氏との関与疑惑で追及されています。また、少数株主がブルックフィールドに異議を唱えています。データ提供:ORX News

AI政治の台頭
MASの顧問であるデビッド・ハードーン氏は、AIを単なる一つの技術として扱うべきではないと述べています

AIリスク管理と能力制御への移行
リスク管理者によると、検証の枠組みを見直すことで、銀行はイノベーションと規制上の要件を両立させ、強固なリスク管理体制を維持することができます

トークン化された商品市場は、経済の円滑な運営に寄与する可能性がある
暗号資産の専門家は、実物資産をブロックチェーンに移行することで、担保に関する摩擦が緩和されると主張しています

GenAIの時代において、未だに優れたモデルが必要なのはなぜなのか?
ジャン=フィリップ・ブショー氏は、モデルが人工知能をレジームシフトの過程で導き、過学習から遠ざけることができると述べています