Credit data: how US industries have fared under Trump
At the halfway point in the administration, time for a credit check, writes David Carruthers

In the recent US mid-term elections, both parties claimed enough of the spoils to declare victory – the Democrats regaining control of the House of Representatives, the Republicans tightening their grip on the Senate. But at the halfway point in a deeply divisive administration – one that saw many sectors benefit from a huge fiscal stimulus last year, and others do less well under the gradual return towards monetary orthodoxy – it’s worth running the rule over the credit data for key sectors, and seeing how each has performed under Trump.
The oil and gas sector has certainly done well during the current administration, largely thanks to the recovery in global oil prices. Fully a quarter of borrowers from our panel of contributor banks have seen their probabilities of default fall during the period – a sign the industry has recovered from its 2015 nadir, despite a recent rise in volatility.
Basic materials, utilities and financials have all done well by the same metric. Others – consumer goods, services and telecoms have seen a slight worsening of credit quality, however – perhaps owing something to the modest monetary tightening that has followed fiscal laxity this year.
Whether a further promised round of cuts mooted ahead of the election ever materialises – and whether the spoils are shared more equally this time – remains to be seen.
At a global level, this month’s data, from 28 contributor banks, shows upgrade and downgrade activity has slowed, with only 26 companies moving more than one notch – half as many as last month. Figure 1 shows detailed industry migration trends for the most recent published data, based on data adjusted for changes in contributor mix.
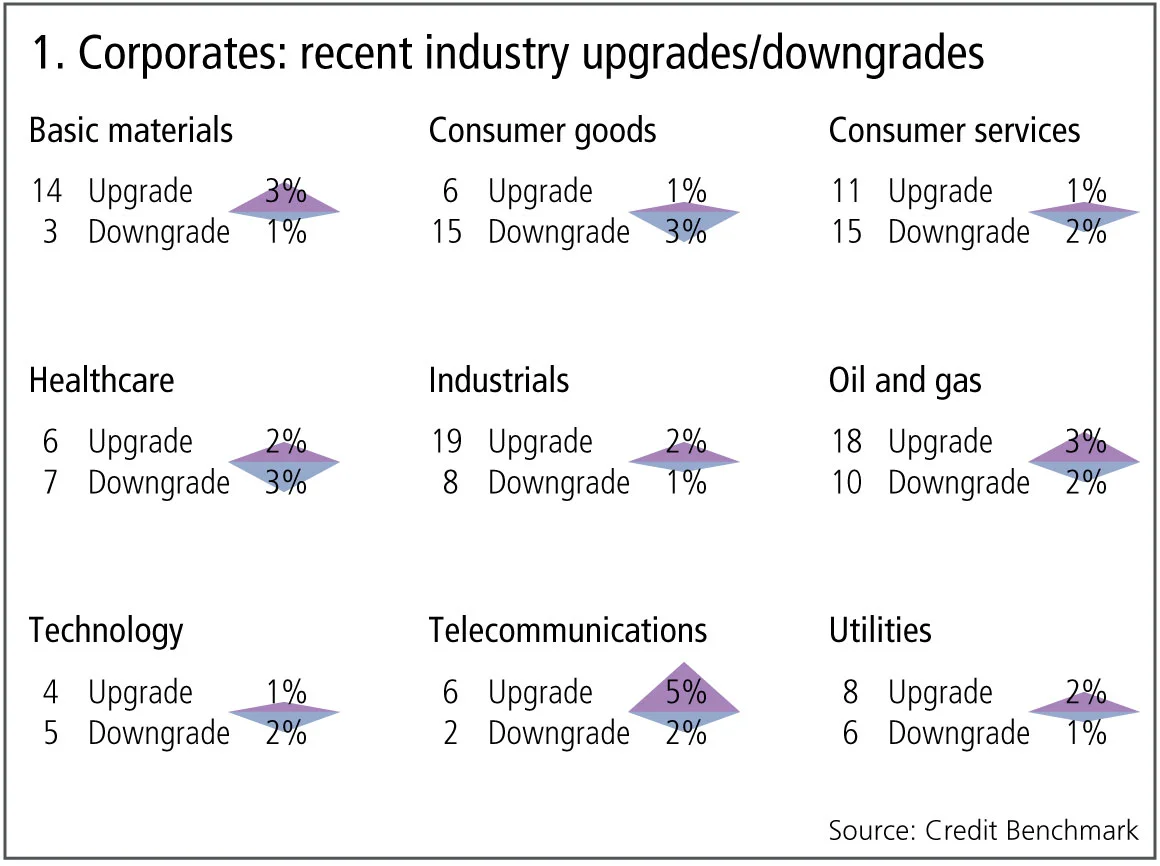
Figure 1 shows:
- Across global corporates, the number of upgrades and downgrades are in balance.
- Upgrades dominate downgrades in five of the nine industries and four industries are biased towards downgrades.
- Basic materials, oil and gas and telecommunications continue their trend of the past few months, with upgrades outweighing downgrades.
- Industrials and utilities return to upgrades favouring downgrades after a period of balance.
- Healthcare continues its trend of downgrades outweighing upgrades for the second month.
- Consumer services has seen a change to downgrades outnumbering upgrades after two months of balance.
- Consumer goods continues its trend of downgrades outweighing upgrades for the third month.
- Technology continues to be volatile with a change now in favour of downgrades.
US industries
The chart shows credit changes for US industries during the current Republican administration.
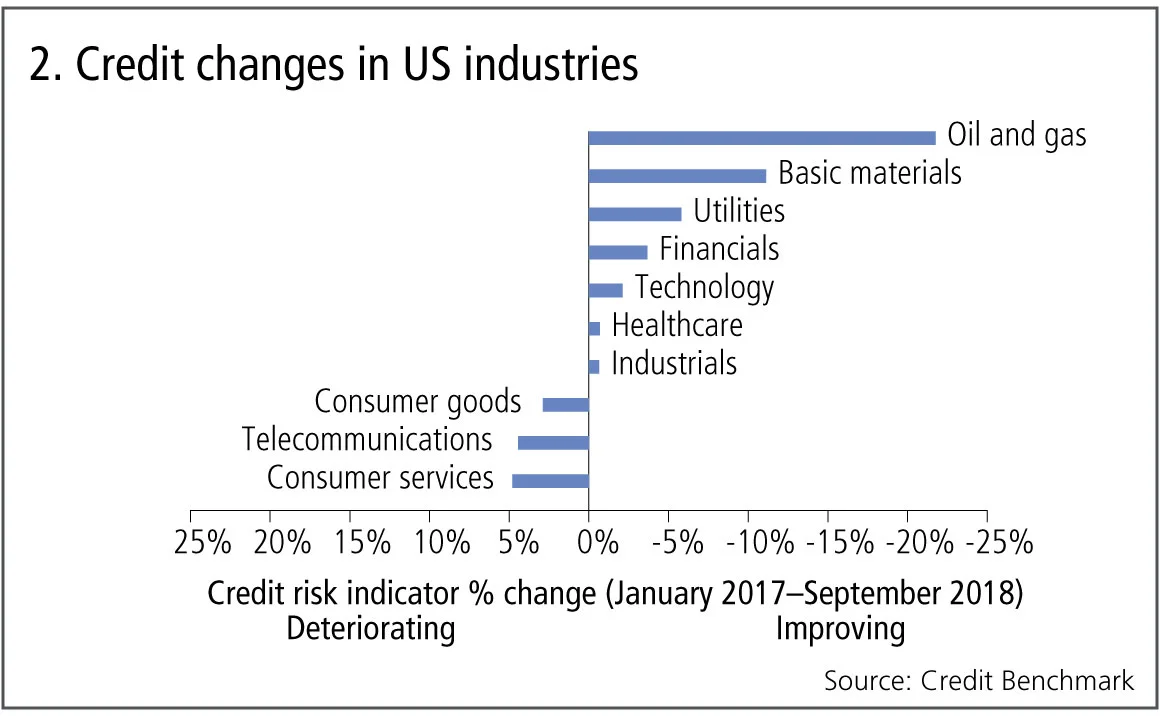
Figure 2 shows:
- Seven of the 10 industries show a credit improvement over the period.
- Oil and gas shows a 25% improvement since January 2017, mainly driven by the global oil price recovery. The recent ramp-up in US shale production has weakened the oil price again, but Saudi plans to cut production suggest the sector will remain volatile for some time.
- Consumer industries show a modest deterioration, highlighting the recent fiscal focus on corporate tax cuts.
Japanese corporates
The Japanese economy has had another difficult year, with Q3 GDP hit by typhoons in the west and a magnitude seven earthquake in the north. Partly in response, the prime minister Shinzō Abe has called for a fresh public works spending programme, despite Japan’s notoriously high, but domestically held, public debt – the result of nearly three decades of periodic fiscal stimulus.
Years of below-average growth have weighed heavily on the corporate sector, so yet another fiscal stimulus would be a welcome shot in the arm; especially since Bank of Japan governor Haruhiko Kuroda has hinted that the longstanding monetary stimulus may be coming to an end. The chart shows the credit distribution and recent trends for Japanese corporates.
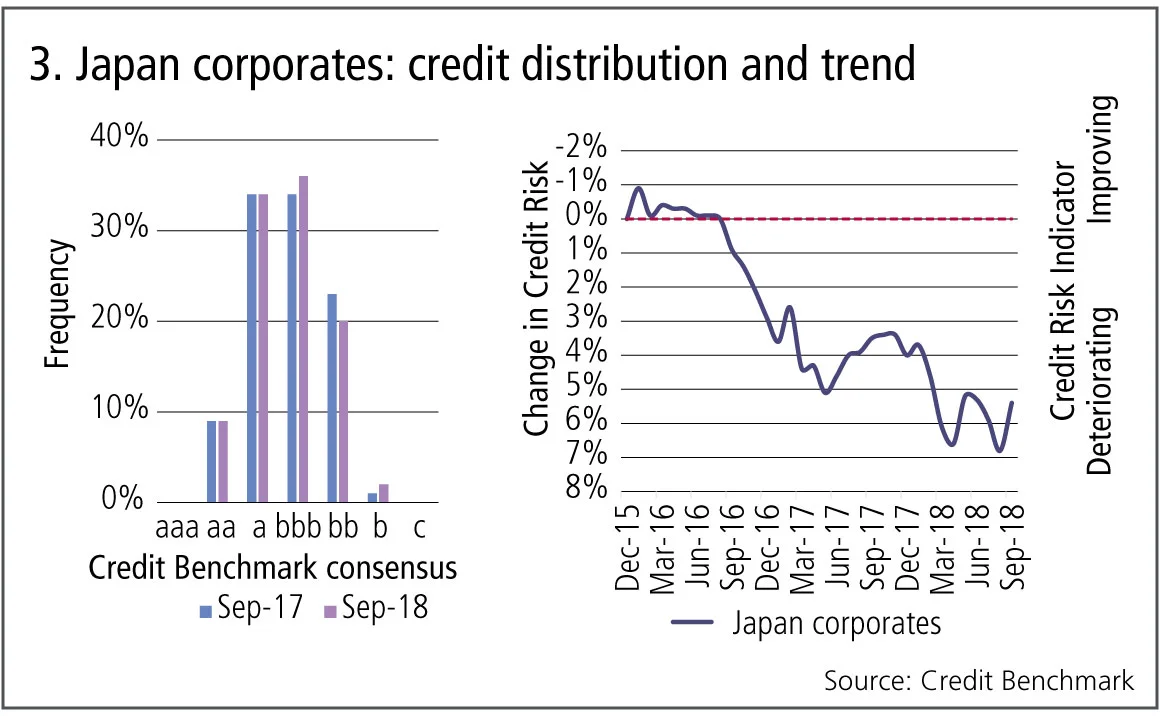
Figure 3 shows:
- The majority – more than 75% – of Japanese corporates are -investment grade.
- Most of the non-investment grade corporates are in the bb category, and this proportion has dropped slightly over the past year, in favour of bbb.
- Corporate credit shows a modest (6%) deterioration over the past two years, and has been stable over the past few months.
UK housing associations
UK housing associations are a highly illiquid but important ‘non-traditional asset’ for UK insurance companies in the context of UK Solvency II implementation. Many of them do not have conventional credit ratings. Figure 4 shows the credit distribution for 44 of the main UK housing associations as well as rating trends for an expanded sample of 240 legal entities that includes a long list of smaller associations.
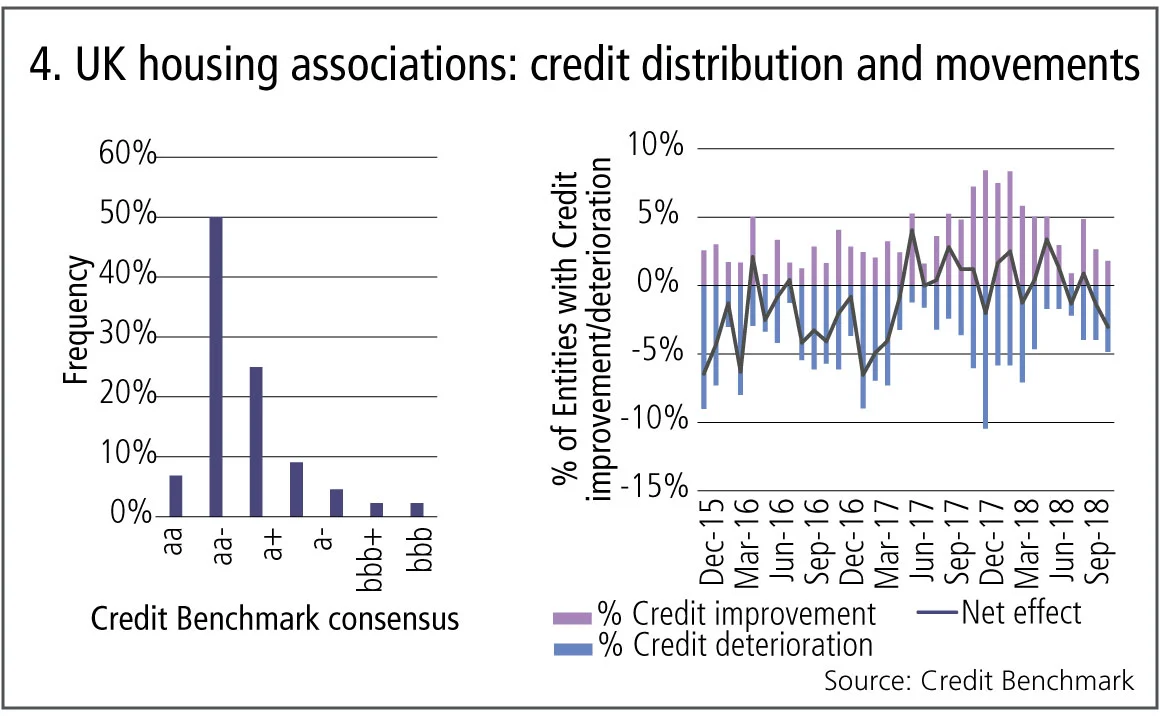
Figure 4 shows:
- More than 55% of the larger UK housing associations are in the aa or aa- category, with less than 5% in the bbb+ or bbb categories.
- All 44 of the main UK housing associations are investment grade, and even the lowest are two notches above the investment-grade -threshold.
- In the expanded sample, there were a large number of downgrades in 2016 and the first half of 2017, but the balance shifted to credit improvements towards the end of 2017.
- The net upgrade/downgrade balance has recently turned negative again.
PD curves
The CECL and IFRS 9 accounting standards require ‘PD curves’ – probability of default estimates for multiple time horizons. There are a number of competing methodologies for deriving these, but a robust approach uses stable credit transition matrices (CTMs) to create projections under a variety of credit scenarios. Bank-sourced data provides a particularly large cross-sectional dataset for CTM calibration and the generation of ‘real-world’ PD curves.
Figure 5 shows cumulative default probability curves derived from relevant CTMs for US oil and gas and US healthcare. These have been initialised with a set of default rate assumptions for each credit category inferred from bank-sourced data. The resulting cumulative PDs are shown on a log scale, with the credit categories plotted alongside. This effectively shows the cumulative real-world default risks for a static cohort of borrowers over a five-year time horizon. A set of point-in-time curves can then be constructed by the addition of risk premiums.
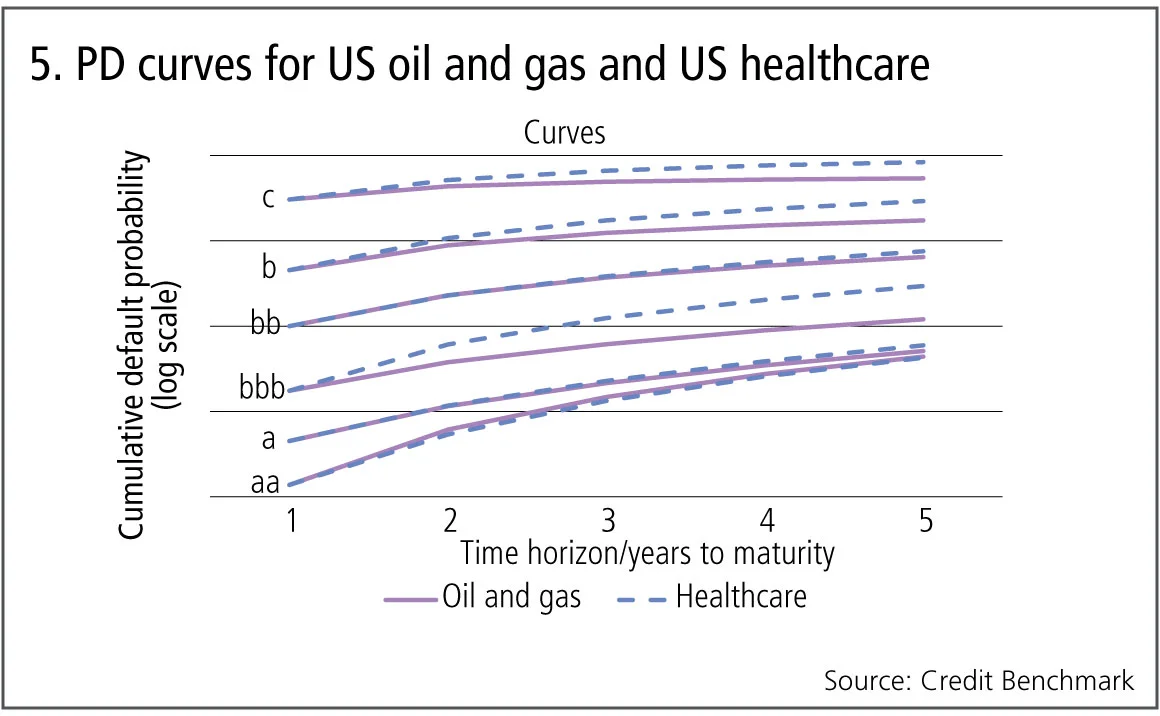
Figure 5 shows:
- The curves for aa and a categories show convergence for both industries as the maturity increases – in other words, if recent transition patterns persist, then exposures to these two credit categories have a similar impact on the credit portfolio over time.
- The non-investment grade asset credit categories do not show this convergence, suggesting credit portfolio distributions in these classes are more critical to their future behaviour.
- Some of the US healthcare curves are noticeably steeper than their oil and gas equivalents. In particular, the bbb healthcare curve shows a significant increase in cumulative default risk especially for the three- to five-year horizon.
- These curves also highlight the importance of geographic- and industry-specific CTMs.
About this data
The Credit Benchmark dataset is based on internally modelled credit ratings from a pool of contributor banks. These are mapped into a standardised 21-bucket ratings scale, so downgrades and upgrades can be tracked on a monthly basis. Obligors are only included where ratings have been contributed by at least three different banks, yielding a total dataset of more than 22,500 names.
David Carruthers is head of research at Credit Benchmark.
Editing by Tom Osborn
コンテンツを印刷またはコピーできるのは、有料の購読契約を結んでいるユーザー、または法人購読契約の一員であるユーザーのみです。
これらのオプションやその他の購読特典を利用するには、info@risk.net にお問い合わせいただくか、こちらの購読オプションをご覧ください: http://subscriptions.risk.net/subscribe
現在、このコンテンツを印刷することはできません。詳しくはinfo@risk.netまでお問い合わせください。
現在、このコンテンツをコピーすることはできません。詳しくはinfo@risk.netまでお問い合わせください。
Copyright インフォプロ・デジタル・リミテッド.無断複写・転載を禁じます。
当社の利用規約、https://www.infopro-digital.com/terms-and-conditions/subscriptions/(ポイント2.4)に記載されているように、印刷は1部のみです。
追加の権利を購入したい場合は、info@risk.netまで電子メールでご連絡ください。
Copyright インフォプロ・デジタル・リミテッド.無断複写・転載を禁じます。
このコンテンツは、当社の記事ツールを使用して共有することができます。当社の利用規約、https://www.infopro-digital.com/terms-and-conditions/subscriptions/(第2.4項)に概説されているように、認定ユーザーは、個人的な使用のために資料のコピーを1部のみ作成することができます。また、2.5項の制限にも従わなければなりません。
追加権利の購入をご希望の場合は、info@risk.netまで電子メールでご連絡ください。
詳細はこちら コメント
オペリスクデータ:サイバー攻撃が暗号資産プロトコルを揺るがす
他にも:JPモルガンが投資家の損失をめぐり罰金処分を受けた、Symetraのメソジスト系年金基金をめぐる混乱など。データ提供:ORX News

予測市場は、炭鉱のカナリアのような役割を果たすことがある
リスクの専門家によると、Polymarketなどのプラットフォームにおける契約価格は、リスク管理やヘッジの指標となり得るとのことです

AIエージェントがリスク管理者の課題解決にどう役立つ
シティのリスク専門家は、取引や融資承認に関する構造化データと非構造化データを統合し、リスクに関する単一かつ統一されたビューを構築する自律型AIツールについて概説しました

オペリスク・データ:企業スパイがBBVAに脅威をもたらす
他にも:BofAがエプスタイン氏との関与疑惑で追及されています。また、少数株主がブルックフィールドに異議を唱えています。データ提供:ORX News

AI政治の台頭
MASの顧問であるデビッド・ハードーン氏は、AIを単なる一つの技術として扱うべきではないと述べています

AIリスク管理と能力制御への移行
リスク管理者によると、検証の枠組みを見直すことで、銀行はイノベーションと規制上の要件を両立させ、強固なリスク管理体制を維持することができます

トークン化された商品市場は、経済の円滑な運営に寄与する可能性がある
暗号資産の専門家は、実物資産をブロックチェーンに移行することで、担保に関する摩擦が緩和されると主張しています

GenAIの時代において、未だに優れたモデルが必要なのはなぜなのか?
ジャン=フィリップ・ブショー氏は、モデルが人工知能をレジームシフトの過程で導き、過学習から遠ざけることができると述べています