Credit data: the Trump effect on PDs
The war on coal is over, according to the US president – and the effect can be seen in banks' default estimates


“Trump digs coal”, according to placards that are often seen at the US president’s rallies, and his year-old administration has taken a series of steps to protect the industry. In his speeches, he has promised an end to the “war on coal”, that mining jobs will be created, that the shrinking industry will return to growth.
One thing he has conspicuously not promised is an improvement in bank estimates of the one-year probability of default (PD) for coal companies – it’s not much of a rallying cry, perhaps, but there has been an improvement. For one set of 20 borrowers, the improvement in default expectations translates into a one-notch ratings upgrade, taking them from an average of b to b+ during a five-month period beginning in February 2017.
As the sector’s credit has strengthened, data suggests banks have become more comfortable lending to riskier names, presumably reflecting an expectation that the Trump policy tailwind will continue to help the sector.
Similar trends can be seen in the defence sector – an industry that is benefiting both from Trump policy and growing threats to regional and global security.
This month, we also look at the relationship between earnings surprises and credit quality for NYSE and Nasdaq-listed companies, and we compare bank-sourced credit data with credit default swap (CDS) prices.
Global credit industry trends
Figure 1 shows industry migration trends for the most recent published data.
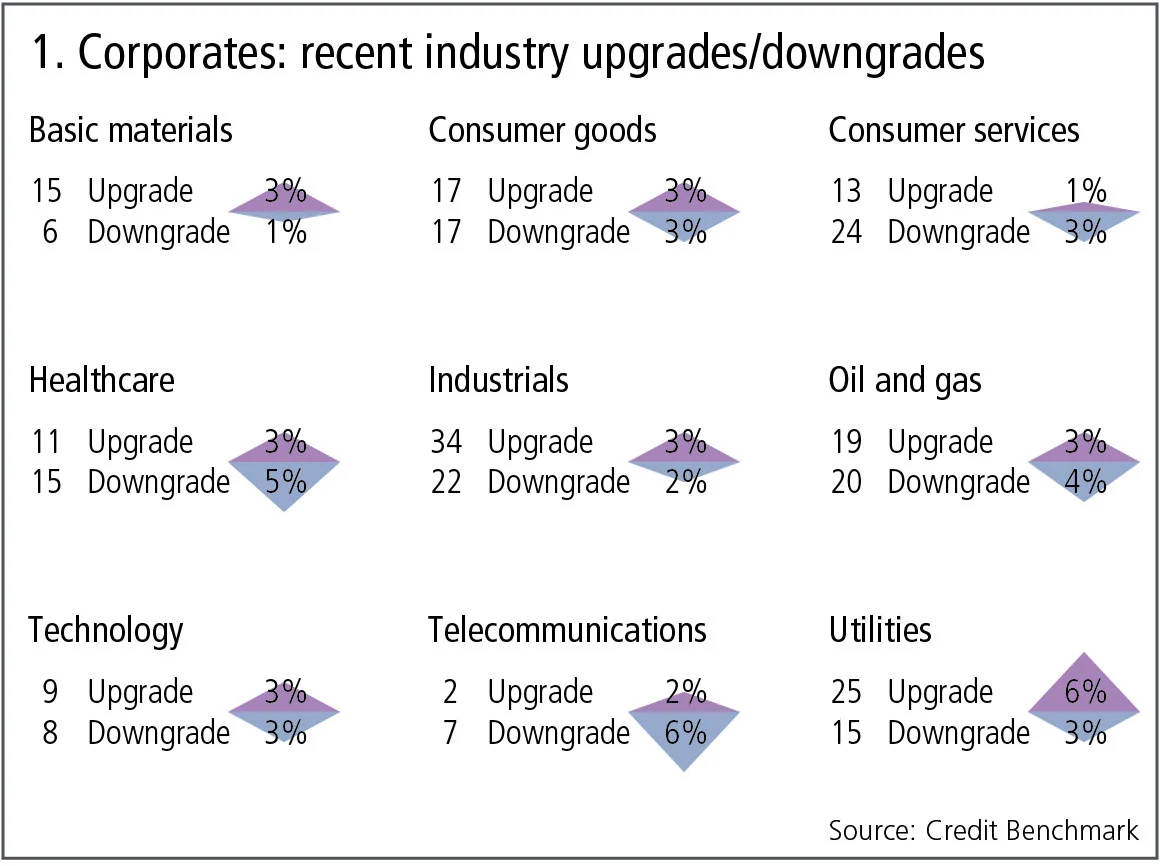
Figure 1 shows:
- Global corporate downgrades and upgrades are balanced, 3% of the global corporate obligors show a deterioration and 3% show an improvement.
- There are four industries where upgrades outnumber downgrades and four industries where downgrades dominate. Generally, the ratio of upgrades and downgrades has remained stable.
- The telecoms sector continues to show a strong imbalance in favour of downgrades, repeating the pattern of the past four months.
- In healthcare, downgrades have dominated upgrades for three consecutive months.
- Consumer services has reverted back to its pattern of downgrades significantly outnumbering upgrades.
- Basic materials and utilities show a continuing bias towards upgrades.
- Consumer goods, oil and gas, and technology remain balanced.
- The balance in industrials has moved in favour of upgrades.
US equity earnings surprises
The connections between equity and credit markets are often overlooked. Equity analysis typically focuses on value and growth metrics, with credit risk only becoming an issue when a company has run into severe problems, usually related to liquidity and the balance sheet. However, a comparison of recent earnings surprises in the main US markets for the past few months shows some interesting patterns across the credit spectrum. The distribution of the earnings surprises is shown relative to the credit distribution of the underlying index.
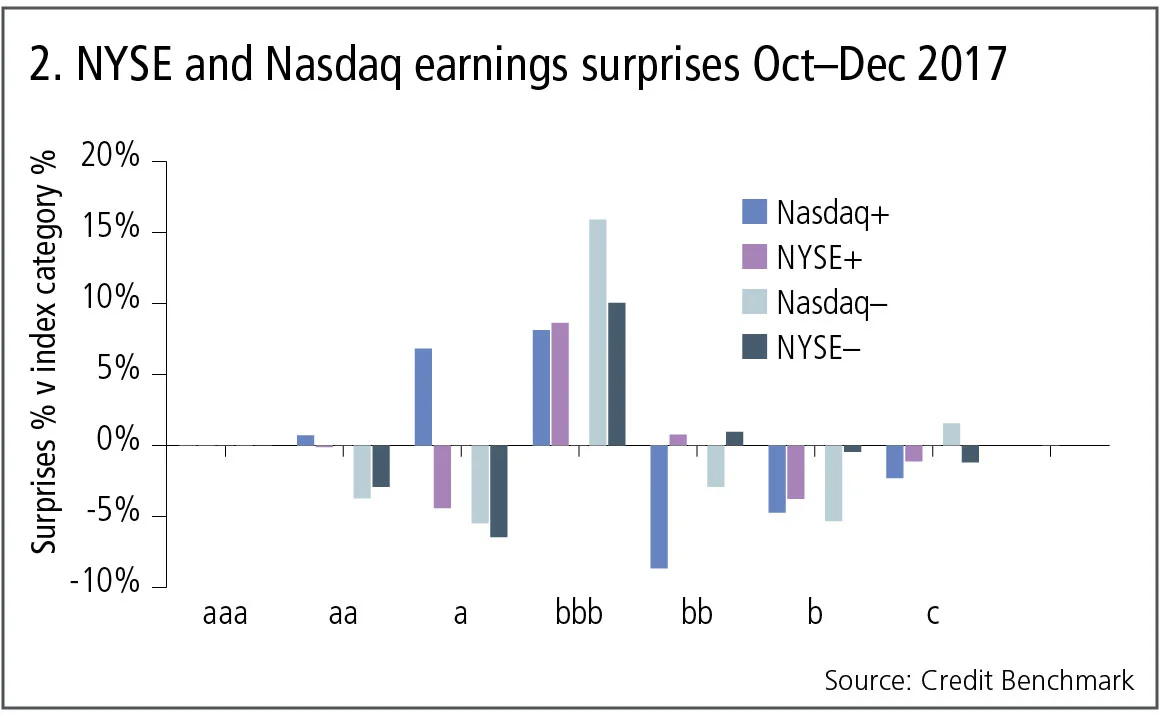
Figure 2 shows:
- For the NYSE, positive surprises are overrepresented in the bbb category, and slightly underrepresented in the a and b categories. The pattern is similar for negative surprises, which are also overrepresented in the bbb category and underrepresented in the a category.
- For Nasdaq, the same pattern prevails for bbb, with positive and negative surprises overrepresented. However, positive surprises are overrepresented in the a category and underrepresented in the bb and b categories. Negative surprises are underrepresented in the aa, a and b categories.
- Although these differences are relative, the underlying distribution will still have some influence – the large bbb category for both indexes will usually mean that the arithmetic percentage difference will be somewhat larger for both positive and negative surprises. This is also consistent with the typical credit transition matrix, which shows a high level of two-way activity in the centre of the credit distribution: one implication of this coincidence is that earnings surprise could be a valuable additional early warning credit indicator.
Global coal sector
The Trump administration is strongly supportive of a revitalised coal sector, presiding over an increase in coal production and employment throughout the year. From a very low base, these improvements are reflected in credit data covering a universe of more than 20 coal companies – mainly US ones. However, the sector has a long way to go before it reaches investment grade and the economics of coal production are still very challenging.
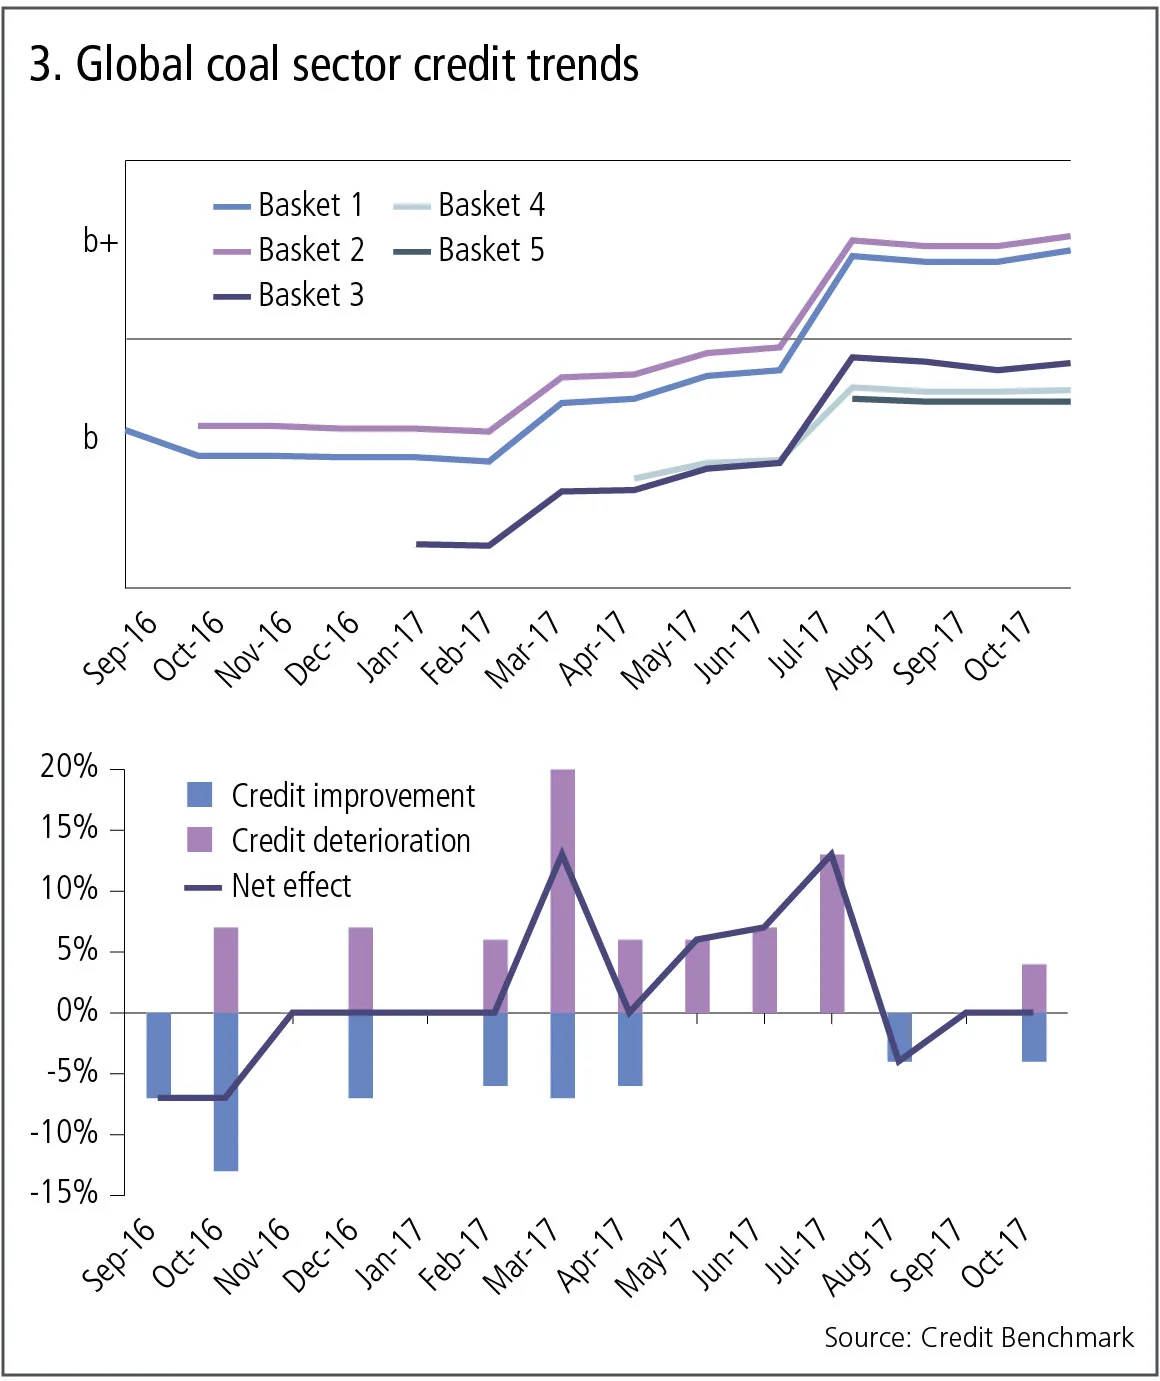
Figure 3 shows:
- Each line in the chart on the top represents the simple average credit risk of a basket of coal companies. There are about 20 obligors in each basket but the actual number varies over time depending on the pattern of bank business. Each line represents the “on-the-run” basket for a three-month period. The initial basket (1) shows a one-notch credit risk improvement from mid b to b+.
- The most recent basket (5) is in credit category b with a similar risk to the opening value of the first basket. This is a good example of a pattern that is often observed in bank-sourced credit data: as the overall credit risk improves, banks tend to take more risk with their choice of borrowers.
- The bottom chart shows the proportions of the basket universe with improving and deteriorating credit. This shows a moderate but clear swing towards improvements over the past year.
Global defence sector
Defence is another beneficiary of the Trump administration with the passing of the National Defense Authorization Act in mid-2017, coinciding with an increase in geopolitical risk. As with coal, the stronger outlook for the sector is reflected in the credit data, again covering a universe of more than 20, mainly US, defence companies.
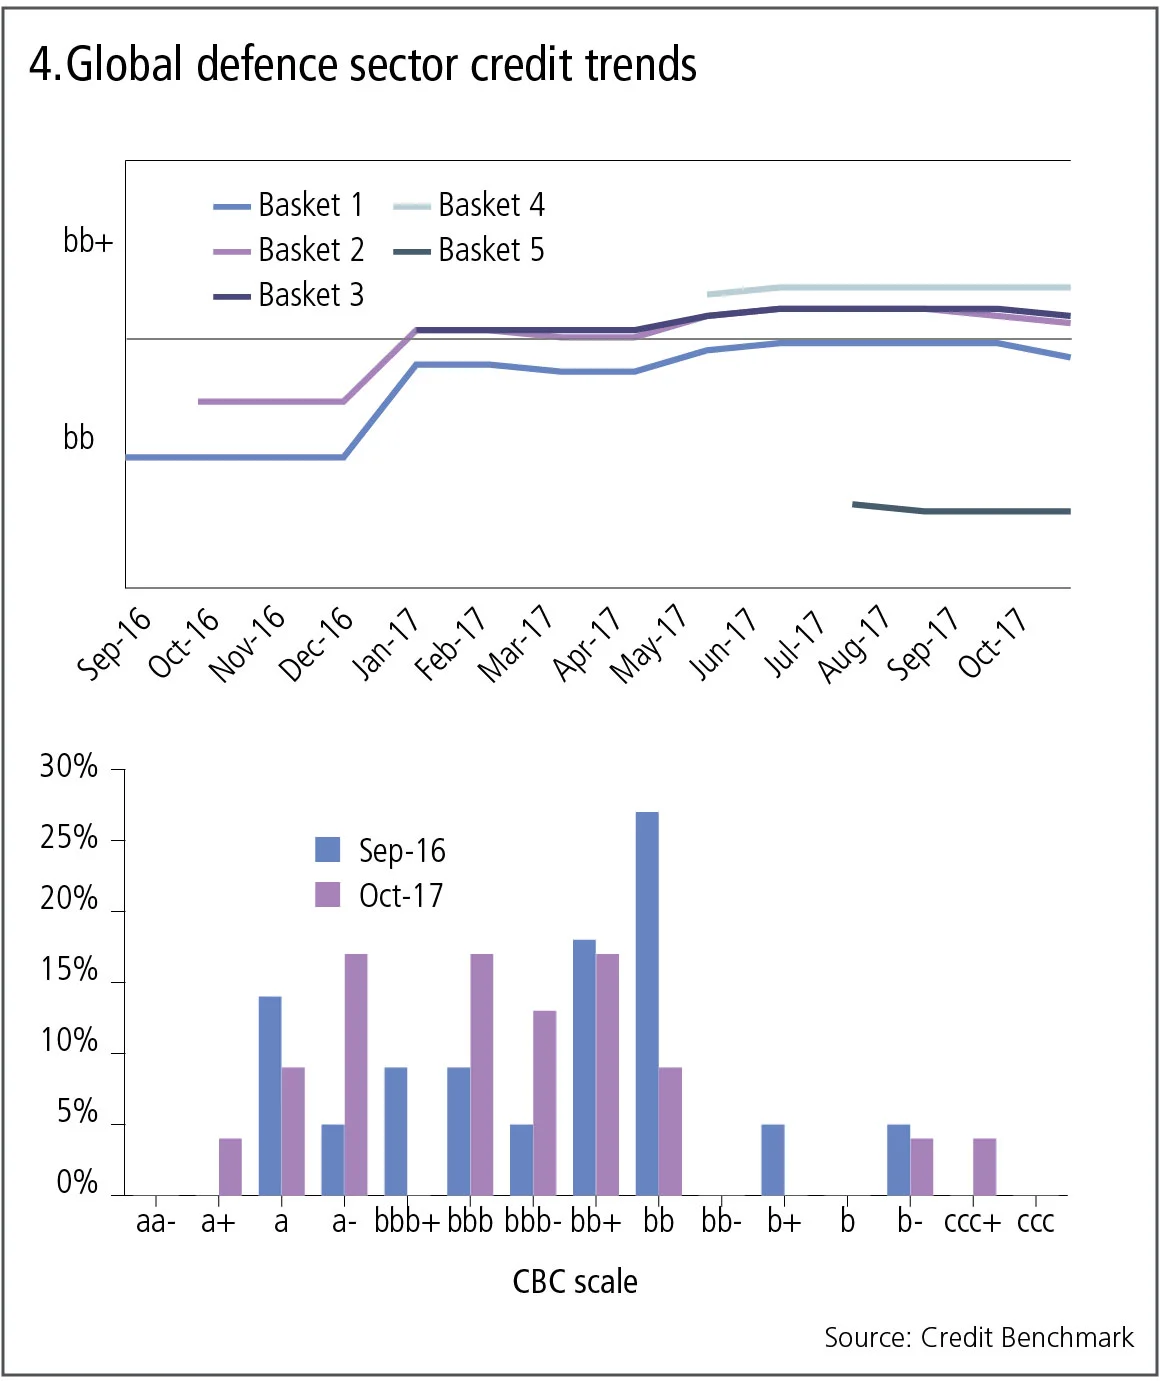
Figure 4 shows:
- The initial basket has improved one notch from a credit risk mid-bb to the bb+ category.
- As with coal, the improving environment has prompted banks to deal with higher-risk names. This movement is particularly dramatic in the most recent basket, where the selection effect gives a credit risk of bb, with higher risk than the initial basket. This suggests banks expect a dramatic improvement in the fortunes of defence companies.
- The bottom chart shows the distribution of the defence universe across the credit spectrum. This shows there has already been a significant improvement in the credit standing of the companies in the sector; the higher average risk of the current basket shows banks expect this trend to continue.
Comparison with CDS prices for point-in-time modelling
Point-in-time model calibration will be a major focus for banks in 2018, as the industry adopts new standards on loan-loss accounting that require the forecasting of lifetime expected losses for loans that are deteriorating in quality. This forecasting requires a blend of current conditions with through-the-cycle losses.
Bank-sourced data provides some useful inputs because the industry’s PD estimates reflect the ‘real-world’ risk of default – they are not market-implied risk estimates, which reflect shorter-term concerns as well as liquidity dynamics – and they tend to come in the form of one-year, through-the-cycle numbers. By applying suitable assumptions about recovery rates and default risk term structures, it is possible to use these inputs to estimate a real-world expected loss, which can provide a benchmark for traded CDSs and support point-in-time model calibration.
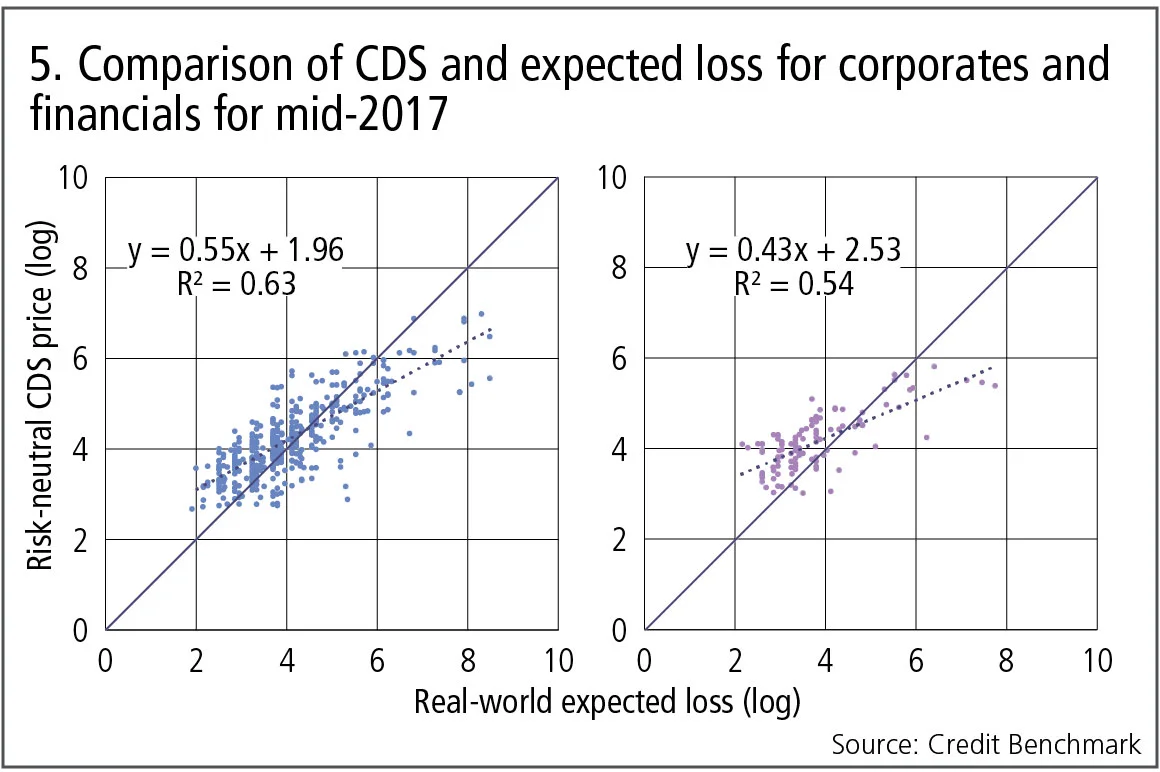
Figure 5 shows:
- In mid-2017, most corporate and financial CDSs were trading at a significant risk premium compared with the real-world estimates.
- However, most of the higher-risk issuers were trading at a discount to the expected loss estimate. This is at least partly due to lower liquidity and higher cost of hedging in the reference bonds, but it may also reflect the prevailing state of the credit cycle. When compared with through-the-cycle measures, negative risk premiums are possible when the credit cycle is in its late phase.
- The intercept in each chart can be interpreted as a base level of risk premium; in mid-2017 it was higher for financials than for corporates. This analysis will be updated in the first quarter of 2018.
About this data
The Credit Benchmark dataset is based on internally modelled credit ratings from a pool of contributor banks. These are mapped into a standardised 21-bucket ratings scale, so downgrades and upgrades can be tracked on a monthly basis. Obligors are only included where ratings have been contributed by at least three different banks, yielding a total dataset of roughly 13,000 names, which is growing by 5% per month.
コンテンツを印刷またはコピーできるのは、有料の購読契約を結んでいるユーザー、または法人購読契約の一員であるユーザーのみです。
これらのオプションやその他の購読特典を利用するには、info@risk.net にお問い合わせいただくか、こちらの購読オプションをご覧ください: http://subscriptions.risk.net/subscribe
現在、このコンテンツを印刷することはできません。詳しくはinfo@risk.netまでお問い合わせください。
現在、このコンテンツをコピーすることはできません。詳しくはinfo@risk.netまでお問い合わせください。
Copyright インフォプロ・デジタル・リミテッド.無断複写・転載を禁じます。
当社の利用規約、https://www.infopro-digital.com/terms-and-conditions/subscriptions/(ポイント2.4)に記載されているように、印刷は1部のみです。
追加の権利を購入したい場合は、info@risk.netまで電子メールでご連絡ください。
Copyright インフォプロ・デジタル・リミテッド.無断複写・転載を禁じます。
このコンテンツは、当社の記事ツールを使用して共有することができます。当社の利用規約、https://www.infopro-digital.com/terms-and-conditions/subscriptions/(第2.4項)に概説されているように、認定ユーザーは、個人的な使用のために資料のコピーを1部のみ作成することができます。また、2.5項の制限にも従わなければなりません。
追加権利の購入をご希望の場合は、info@risk.netまで電子メールでご連絡ください。
詳細はこちら コメント
オペリスク・データ:企業スパイがBBVAに脅威をもたらす
他にも:BofAがエプスタイン氏との関与疑惑で追及されています。また、少数株主がブルックフィールドに異議を唱えています。データ提供:ORX News

AI政治の台頭
MASの顧問であるデビッド・ハードーン氏は、AIを単なる一つの技術として扱うべきではないと述べています

AIリスク管理と能力制御への移行
リスク管理者によると、検証の枠組みを見直すことで、銀行はイノベーションと規制上の要件を両立させ、強固なリスク管理体制を維持することができます

トークン化された商品市場は、経済の円滑な運営に寄与する可能性がある
暗号資産の専門家は、実物資産をブロックチェーンに移行することで、担保に関する摩擦が緩和されると主張しています

GenAIの時代において、未だに優れたモデルが必要なのはなぜなのか?
ジャン=フィリップ・ブショー氏は、モデルが人工知能をレジームシフトの過程で導き、過学習から遠ざけることができると述べています

取引のスピードがガバナンスを上回る時:一瞬の統制の隙間
デリバティブの専門家によると、光駆動型エレクトロニクスの新たな形態が、市場インフラにおける次のリスクとなる可能性があるとのことです

先物とオプションが示す戦争のコスト
現物価格は大きな混乱を示していますが、先物市場はこれが一時的なものだと示唆しており、オプション市場は不安定な状況が続くと示唆しています

担保に関して、TINAはTIAになることができるのか
あるエコノミストは、レポ取引やデリバティブ取引における担保としての米国債の優位性は、もはや揺るぎないものではないと指摘しています