Swaps data: SOFR volume and margin insights
Data shows recent leap in SOFR trades – and hints at growth in synthetic swaps

This year promises to be an interesting one in derivatives markets, and with January volumes now in, I wanted to look at what the data tells us about two in-flight, high-stakes projects – interest rate benchmark reform and non-cleared margin rules.
Let’s start with the Alternative Reference Rates Committee’s (ARRC) progress on introducing a smooth and orderly transition from US dollar Libor to its replacement, the secured overnight financing rate (SOFR), under its published transition plan. This expects that during 2019, increased activity in SOFR-linked futures and overnight interest rate swaps (OIS) will build price histories and help market participants develop a term structure for SOFR.
CME SOFR futures
SOFR futures were launched by CME in May 2018.
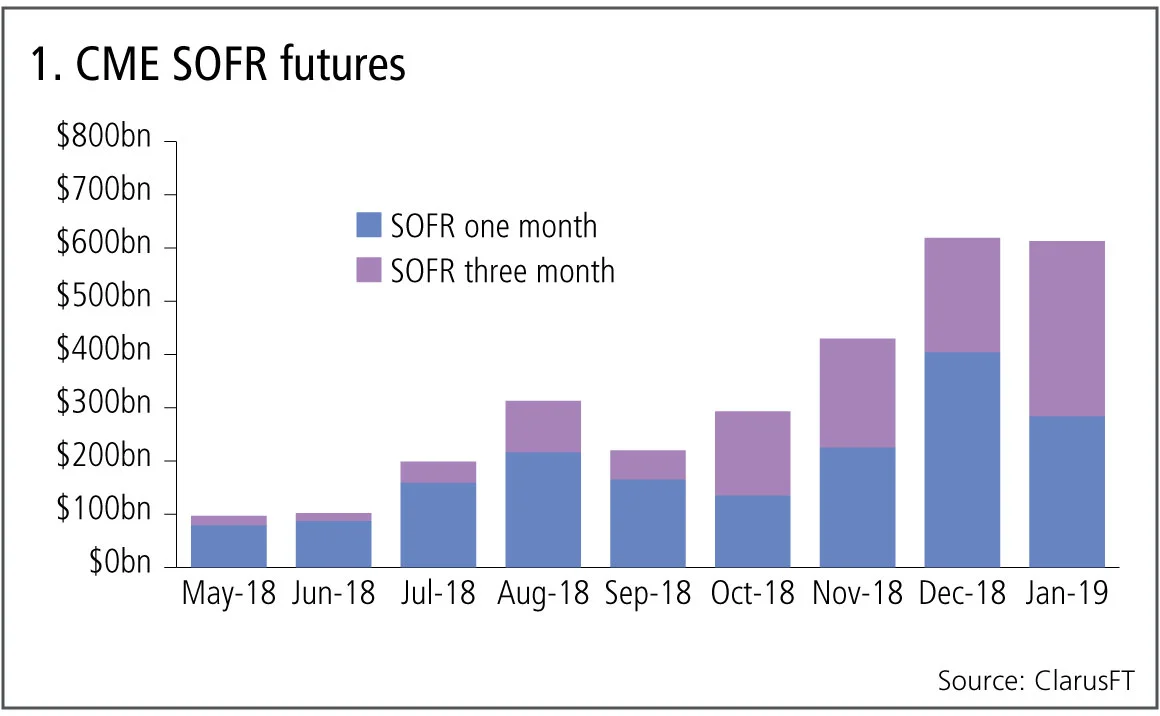
Figure 1 shows:
- Volumes continuing to rise month on month.
- $600 billion equivalent gross notional traded in each of the past two months.
- A cumulative total of $2.9 trillion in equivalent gross notional.
CME’s preferred measure, average daily volume (ADV) in number of contracts, shows January to be 18% higher than December, as the three-month contract has a lower equivalent notional than the one-month.
It will be interesting to see how volume develops in future months.
SOFR swaps
The first question for trading in SOFR swaps is which version of the product will dominate trading; will be it OIS versus fixed, similar to the well-traded Fed funds OIS, or will it be basis swaps, versus either Fed funds or Libor?
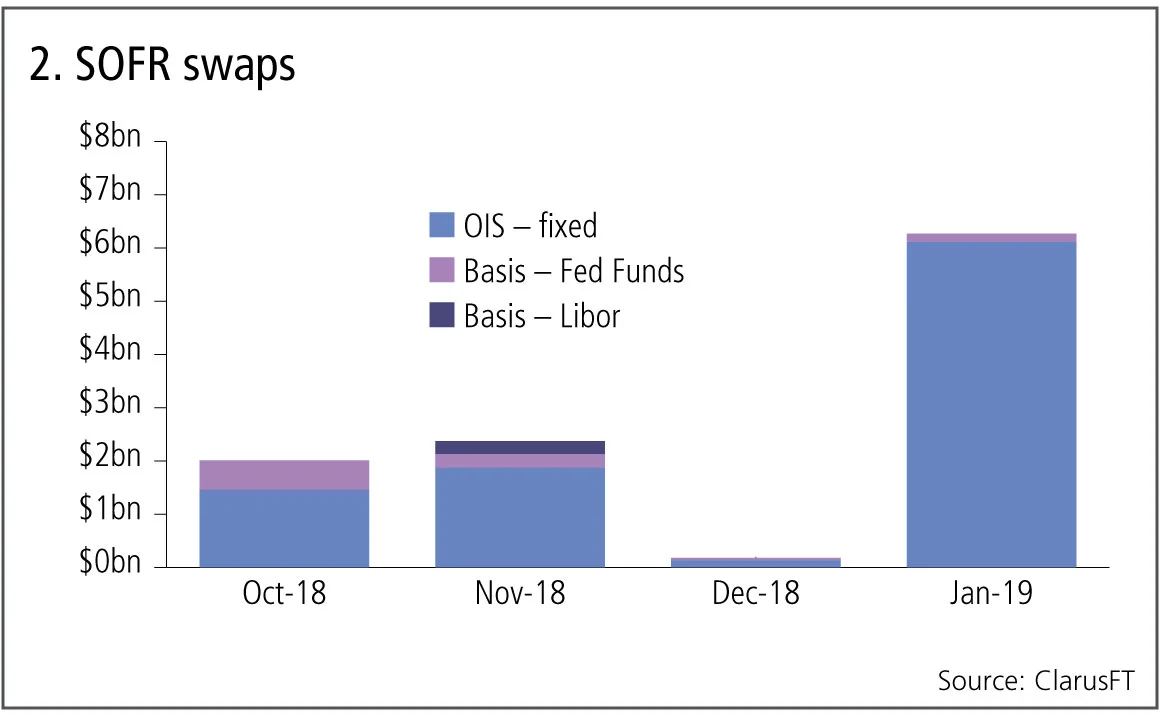
Figure 2 shows:
- OIS versus fixed swaps are clearly the most traded.
- Jan 2019 saw $6 billion gross notional, the highest month by far.
- All of the 25 trades in Jan 29 were traded off-swap execution facility (Sef) and the majority were cleared.
- Basis swaps – Fed funds versus SOFR – are the next largest product, with a cumulative gross notional of $1 billion since October 2018.
- There has only been a single Libor versus SOFR trade in this period.
As well as volumes increasing, we also need to see lengthening maturities if a SOFR term structure is going to develop.
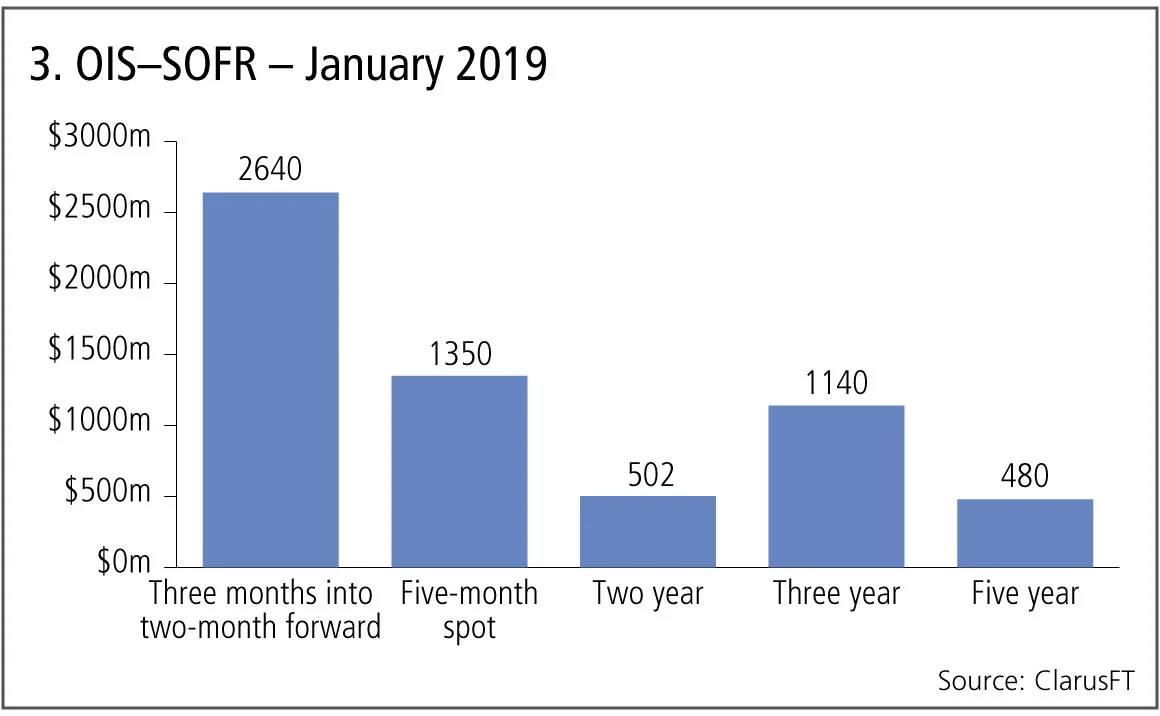
Figure 3 shows:
- January’s $6 billion of OIS SOFR swaps broken down by maturity.
- The first two bars, three months into two-month forwards and five-month spot starting, make up 65% of the volume.
- Two-year, three-year and five-year swaps make up the remaining 35%.
So, there is some evidence of longer maturities starting to trade.
We are still in the initial steps of the ARRC transition plan and as 2019 prices, volumes and maturities develop, a key next step will be in the first quarter of 2020, when clearing houses are expected to change their discounting curve to SOFR and pay SOFR interest on posted collateral – this will encourage market participants to use SOFR as the reference rate as well.
Non-cleared margin rules
Non-cleared margin rules currently require dozens of large dealers to collateralise their bilateral initial margin exposure, with hundreds more banks and end-users set to join them over the next 18 months as the final two phases of the rules are applied.
Option products are often the largest components of these bilateral exposures and generally linear delta risk is substantial in such portfolios. In addition, it is not straightforward to hedge this delta risk – for interest rate swaptions, the natural hedge would be a swap, but this has to be cleared and so cannot be booked into the non-cleared bilateral portfolio; for foreign exchange options, the natural hedge is forex forwards, which are not included in non-cleared margin rules.
Swaptions
Let’s look at the volume of US dollar swaptions traded in the US to see if there has been any impact on this market from the potential increase in costs.
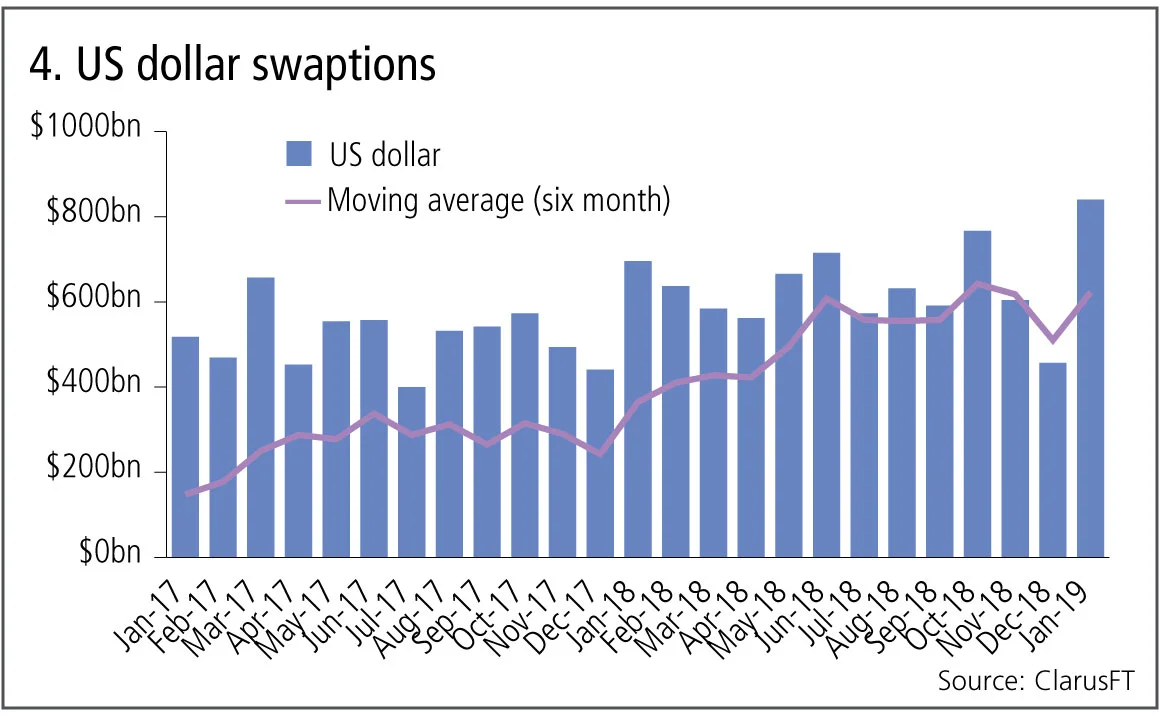
Figure 4 shows:
- Monthly volumes from Jan 2017 to Jan 2019.
- A six-month moving average line, rising from $460 billion a month at the start to $650 billion at the end.
- Definitely no adverse impact on volumes there, quite the opposite.
While some of the volume increase might be down to higher rates volatility in 2018 – resulting in more appetite for swaptions trading – a close look at the data reveals something else. Drilling down into January 2019 volumes (a record month), we see that 17% of the trades are equal and opposite swaptions – same strike, same expiry and underlying, meaning they only have linear delta risk and so behave like synthetic swaps. This activity was covered by Risk.net.
Non-deliverable forwards
Next the volume of uncleared non-deliverable forwards in major currency pairs – Australian dollar, euro, sterling and yen.
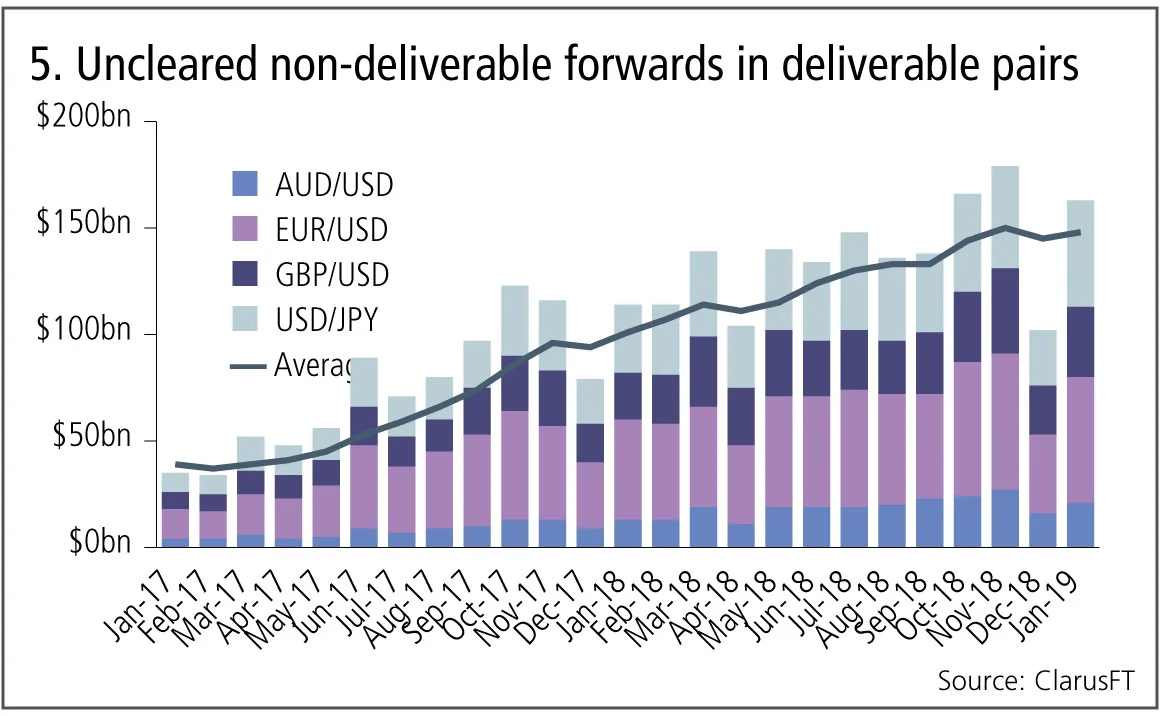
Figure 5 shows:
- A surprising and significant increase in monthly volumes.
- Volumes rise from $40 billion in January 2017 to $150 billion in January 2019.
- A pronounced rising moving average.
This is definitely not an effect we can put down to market demand as liquidity in these currency pairs is massively in the deliverable forex forward market.
The only explanation for these is the requirement to delta-hedge forex options in bilateral portfolios under non-cleared margin rules, as non-deliverable forwards count as a derivative product that is in scope.
Interesting that in this case non-cleared margin rules have resulted in more volume in a non-cleared product, but the driver of reducing initial margin exposure and need for collateralisation is certainly a good one and consistent with the objectives of reducing systemic risk.
Amir Khwaja is chief executive of Clarus Financial Technology.
コンテンツを印刷またはコピーできるのは、有料の購読契約を結んでいるユーザー、または法人購読契約の一員であるユーザーのみです。
これらのオプションやその他の購読特典を利用するには、info@risk.net にお問い合わせいただくか、こちらの購読オプションをご覧ください: http://subscriptions.risk.net/subscribe
現在、このコンテンツを印刷することはできません。詳しくはinfo@risk.netまでお問い合わせください。
現在、このコンテンツをコピーすることはできません。詳しくはinfo@risk.netまでお問い合わせください。
Copyright インフォプロ・デジタル・リミテッド.無断複写・転載を禁じます。
当社の利用規約、https://www.infopro-digital.com/terms-and-conditions/subscriptions/(ポイント2.4)に記載されているように、印刷は1部のみです。
追加の権利を購入したい場合は、info@risk.netまで電子メールでご連絡ください。
Copyright インフォプロ・デジタル・リミテッド.無断複写・転載を禁じます。
このコンテンツは、当社の記事ツールを使用して共有することができます。当社の利用規約、https://www.infopro-digital.com/terms-and-conditions/subscriptions/(第2.4項)に概説されているように、認定ユーザーは、個人的な使用のために資料のコピーを1部のみ作成することができます。また、2.5項の制限にも従わなければなりません。
追加権利の購入をご希望の場合は、info@risk.netまで電子メールでご連絡ください。
詳細はこちら コメント
オペリスク・データ:企業スパイがBBVAに脅威をもたらす
他にも:BofAがエプスタイン氏との関与疑惑で追及されています。また、少数株主がブルックフィールドに異議を唱えています。データ提供:ORX News

AI政治の台頭
MASの顧問であるデビッド・ハードーン氏は、AIを単なる一つの技術として扱うべきではないと述べています

AIリスク管理と能力制御への移行
リスク管理者によると、検証の枠組みを見直すことで、銀行はイノベーションと規制上の要件を両立させ、強固なリスク管理体制を維持することができます

トークン化された商品市場は、経済の円滑な運営に寄与する可能性がある
暗号資産の専門家は、実物資産をブロックチェーンに移行することで、担保に関する摩擦が緩和されると主張しています

GenAIの時代において、未だに優れたモデルが必要なのはなぜなのか?
ジャン=フィリップ・ブショー氏は、モデルが人工知能をレジームシフトの過程で導き、過学習から遠ざけることができると述べています

取引のスピードがガバナンスを上回る時:一瞬の統制の隙間
デリバティブの専門家によると、光駆動型エレクトロニクスの新たな形態が、市場インフラにおける次のリスクとなる可能性があるとのことです

先物とオプションが示す戦争のコスト
現物価格は大きな混乱を示していますが、先物市場はこれが一時的なものだと示唆しており、オプション市場は不安定な状況が続くと示唆しています

担保に関して、TINAはTIAになることができるのか
あるエコノミストは、レポ取引やデリバティブ取引における担保としての米国債の優位性は、もはや揺るぎないものではないと指摘しています