Credit data: doom loop depends on sovereign strength
Analysis of 59 countries shows bank and sovereign credit are most likely to be correlated in lower-rated countries

Rising global rates, coupled with trade tensions, have contributed to the recent bout of volatility in emerging markets. Venezuela now has hyperinflation, Argentina is struggling with a renewed currency crisis despite emerging from default two years ago, while Turkey is grappling with high levels of dollar debt and a prolonged devaluation. Even Italy – still investment grade and a member of the euro – is at risk of a sovereign downgrade.
During these periodic and contagious crises, a key investment question centres on the link between sovereign, corporate and banking credit risk: put simply, can local companies chart their own course, or does everything become contaminated by sovereign risk? In the eurozone debt crisis, this dangerous embrace between banks and sovereigns was dubbed a ‘doom loop’.
Analysis of the credit trends of banks and corporates in 59 countries suggests some of this depends on the strength of the sovereign. Banks and corporates in non-investment-grade countries are more likely to be correlated with sovereign credit than those in investment-grade countries – perhaps because banks and corporates in more creditworthy countries are also more likely to be internationally active and have a more diverse mix of assets.
Turkey’s recent woes have raised questions about the risk of contagion between local banks and European lenders. A separate analysis in this article shows no apparent link between the two in terms of recent credit performance. In fact, as default probabilities for large Turkish banks have increased this year, those for eurozone banks have dipped. Elsewhere this month, we review credit trends for Main Street versus Silicon Valley and examine the six-month credit volatility of constituents for large US and European stock indexes – it has been growing strongly since the second quarter.
Global credit industry trends
The latest bank-sourced credit data, based on 25 contributor banks, shows upgrade and downgrade activity has further increased, with 80 companies moving more than one notch. Figure 1 shows detailed industry migration trends for the most recent published data, based on data adjusted for changes in contributor mix.
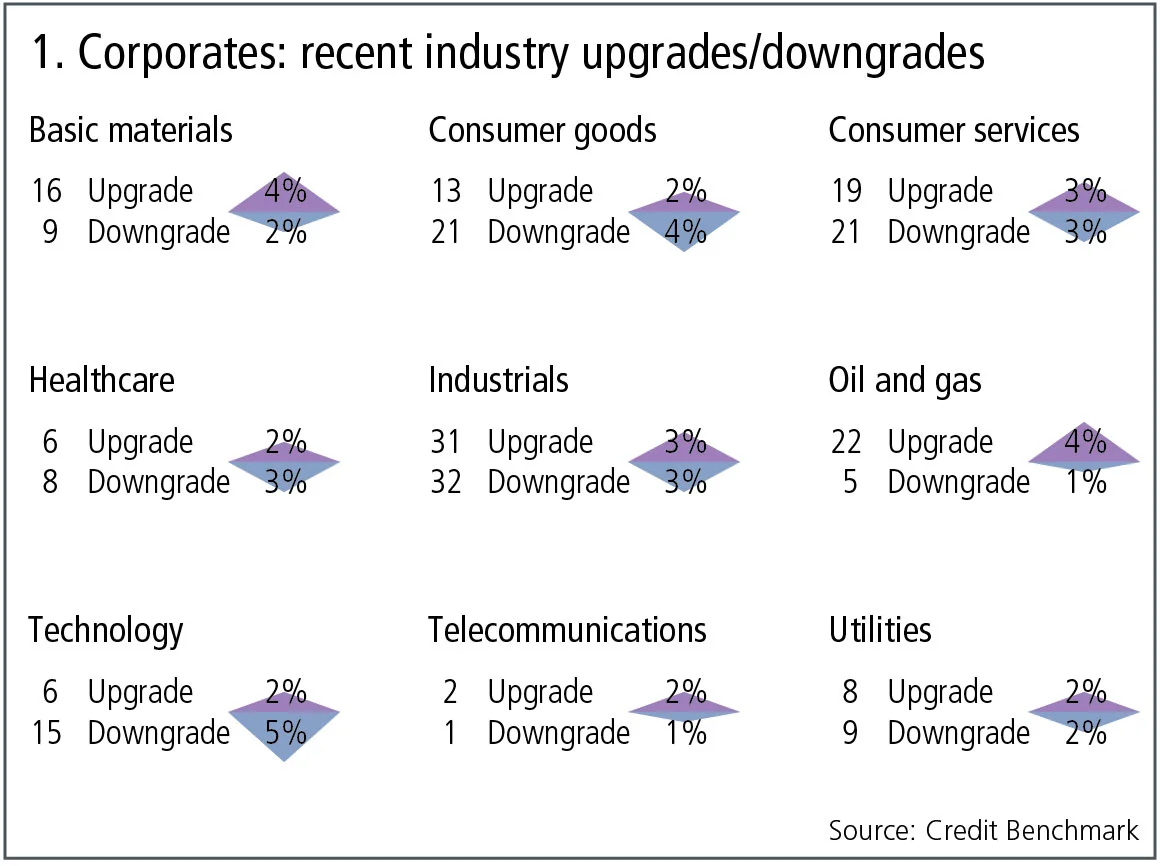
Figure 1 shows:
- Across global corporates, the number of upgrades and downgrades are in balance.
- An equal number of industries for which upgrades dominate, downgrades dominate or are balanced.
- Basic materials and oil and gas continue their trend of the past few months, with upgrades outweighing downgrades.
- Technology has seen a change to downgrades outnumbering upgrades, after a month of balance preceded by a quarter favouring upgrades.
- Consumer services, industrials and utilities have stabilised, with upgrades and downgrades in balance after two months that favoured upgrades.
- Telecommunications continues the trend of slightly favouring upgrades for the third month.
- Healthcare returns to its trend of downgrades outweighing upgrades, after a period of the reverse.
- Consumer goods once again sees downgrades outnumbering upgrades after a quarter of stability.
Sovereign vs corporate credit risk
Figure 2 plots relationships between sovereigns and corporates, and between sovereigns and banks, for 59 countries, split into investment-grade and high-yield categories.
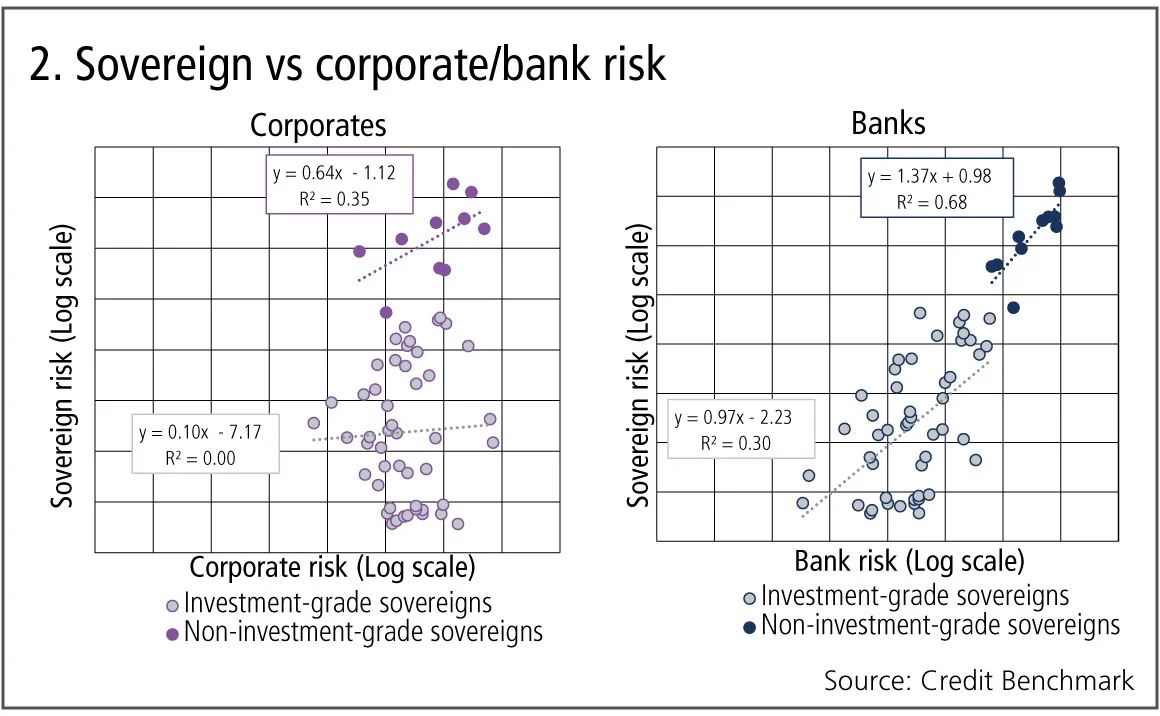
Figure 2 shows:
- For investment-grade sovereigns, there is no obvious relationship between sovereign and corporate credit risk.
- For high-yield sovereigns, there is a modestly positive relationship between sovereign and corporate credit risk, although the country sample is small.
- Bank credit risk shows modest (investment grade) and strong (high yield) positive relationships with sovereign credit risk.
- Section 4 of this report shows a detailed example of this for Turkey.
Main Street vs Silicon Valley
The US stock market continues to make new records, with the longest bull run in history, frequent new highs, and Apple becoming the first-ever $1 trillion market cap company. But some divergences are starting to appear. Some of the most reliable technology stocks have seen significant share-price drops, with earnings misses adding to concerns about social media governance and fickle young consumers turning away from smartphones. Main Street and Silicon Valley are increasingly in direct competition, with traditional manufacturers embedding increasingly sophisticated technology in their products while the largest tech companies are diversifying into telecoms, autos and logistics. Figure 3 shows the relative credit trends and credit distribution for the largest mainstream 500 companies in the US (a proxy for the S&P 500) and a large sample of about 1,000 companies with a Nasdaq listing.
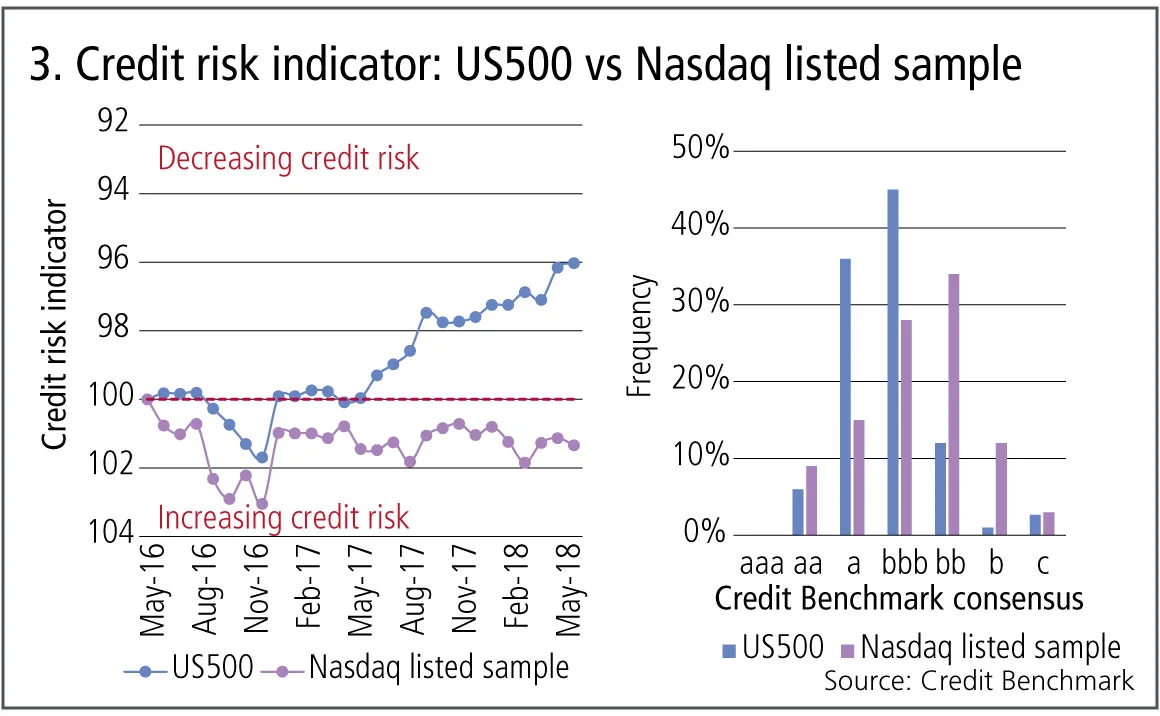
Figure 3 shows:
- Both series show a deterioration in credit quality in 2016.
- The two series tracked one another quite closely until mid-2017.
- After mid-2017, there has been a sustained improvement in credit risk for the US500 series.
- Credit risk for the Nasdaq listed sample has shown a slight deterioration since early 2017.
Turkish banks vs Europe
Recent emerging market woes seem to be spreading. Venezuela has been in serious difficulties for more than a year, while Argentina’s currency has slid since April. Turkey’s currency has been sliding since the start of this year, with the main concern being that its corporates have borrowed heavily in US dollars – an increasingly common activity in developing economies that can turn a traditional one-off currency devaluation into a full-blown foreign exchange crisis. Turkish domestic banks are understandably the most exposed lenders, but there have been widespread concerns about contagion to European banks. Bank-sourced data suggests these concerns are overdone.
Figure 4 compares the recent credit trends for eurozone and Turkish banks. It also shows the pattern of improvements and deteriorations in Turkey.
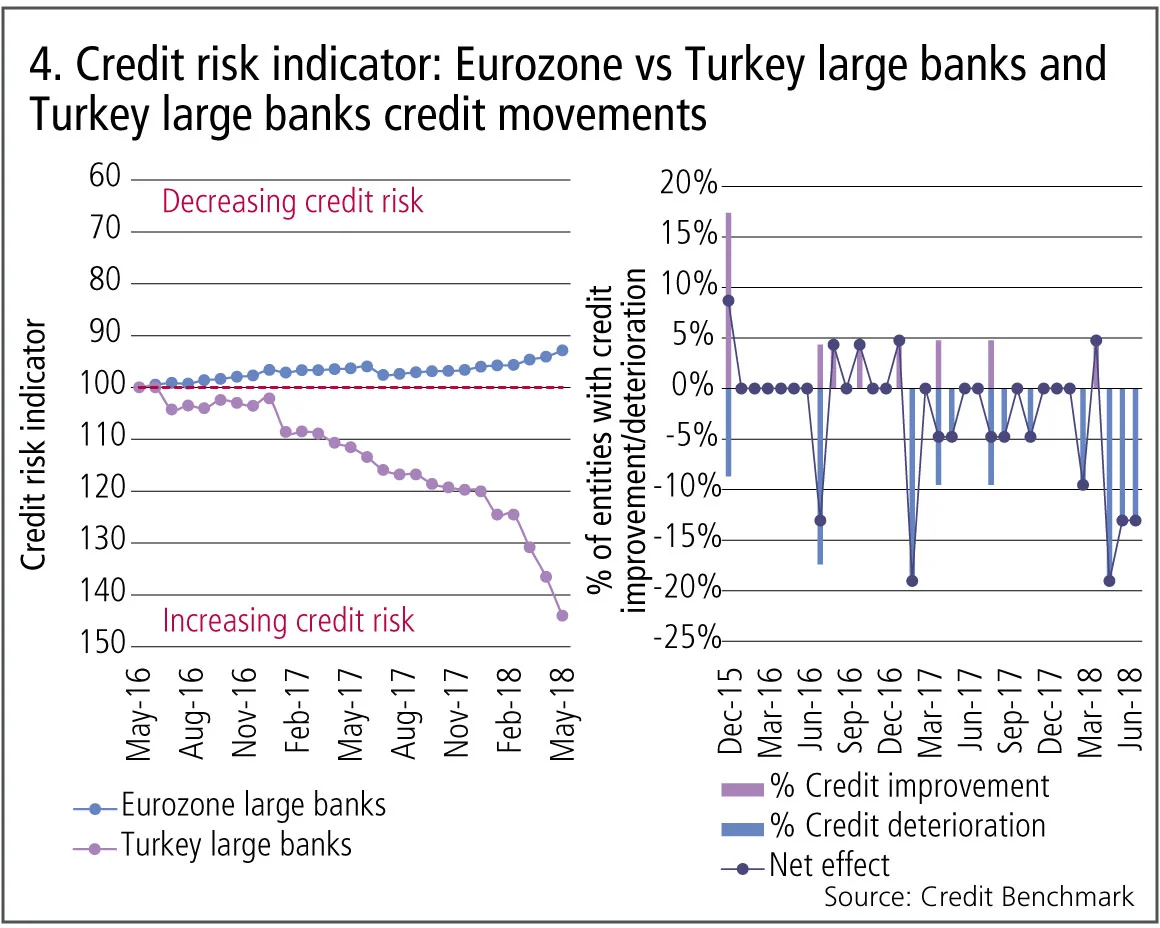
Figure 4 shows:
- The eurozone banks have been steadily improving over the past two years.
- Changes in bank estimates (the right hand chart) show that the pattern of frequent and large deteriorations began in 2016.
- Turkish banks show a dramatic and potentially accelerating decline.
- Credit data shows no evidence of ‘contagion’ from Turkish to eurozone banks.
Credit volatility
The equity Vix – often referred to as the ‘fear index’ – has been below its long-run average in recent years, and any spikes have been short-lived. Some commentators have linked this extended period of muted volatility to the persistence of low interest rates, so a sustained monetary tightening could see the Vix moving back towards more typical levels. There is no direct credit equivalent to the equity Vix; but the observed volatility of credit spreads provides a proxy. Bank-sourced data provides a more forward-looking view of credit risk, free from risk premium distortions, so the rolling volatility of bank credit estimates can be seen as a closer credit equivalent to the Vix.
Figure 5 shows the annualised six-month rolling volatility of credit estimates for the constituents of the main equity indexes, covering the US, UK, France and Germany.

Figure 5 shows:
- Similar to the equity Vix, credit volatility is itself quite volatile.
- Unlike the equity Vix, credit volatility can drop to very low levels – such as June 2017 – during periods when credit risk estimates are seeing no significant revisions.
Credit volatility has been trending higher over this period, suggesting increasing uncertainty about the outlook for credit. Data from the St Louis Fed (not shown) indicates US credit spreads have narrowed over most of this period. If volatility remains high or increases further, spreads may start to expand.
About this data
The Credit Benchmark dataset is based on internally modelled credit ratings from a pool of contributor banks. These are mapped into a standardised 21-bucket ratings scale, so downgrades and upgrades can be tracked on a monthly basis. Obligors are only included where ratings have been contributed by at least three different banks, yielding a total dataset of nearly 21,200 names.
David Carruthers is head of research at Credit Benchmark.
コンテンツを印刷またはコピーできるのは、有料の購読契約を結んでいるユーザー、または法人購読契約の一員であるユーザーのみです。
これらのオプションやその他の購読特典を利用するには、info@risk.net にお問い合わせいただくか、こちらの購読オプションをご覧ください: http://subscriptions.risk.net/subscribe
現在、このコンテンツを印刷することはできません。詳しくはinfo@risk.netまでお問い合わせください。
現在、このコンテンツをコピーすることはできません。詳しくはinfo@risk.netまでお問い合わせください。
Copyright インフォプロ・デジタル・リミテッド.無断複写・転載を禁じます。
当社の利用規約、https://www.infopro-digital.com/terms-and-conditions/subscriptions/(ポイント2.4)に記載されているように、印刷は1部のみです。
追加の権利を購入したい場合は、info@risk.netまで電子メールでご連絡ください。
Copyright インフォプロ・デジタル・リミテッド.無断複写・転載を禁じます。
このコンテンツは、当社の記事ツールを使用して共有することができます。当社の利用規約、https://www.infopro-digital.com/terms-and-conditions/subscriptions/(第2.4項)に概説されているように、認定ユーザーは、個人的な使用のために資料のコピーを1部のみ作成することができます。また、2.5項の制限にも従わなければなりません。
追加権利の購入をご希望の場合は、info@risk.netまで電子メールでご連絡ください。
詳細はこちら コメント
マルキールのサル:運用者の能力を測る、より優れたベンチマーク
iM Global Partnersのリュック・デュモンティエ氏とジョアン・セルファティ氏は、ある有名な実験が、株式選定者のパフォーマンスを評価する別の方法を示唆していると述べています。

IMAの現状:大きな期待と現実の対峙
最新のトレーディングブック規制は内部モデル手法を改定しましたが、大半の銀行は適用除外を選択しています。二人のリスク専門家がその理由を探ります。

地政学的リスクがどのようにシステム的なストレステストへと変化したのか
資源をめぐる争いは、時折発生するリスクプレミアムを超えた形で市場を再構築しています。

オペリスクデータ:FIS、ワールドペイとのシナジー効果の失敗の代償を支払うことに
また:ORXニュースによるデータで、リバティ・ミューチュアル、年齢差別訴訟で過去最高額を支払う;ネイションワイド、不正防止対策の不備。

東京の豊富なデータが市場への影響について明らかにすること
新たな研究により、定量金融において最も直感に反する概念の一つが普遍的であることが確認されました。

資金調達コストの配分:集中型 vs 分散型
サチン・ラナデ氏は、特に担保付融資において、集中化は資本効率と自己資本利益率(ROE)の向上に寄与し得ると述べています。

Collateral velocity is disappearing behind a digital curtain
Dealers may welcome digital-era rewiring to free up collateral movement, but tokenisation will obscure metrics

クリプトにおいて、本当にすべての取引がT+0である必要があるのか?
即時決済には固有のリスクが伴いますが、必ずしもデフォルト設定である必要はありません、とBridgePortのソリアーノ氏は記しています。