Swaps data: a Mifid-shaped hole
Data shows strong growth in US dollar rate swaps, but global picture is incomplete, says Amir Khwaja of Clarus FT

As the first quarter of 2018 ends with the US Federal Reserve still on a rate-hiking path, it’s a good time to take stock of global US dollar swaps volumes.
Unfortunately, that’s easier said than done: while clearing houses, swap execution facilities and swap data repositories (SDRs) all provide parts of the picture, there is a big, Europe-shaped hole in the data. That hole exists despite the efforts of European legislators to bring additional transparency to the over-the-counter derivatives market in the form of the second Markets in Financial Instruments Directive (Mifid II).
Almost three months after its implementation, useful data is still lacking. There are three main reasons. First, the many trading venues and approved publication arrangements have not made it straightforward to collect and aggregate data. Second, the decision by the European Securities and Markets Authority to require international securities identification numbers (Isins) to be used for OTC derivatives – and, worse, for a specific maturity date to be included in the definition – has led to the issuance of 5 million new Isins, and counting. This greatly complicates meaningful aggregation of monthly volume. Third, deferral rules that differ by venue from two days to four weeks, and teething issues in the specifics of the data, make it impossible to aggregate volume on a specific day in a timely manner.
Our hope is still that these issues will be resolved, but it may take months to do so.
Global cleared volumes
Let’s start by comparing monthly volumes in this quarter with a year earlier.
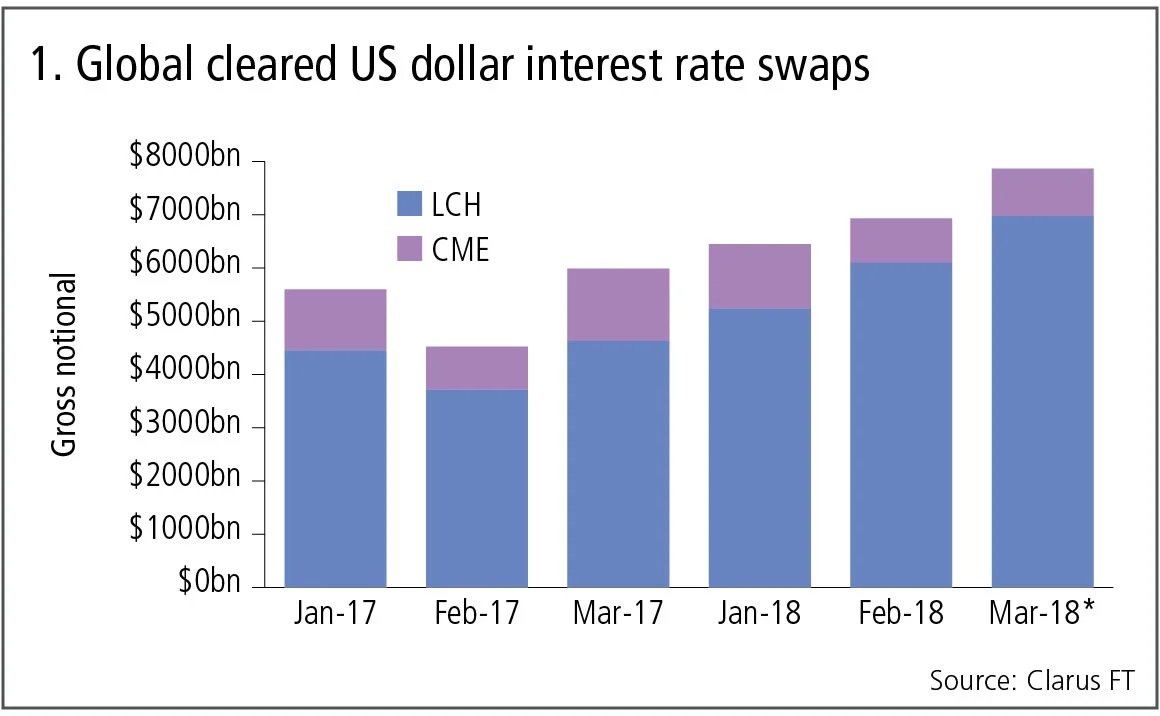
Figure 1 shows:
- Cumulative volume of $21 trillion gross notional in cleared US dollar interest rate swaps in Q1 2018, up a very healthy 32% from $16 trillion in Q1 2017.
- Volume increasing with each month in 2018.
- March 2018 figures, projected from three out of four weeks of data, look to be heading to a record volume month of $7.8 trillion.
- LCH SwapClear has increased market share from 80% in Q1 2017 to 86% in Q1 2018.
- So the cleared interest rate swap market continues to grow strongly, with exceptional volume growth at LCH SwapClear.
Swap execution facilities
Swap execution facilities (Sefs) are trading venues on which a subset of the cleared swaps executed by US-regulated market participants are required to be executed. Sefs publish their daily volumes, so let’s aggregate these for dealer-to-client and dealer-to-dealer Sefs for each month in Q1 2018 and compare with a year earlier.

Figure 2 shows:
- Cumulative volume of $9 trillion gross notional in cleared US dollar interest rate swaps in Q1 2018, up the same 32% from $7 trillion in Q1 2017, with volume increasing in each month in 2018.
- March 2018 figures, which I have projected from three out of four weeks of data, look to be heading to a record volume month of $3 trillion.
- Dealer-to-client Sefs (Bloomberg, Tradeweb and TrueEx) capturing most of the growth and increasing their market share to 70% in Q1 2018 from 63% a year earlier.
- Dealer-to-dealer Sefs (BGC, Dealerweb, TP Icap and Tradition) with similar volume in Q1 2018 to a year earlier.
The on-Sef $9 trillion of gross notional in Q1 2018 is 43% of the global cleared US dollar interest rate swap volume of $21 trillion.
So, where do we look for the remaining 57%?
First, we need to find US persons-cleared volume that is transacted off-Sef, which we know will be substantial as only spot-starting vanilla par swaps and the first two IMM and Mac swaps are mandated to be executed on a swap execution facility – meaning some common trades – such as forward-starting swaps, which are cleared – will be executed off-Sef.
Swap data repositories
US SDRs publish trade-level data for all over-the-counter derivatives traded by US persons and we can aggregate this data to get an insight into the volume of on-Sef vs off-Sef business and cleared vs uncleared trades.
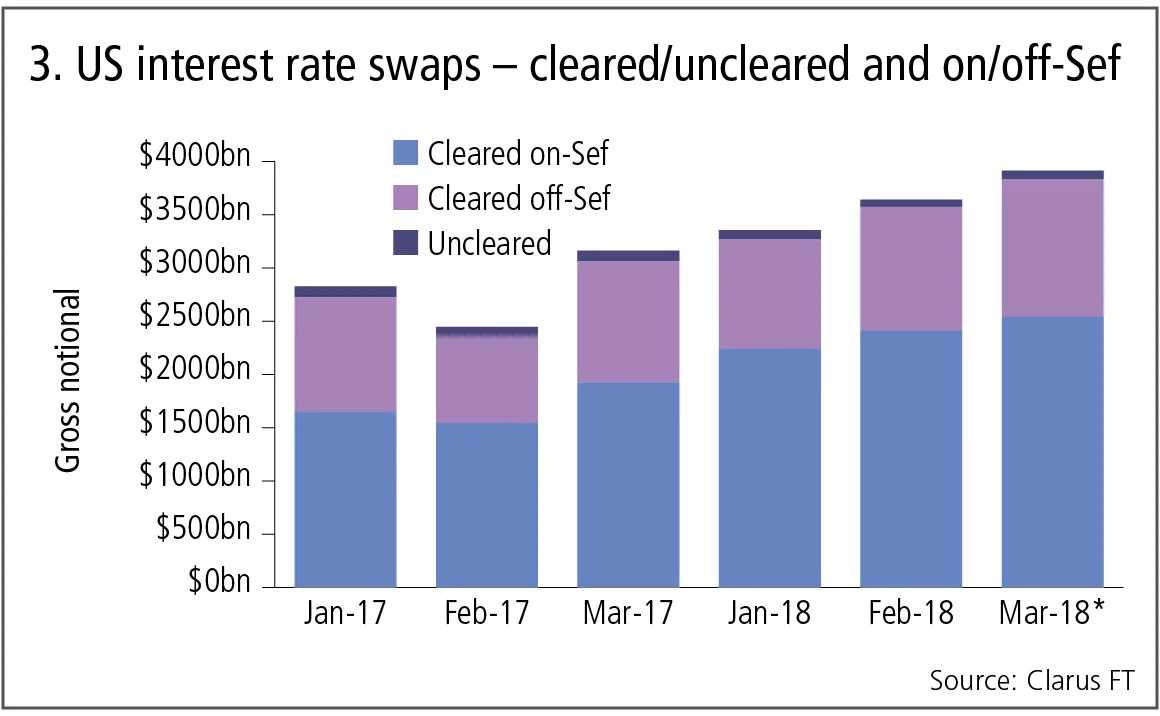
Figure 3 shows:
- Only a small amount of US dollar interest rate swaps is uncleared, averaging less than $80 billion in a month.
- Cleared on-Sef trades form the largest component, followed by cleared off-Sef trades.
- Q1 2018 SDR data shows $7.2 trillion of cleared on-Sef gross notional, which is less than the $9 trillion reported in the preceding chart by Sefs. The discrepancy is due to the capping of large trade notionals in SDR data so their true notionals are not shown – an attempt to protect market liquidity.
- Similarly, the $3.5 trillion in cleared off-Sef gross notional in Q1 2018 needs to be scaled up to $5 trillion.
Consequently, we can say that in Q1 2018, $9 trillion of cleared US dollar interest rate swaps were executed on-Sef and approximately $5 trillion of cleared US dollar interest rate swaps were executed off-Sef. The cumulative total of $14 trillion, represents 67% of the global cleared volume.
Where do we look for the remaining 33%?
European data
The obvious location is Europe and specifically London, where a significant number of swaps trading venues are located. As noted above, however, Mifid II has so far failed to deliver.
Trade repositories pre-date Mifid as far as derivatives are concerned, and they have been publishing daily data for a number of years. Unfortunately, due to double-sided reporting and to the highly aggregated nature of the data published, the public repository data is also largely meaningless and no use in understanding monthly volumes of US dollar swaps.
US dollar overnight index swaps
There is much talk and press on the transition away from Libor to new reference indexes so – while it is early days for the new Secured Overnight Financing Rate in the US – let’s take a look at the volumes of US dollar overnight index swaps (OIS) that use the Fed Funds rate.
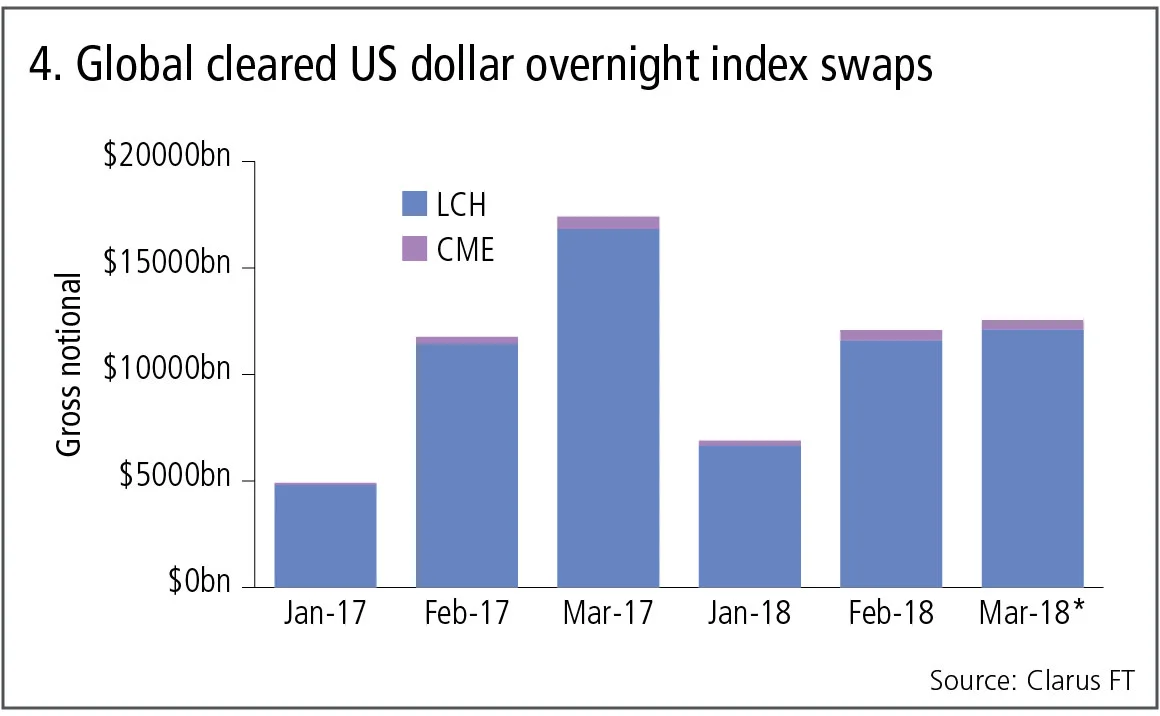
Figure 4 shows:
- Cumulative volume of $31 trillion gross notional in cleared US dollar overnight index swaps in Q1 2018, down 8% from the $35 trillion in Q1 2017, with March 2017 a record month.
- OIS volume is more than the $21 trillion gross notional in cleared US dollar swaps during Q1 2018.
OIS volumes may be eye-catching, but the overwhelming short maturities of this product, mean that when notional is converted into the DV01 risk measure, OIS swaps are dwarfed by swaps to the tune of $100 million DV01 in Q1 2018 compared with nearly $5 billion DV01.
This shows the challenge ahead for SOFR and other new reference rates positioning to replace Libor.
Amir Khwaja is chief executive of Clarus Financial Technology
Editing by Duncan Wood
コンテンツを印刷またはコピーできるのは、有料の購読契約を結んでいるユーザー、または法人購読契約の一員であるユーザーのみです。
これらのオプションやその他の購読特典を利用するには、info@risk.net にお問い合わせいただくか、こちらの購読オプションをご覧ください: http://subscriptions.risk.net/subscribe
現在、このコンテンツを印刷することはできません。詳しくはinfo@risk.netまでお問い合わせください。
現在、このコンテンツをコピーすることはできません。詳しくはinfo@risk.netまでお問い合わせください。
Copyright インフォプロ・デジタル・リミテッド.無断複写・転載を禁じます。
当社の利用規約、https://www.infopro-digital.com/terms-and-conditions/subscriptions/(ポイント2.4)に記載されているように、印刷は1部のみです。
追加の権利を購入したい場合は、info@risk.netまで電子メールでご連絡ください。
Copyright インフォプロ・デジタル・リミテッド.無断複写・転載を禁じます。
このコンテンツは、当社の記事ツールを使用して共有することができます。当社の利用規約、https://www.infopro-digital.com/terms-and-conditions/subscriptions/(第2.4項)に概説されているように、認定ユーザーは、個人的な使用のために資料のコピーを1部のみ作成することができます。また、2.5項の制限にも従わなければなりません。
追加権利の購入をご希望の場合は、info@risk.netまで電子メールでご連絡ください。
詳細はこちら コメント
How AI agents can join the dots for risk managers
Citi risk expert outlines agentic AI tool that would pull together structured and unstructured data on trading and lending approvals to create single, unified view of risk

オペリスク・データ:企業スパイがBBVAに脅威をもたらす
他にも:BofAがエプスタイン氏との関与疑惑で追及されています。また、少数株主がブルックフィールドに異議を唱えています。データ提供:ORX News

AI政治の台頭
MASの顧問であるデビッド・ハードーン氏は、AIを単なる一つの技術として扱うべきではないと述べています

AIリスク管理と能力制御への移行
リスク管理者によると、検証の枠組みを見直すことで、銀行はイノベーションと規制上の要件を両立させ、強固なリスク管理体制を維持することができます

トークン化された商品市場は、経済の円滑な運営に寄与する可能性がある
暗号資産の専門家は、実物資産をブロックチェーンに移行することで、担保に関する摩擦が緩和されると主張しています

GenAIの時代において、未だに優れたモデルが必要なのはなぜなのか?
ジャン=フィリップ・ブショー氏は、モデルが人工知能をレジームシフトの過程で導き、過学習から遠ざけることができると述べています

取引のスピードがガバナンスを上回る時:一瞬の統制の隙間
デリバティブの専門家によると、光駆動型エレクトロニクスの新たな形態が、市場インフラにおける次のリスクとなる可能性があるとのことです

先物とオプションが示す戦争のコスト
現物価格は大きな混乱を示していますが、先物市場はこれが一時的なものだと示唆しており、オプション市場は不安定な状況が続くと示唆しています