Pre-market trades blamed for record Vix surge
Traders rushed to cover short volatility positions before the market opened on August 5
Need to know
- The Cboe Volatility Index surged 180% in pre-market trading on August 5 – the biggest one-day spike in its 30-year history.
- Market participants say fundamentals alone cannot explain the move and instead point to a series of S&P 500 puts and Vix calls traded in pre-market hours as the real reason for the index going haywire.
- There are competing theories on whether the trades were entered by a market-maker or investor.
- Dealers responded by raising bids and widening their spreads, creating the illusion of heavy hedging demand.
- Analysts at Bank of America describe the Vix spike as a “fragility event” that reveals the extent to which liquidity can evaporate in times of stress.
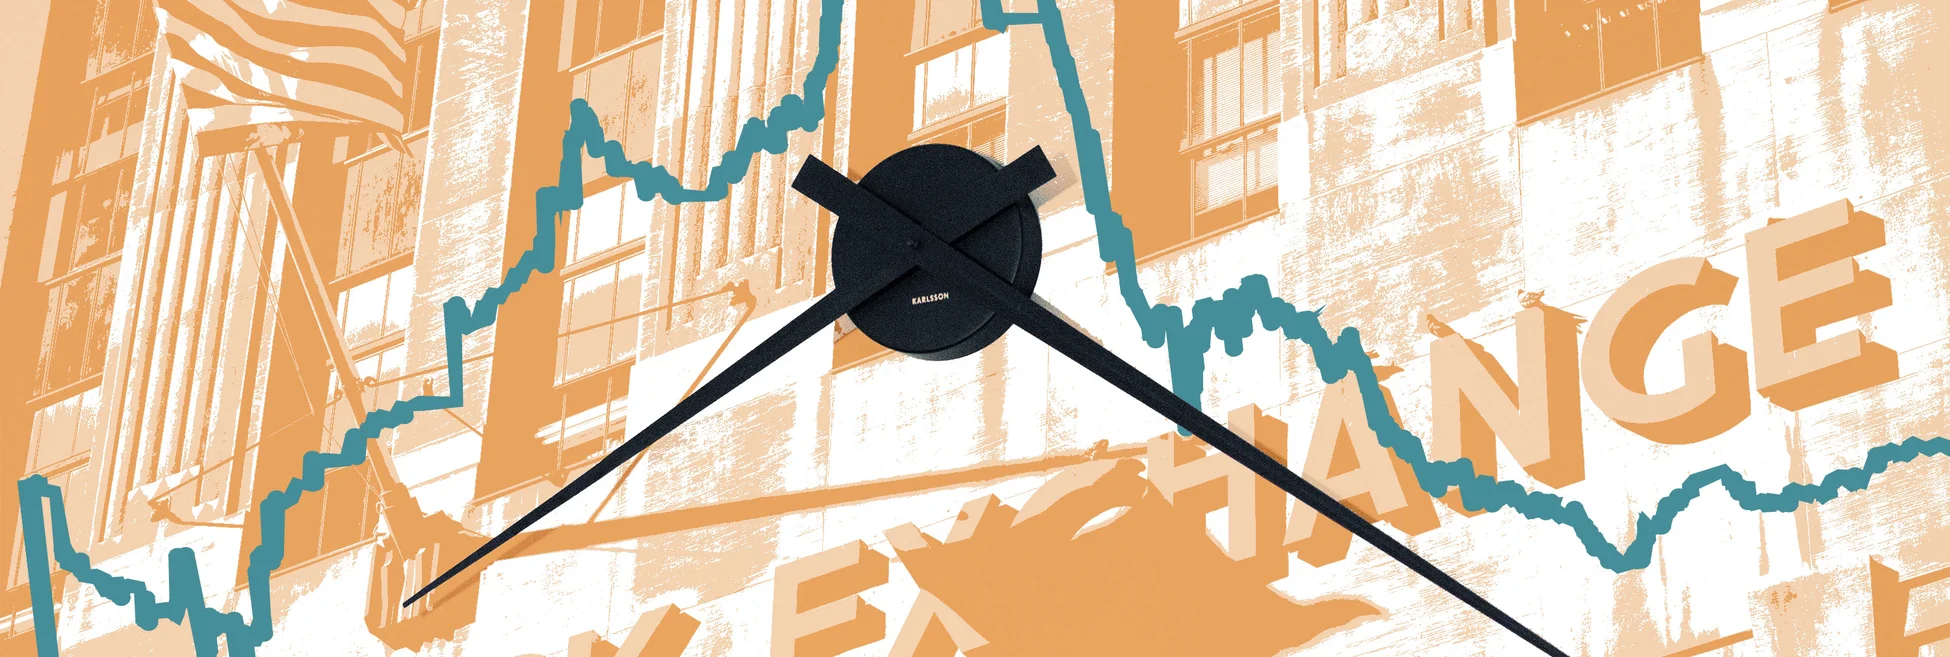
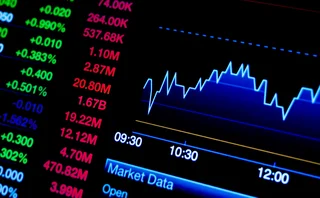
The US equity volatility market witnessed one of its wildest – and arguably weirdest – swings ever on August 5.
The Cboe Volatility Index, a measure of the implied volatility of the S&P 500, surged 180% to an intraday high of 65.7 in pre-market trading that morning – the biggest one-day spike in its 30-year history – before retracing to 38.57 by the close.
The initial explanation was that the market was responding to a combination of macro catalysts: worse-than-expected US jobs data, a surprise rate hike from the Bank of Japan, and rising geopolitical tensions in the Middle East.
But many in the market now argue fundamentals alone cannot explain the intensity of the volatility surge, or why bid/offer spreads for S&P 500 options widened fifty-fold on the day.
“It happened on the back of a very, very small macro catalyst – almost zero real fundamental reason for such a move,” says Alexis Maubourguet, chief investment officer at Adapt Investment Managers.
Options specialists point to a series of unusually large S&P 500 puts and Vix calls traded in pre-market hours, when liquidity is notoriously thin, as the reason for the volatility index surging.
The price action tells us someone got tapped on the shoulder to close that position out
Brent Kochuba, SpotGamma
Analysts at Bank of America note that 9,000 S&P put options expiring on October 18 were traded between 8.20am and 8.35am – just as the volatility benchmark hit its intraday high – which they say “may have been important in pushing the Vix over the finish line to 65”.
Cboe tick data shows a total of 8,683 Vix calls expiring on August 21 with a strike of 30 were purchased around the same time, representing around 20% of the full day’s volume in those contracts.
“That trade was one of the triggers,” says Alon Rosin, head of institutional equity derivatives at Oppenheimer & Co. “It wasn’t the sole trigger, but it would have been a signal as opposed to noise.”
Market-makers monitoring pre-market activity would have seen there was a large buyer of volatility and realised that “whoever sold that would have to go and cover some of their short vol positions”, says Rosin. The natural response would have been to raise bids and widen spreads accordingly, which had a knock-on effect on the Vix calculation.
Market participants still have little idea who was behind the trades, with theories ranging from forced covering by a volatility seller to a market-maker frantically buying protection after seeing Asian markets plunge overnight.
The lesson some take from the episode is that liquidity during periods of market stress is even more fragile than previously thought – and that pre-market prices should be taken with a grain of salt.
“Liquidity, or the lack thereof, played an enormous role in the calculated level of the Vix pre-market on August 5,” says Lester Coyle, chief investment officer at III Capital Management. “While the theoretical value of the Vix computed was correct, it was a number that was arrived at pre-market when there was very little liquidity.”
Another buy-side trader describes the pre-market Vix print as “basically meaningless” given options market were effectively untradeable at the time.
Others say it is a wake-up call that even the slightest whiff of trouble can trigger liquidity-driven price dislocations. “Fragility is extremely high, meaning the market can easily tip over when there’s the slightest pop about some market somewhere,” Amit Deshpande, head of quantitative research at T Rowe Price. “We’re at an extremely finely balanced point right now.”
Forced trade
US equity markets began to wobble shortly after hitting a new all-time high in mid-July, driven by the outperformance of mega-cap tech stocks such as Nvidia and Microsoft.
A streak of 400 trading days without a down-day of more than 2% was snapped on July 24 as investors began rotating out of the mega-cap tech stocks that had powered the S&P 500’s gains up to that point and into small caps ahead of widely anticipated rate cuts.
But the market got a surprise when the Bank of Japan instead hiked rates on July 31, triggering an unwind of popular yen carry trades. US jobs data released two days later, on August 2, came in 35% weaker than expected.
By Monday, August 5, the Nikkei was in freefall – sliding 12.4% in its worst day since 1987 – while the Vix surged above 65 in pre-market trading. The magnitude of the moves caught many in the market by surprise.
“Markets hate it when there are several significant things hitting at the same time, but volatility went well beyond what any of that would point towards,” says Rocky Fishman, founder of independent research firm Asym 500. “We didn’t get that level of volatility when we had clear information on what was happening with Covid. The Vix wasn’t that high the day Lehman blew up. It’s pretty difficult to point to fundamentals.”
Some suggest liquidity – or the lack of it – may have played a bigger role.
The Vix, which measures the 30-day implied volatility of the S&P 500 and is calculated from one-month options prices, begins printing at 3.15am Eastern Time in the US – more than six hours before the stock market opens for trading – with values based on snapshots of bid/offer quotes for S&P 500 options.
Liquidity is always thin at this time. On August 5, it was practically non-existent. According to analysts at Bank of America, the initial bid/offer spread for the S&P 500 option strips underlying the Vix at 3.15am was around 15 to 20 vol points – roughly 50 times wider than the median bid/offer spread of 0.35 in the previous seven months.
The first Vix print at 3.15am on August 5 came in at 42 and steadily ticked up to 50 by around 6.30am. The index moved sideways from there until around 8.00am when it began shooting up to 65, where it remained from 8.30am to 8.40am, before sliding back to 55 by the time US equity markets opened at 9.30am.
The flurry of Vix calls and S&P 500 puts traded between 8.10am and 8.50am could explain why the Vix surged 15 points in a matter of minutes.
JP Morgan analysts counted 22,000 near- and in-the-money Vix calls bought between 8.10am and 8.35am, which they attribute to “forced buying after a misplaced wager that volatility would decline”. The analysts did not specify whether the trades were entered by an investor or a market-maker.
Bank of America analysts, meanwhile, identified 9,000 S&P 500 puts expiring on October 18 traded during the same time window. The first batch of 5,000 contracts with a strike of 4,250 hit the screens at 8.20am, followed by a second clip of 4,000 contracts with a 4,475 strike at 8.35am. The trades, which had a combined notional value of around $4 billion, were marked by the exchange as ‘customer closing buys’, suggesting they were made by an investor covering short positions.
Others point to the almost equivalent number of 30-strike August 21 Vix calls purchased between 8.20am and 8.48. The first trade was priced at $8.50 with the remainder – including a clip of 3,500 contracts bought at 8.32am – going for $9.50.
The 8,683 Vix calls purchased during this 30-minute period represented 20% of the full day’s volume in those contracts, according to Oppenheimer’s Rosin.
If the market had opened and stayed at a 60 vol, things would have been a lot more chaotic
Pete Clarke, UBS
It is unclear who made the trades or if the three sets of transactions are connected.
Rosin’s guess is that the buyer of the Vix calls was a US broker-dealer spooked by the Nikkei’s collapse, or possibly an Asian investor seeking protection against further market declines.
An equity structuring head at a US bank says the culprit was likely a market-maker looking to cover short Vix calls and call spreads before the market opened. “All of a sudden, the Nikkei crashed 12% and they expected vol to spike very quickly, so they jumped on buying futures and options when there was no liquidity,” this person says. “Given their short call or short call spread positioning means they are short gamma, it’s a self-fulfilling event that the more they buy Vix, the higher it gets, and they have to buy even more while the market is not liquid. They have to cover it because it’s quite explosive.”
Another theory – espoused by Brent Kochuba, chief executive of options analytics firm SpotGamma – is that this was a case of forced covering by an investor that was short Vix calls coming into the day.
“It’s a very big trade to do on a Monday morning pre-market, because liquidity is going to be an issue,” says Kochuba. “When you get that much liquidity at a horrible price, all that is a forced trade. If you owned those calls and wanted to get out, you wouldn’t disadvantage yourself. The price action tells us someone got tapped on the shoulder to close that position out. It’s a big trade to do in that way considering they were so deep in-the-money.”
The August 31 Vix calls and October 18 S&P 500 puts would not have directly impacted the level of the Vix, which is calculated using S&P 500 options with more than 23 days and less than 37 days to expiry. But they likely prompted market-makers to widen bid/offers and pull quotes on contracts were used in the Vix calculation.
According to analysts at UBS, average best-bid and best-offer sizes in S&P 500 options ahead of the US open on August 5 were roughly 25% of what might be expected at that time on a typical day. They estimate Vix levels for the three full hours leading up to Monday’s open were calculated using just $1 billion notional of S&P 500 options trades – a tiny fraction of the record $2.3 trillion notional traded across all S&P 500 options over the course of that day.
A buy-side trader confirms options liquidity in those hours was “extremely poor” even by pre-market standards, with often times only “one or two” lots out at any given time.
“Market-makers were not present, and I find that quite disappointing,” the trader says.
Future proof
The market seems quickly to have realised that the pre-market Vix reading was an anomaly and soon resumed normal service. By the official US open, the Vix had fallen to 55 and hit an intraday low of 30.92 around lunchtime before rising to end the day at 38.
“If the market had opened and stayed at a 60 vol, things would have been a lot more chaotic. But in the end, there wasn’t anything like the spot move to justify that degree of vol spike,” says Pete Clarke, global head of equity derivatives strategy at UBS. “It faded in an environment where all of the flow through global desks was monetising of hedges, selling existing puts and initiation of new short put spreads. That came alongside an awful lot of retail buy-the-dip flow.”
There were other clues that the Vix was not a reliable barometer of hedging demand on the morning of August 5. The front month Vix futures contract hit its intraday high of 37.1 at around 2am, when the selloff in Japan was in full swing, and then steadily declined to 33.7 around 8.30am – 32 points lower than the Vix, which was moving in the opposite direction to hit its intraday high of 65. The futures contract was trading between 31.9 and 33.09 an hour later, when the Vix was at 55, and dropped to an intraday low of 26.1 at lunchtime before ending the day around 30 – an eight-point gap to the index
“The swift narrowing is an indication that the initial Vix spot index jump likely overstated the fear and hedging demand among investors,” the analysts wrote in a note published on August 19.
The other bit of good fortune was that dealers had fairly balanced books going into the selloff and avoided trading with the trend to hedge their gamma exposures.
Gamma represents the rate of change in options delta for a single-point move in the underlying. Long gamma positioning means dealers trade against prevailing market moves to hedge their risk. Short-gamma means they must trade with the market, exacerbating violent market moves.
The Vix explosion in 2018 – dubbed ‘volmageddon’ – and the Covid-related selloff of 2020 are prime examples of the havoc that short gamma positioning can wreak in jittery markets.
This time, dealer gamma positioning was long going into the rout and only flipped marginally negative at the peak of the selloff, according to multiple bank analyst reports.
“There was a pocket of mild negative gamma where things got slippery, but you don’t hit that disastrous vortex of gamma until spot goes under 5,000,” says Kochuba. “Below that you’ll see a sustained Vix spike.”
In contrast with 2018, when volatility sellers were wiped out by a 106% surge in the Vix, the quick reversion helped contain losses on this occasion.
Traders at three large banks say there was no major unwinding of popular dispersion trades, where investors sell index volatility to fund a long position in single-stock volatility. These strategies suffered in the initial leg down but most iterations quickly recouped losses.
“This time, there wasn’t one specific pain point. In 2018, this huge vega trade piled up in one instrument that could definitively blow up. This time, there were a bunch of different forms of the short vol trade. Some people are short via puts, some by Vix products and there are a lot of people crossed into Nvidia, semiconductors or big tech versus the S&P. The pain was evenly dispersed across strategies and it was more of a slap on the wrist, as opposed to getting closed out and game over,” says Kochuba.
Trading liquidity is routinely evaporating in times of market stress when investors need it most
Nitin Saksena, Bank of America
The less encouraging news, at least according to some, is that investors have flocked back to short volatility products in response to the Vix spike, meaning a repeat of the volmageddon episode may not be out of the question in the near future. Assets in two of the most popular short volatility exchange-traded products – the ProShares short Vix short-term futures ETF (SVXY) and the Volatility Shares inverse short Vix futures ETF (SVIX) – almost tripled to a combined $1.4 billion in the two weeks following the spike.
“Everyone piled into short vol trades as they feel emboldened in the mean reversion and the idea that this trade generally works. Every time the Vix goes up, if you sell it via ETPs, you make a lot of money. The Pavlovian response is to then double down on subsequent vol spikes. The risk with this is that additional short volatility positions can generate much larger jumps higher in volatility if there is a sustained risk-off move,” says Kochuba.
Other warn that dismissing the Vix spike on August 5 as a purely pre-market phenomenon would be a mistake. “Even if you disregard the pre-open 65 level and just use closing levels, the Vix rose 15-plus points between August 2 and August 5, on a 3% S&P decline,” says Nitin Saksena, head of equity derivatives strategy at Bank of America. “That’s a beta of five, which is the highest on record based on data since 1990.”
Saksena views the Vix spike as a “fragility event” that reveals the extent to which liquidity in equity and volatility markets can disappear in times of stress. “Trading liquidity is routinely evaporating in times of market stress when investors need it most,” he says.
Adapt’s Maubourguet is also concerned that markets seem incapable of handling even the slightest of shocks without becoming dislocated.
“Liquidity is fickle,” he says. “Market-makers are extremely talented at giving the appearance of liquidity, but you should expect that they disappear when things turn stressful, or they at least pull back.”
On August 5, all the market needed “was a very, very small impetus to trigger something pretty huge,” Maubourguet adds.
SpotGamma’s Kochuba agrees markets may be suffering from “an illusion of liquidity.”
“People feel good about the market position right now because we rallied back and volatility immediately mean reverted, which always happens over time. But the market structure showed us that the next time there’s a decent amount of fear in the market – a trigger – there’s not going to be a lot of liquidity to support the market.”
Editing by Kris Devasabai
Only users who have a paid subscription or are part of a corporate subscription are able to print or copy content.
To access these options, along with all other subscription benefits, please contact info@risk.net or view our subscription options here: http://subscriptions.risk.net/subscribe
You are currently unable to print this content. Please contact info@risk.net to find out more.
You are currently unable to copy this content. Please contact info@risk.net to find out more.
Copyright Infopro Digital Limited. All rights reserved.
As outlined in our terms and conditions, https://www.infopro-digital.com/terms-and-conditions/subscriptions/ (point 2.4), printing is limited to a single copy.
If you would like to purchase additional rights please email info@risk.net
Copyright Infopro Digital Limited. All rights reserved.
You may share this content using our article tools. As outlined in our terms and conditions, https://www.infopro-digital.com/terms-and-conditions/subscriptions/ (clause 2.4), an Authorised User may only make one copy of the materials for their own personal use. You must also comply with the restrictions in clause 2.5.
If you would like to purchase additional rights please email info@risk.net
More on Markets
PBoC reserve ratio cut spurs short-term FX hedging
Removal of 20% forex risk rule drives exporters toward options and onshore forwards
Inflation shock upends Aussie dollar rates flatteners
Hedge funds’ front-end curve trades stopped out as Iran conflict drove RBA terminal rate pricing higher
Digital asset risk: ICR for tokenised fund infrastructure
The market context for TMFs, the drivers of TMF adoption, layers of the ICR architecture, stakeholder exposures and regulatory developments
What futures and options say about the cost of war
Spot prices reveal major disruption, futures indicate this will pass, options imply ongoing instability
A Hormuz tipping point may be days away
Agent-based model suggests delays and shortages likely to accelerate after four weeks
Ellington spinout hopes to ease whole-loan investing
Data hurdles have frustrated insurers as they look to increase allocations
SRT deals shelved amid Iran and AI concerns
Simple and risk-reducing deals prioritised as growing fears disrupt synthetic risk-transfer pipeline
Osttra hires four from LSEG as post-trade battle heats up
SwapAgent head Nathan Ondyak returns to Osttra following KKR acquisition