
Monthly credit data review: new-tech scepticism
David Carruthers of Credit Benchmark looks at the most recent trends in bank-sourced credit data


It’s been a rocky year for gig economy poster child Uber. The company is accused of overcharging its customers, has admitted to underpaying some drivers, and in some countries faces growing political scrutiny of its business model.
The company’s lenders have always seen it as a non-investment grade credit, but over the past six months, average in-house risk estimates have the company slipping from bb– to b+ (see box, About this data).
Banks also take a relatively dim view of other new-tech companies. Fitbit, the wireless exercise-monitoring company that had its initial public offering (IPO) in 2015, is rated b+ as well. Dropbox is rated b. Airbnb and Groupon are rated a little higher at bb–. The average rating for these firms has been static over the past six months.
Other tech firms have improved over the period, with Yahoo the biggest mover – jumping three grades from bb– to bbb–. LinkedIn has climbed from bbb– to bbb+, with Alphabet, Amazon and Facebook all moving a single grade to aa, a+ and a, respectively.
Among other findings, this month’s round-up of bank credit risk estimates reveals a sudden worsening of the outlook for corporates in the industrials sector: having been balanced last month, there were almost twice as many downgrades as upgrades in April.
Global credit industry trends
Figure 1 shows industry migration trends for the most recent -published data.
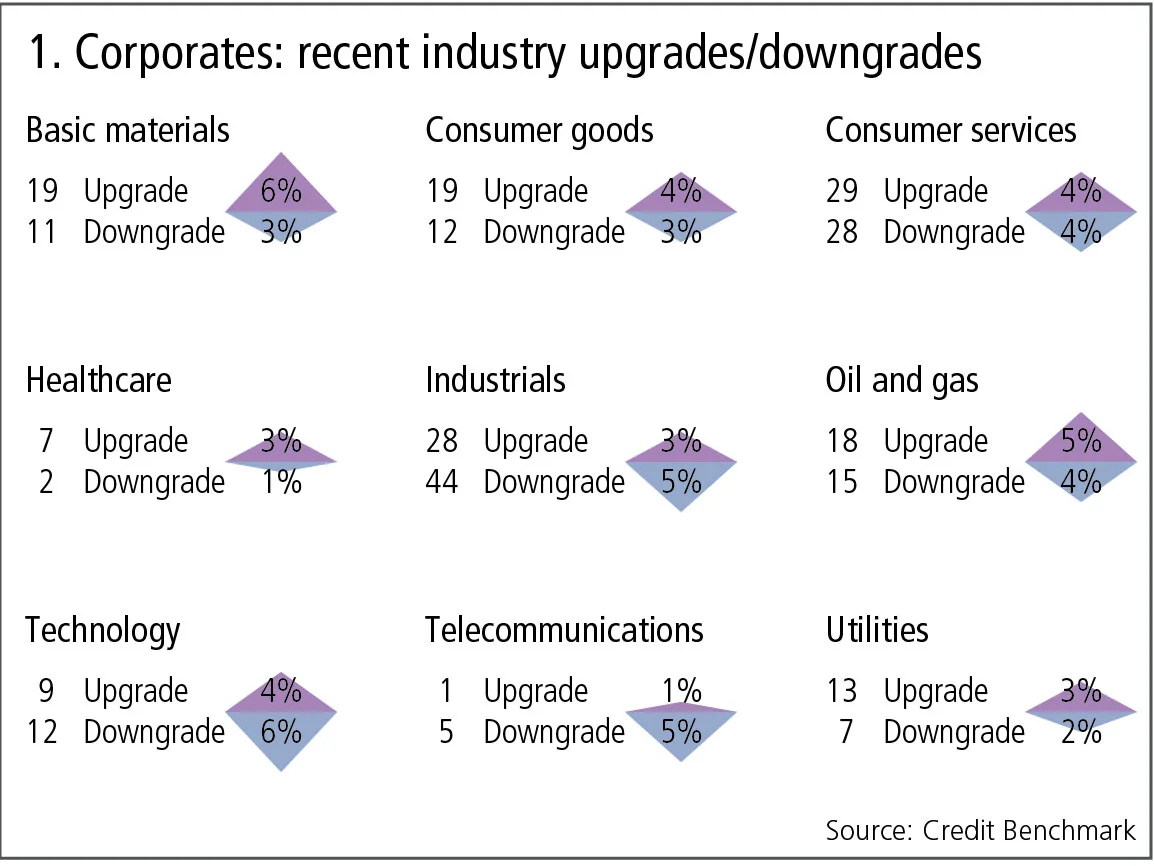
Figure 1 shows:
- Global corporate upgrades slightly outnumber downgrades, but are more balanced than last month, especially in oil and gas, where upgrades have ticked up.
- Basic materials continues to show a large imbalance with upgrades outnumbering downgrades by 19 against 11.
- Industrials are a major exception, with 44 downgrades against 28 upgrades; last month these were balanced.
Credit transition matrices
Looking at longer-term trends, the one-year credit transition matrices for global oil and gas vs global basic materials are shown in Table A. These are based on 3,676 and 6,508 obligors, respectively.
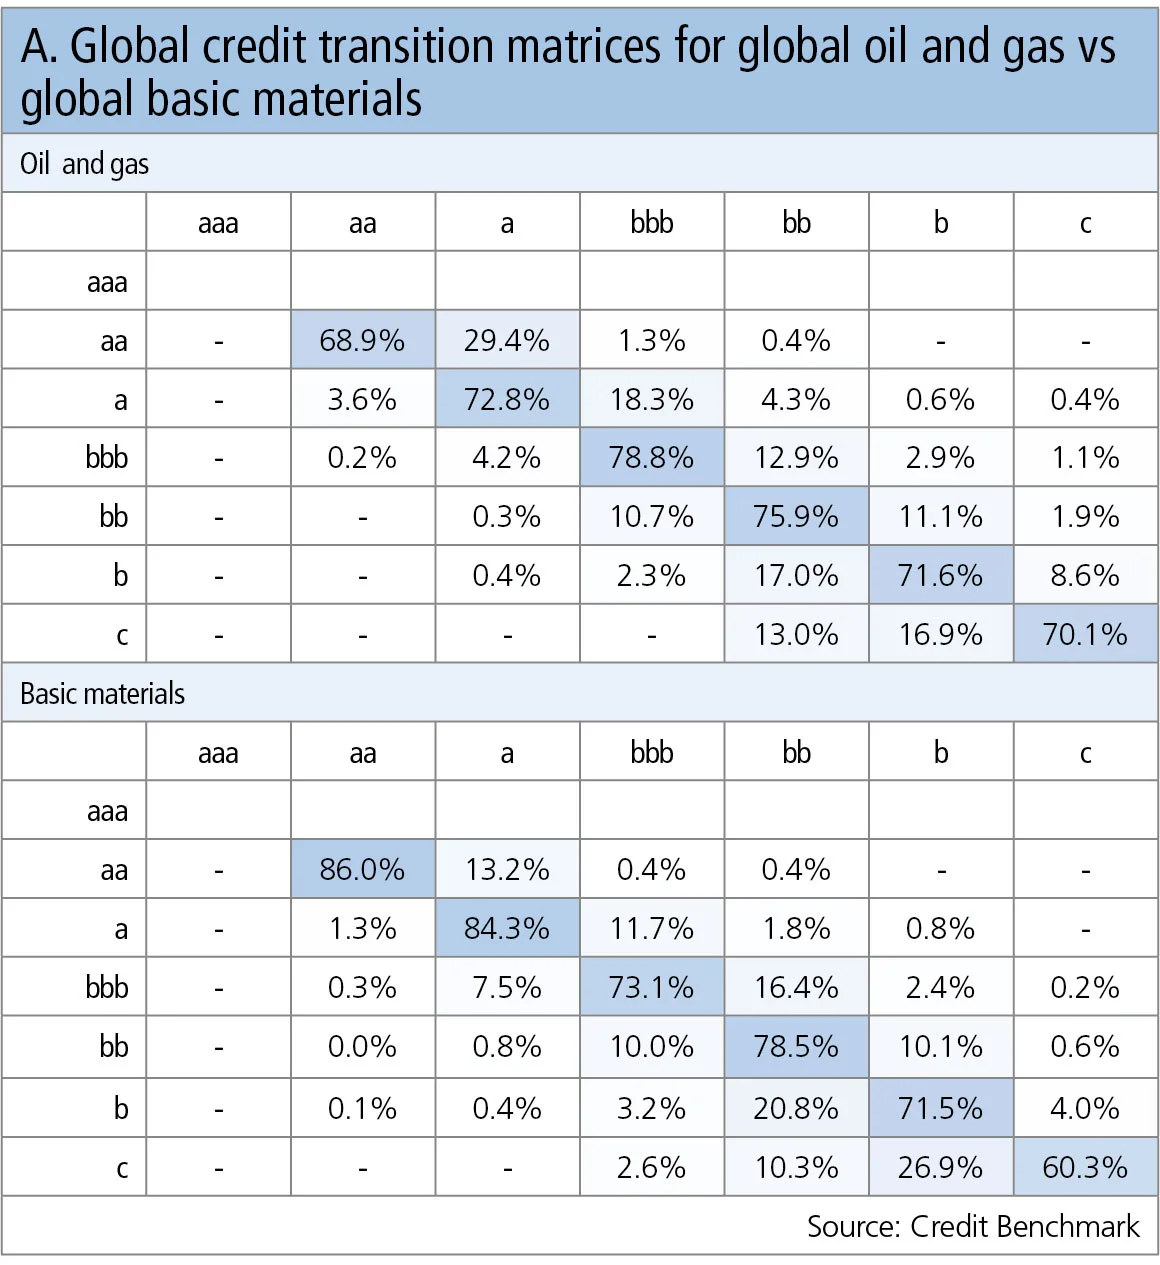
Table A shows:
- Compared with basic materials, the one-year trend in oil and gas is towards downgrades, especially in the investment-grade names.
- For oil and gas, the average upper-right triangle value is about 1.5x that of the lower-left triangle. For basic materials, the position is reversed; the lower-left average values are about 1.3x those of the upper right. These ratios give some indication of the credit cycle progress in each industry.
- It is worth noting that the matrices are based on changes in through-the-cycle/hybrid probability of default estimates. It is also possible to perturb these matrices – conditioned on, for example, the Vix index, or credit spreads – to derive a point-in-time credit transition matrix that is consistent with these observed macro variables.
Oil and gas credit distribution
Oil and gas is back on the radar with a price ‘flash crash’ in early May and renewed attempts by the Organization of the Petroleum Exporting Countries to control production, despite the growing role of US shale oil as an alternative source of swing supply.
Figure 2 shows the current distribution of corporate credit risk for the oil and gas industry, with the overall distribution for global corporates plotted for comparison.
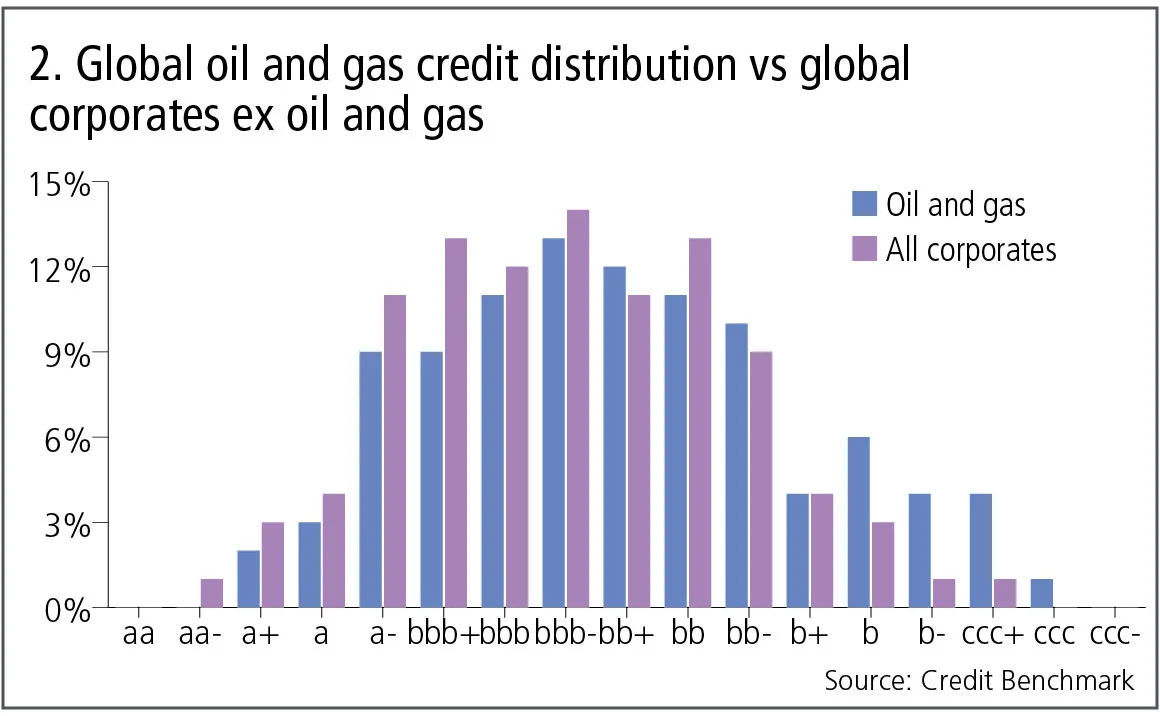
Figure 2 shows:
- The oil and gas industry is showing the credit impact of the past few years of oversupply and price weakness. The proportion of oil and gas companies in the b, b– and ccc+ credit categories is more than twice as high as for all global corporates.
- But many oil and gas companies have weathered the difficult trading conditions of the past few years. The proportion of companies in the bbb and bb categories (including the + and – subcategories) is very similar to that of all global corporates.
Technology companies
The six-month trends for a number of high-profile technology companies are given in Figure 3.
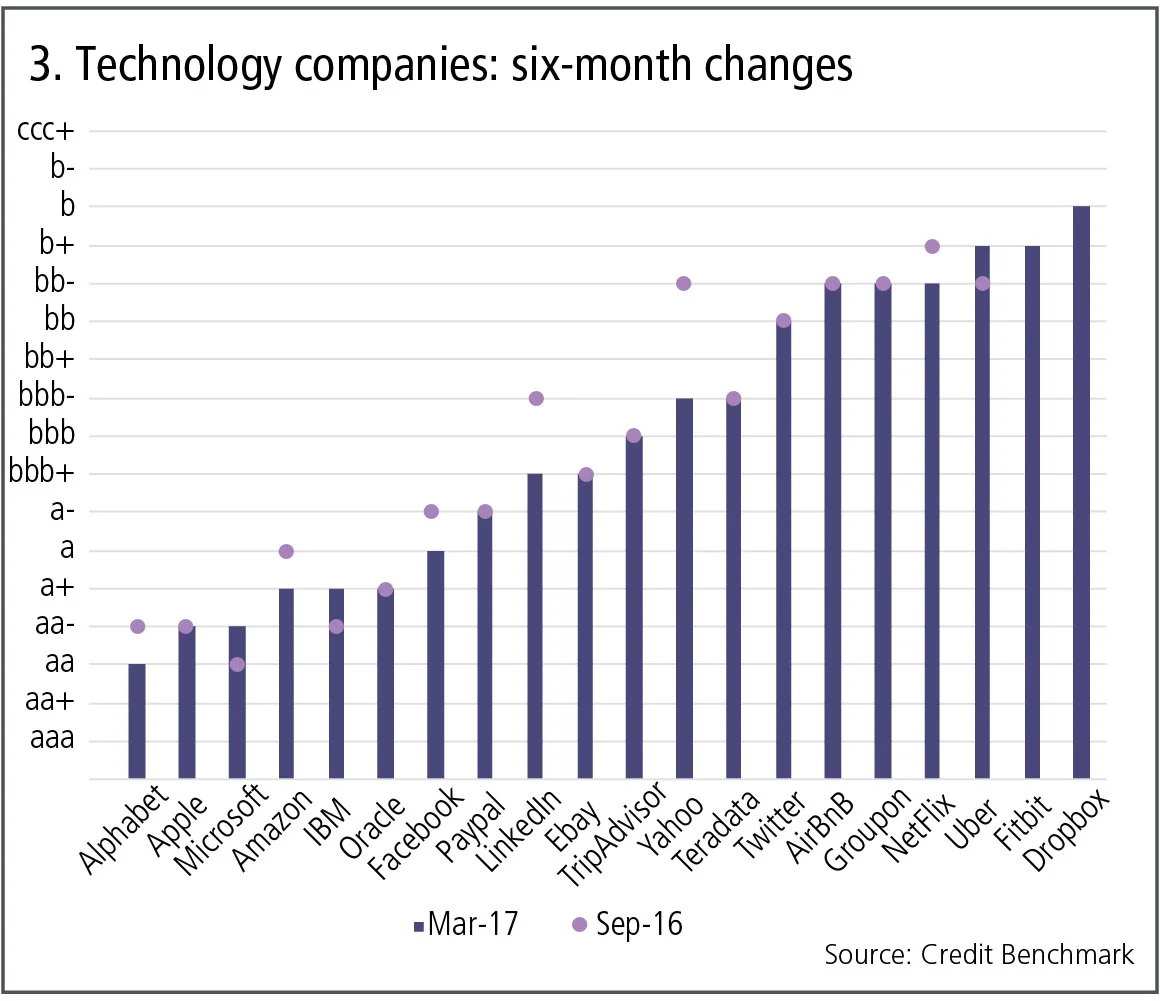
Figure 3 shows:
- The consensus credit views for Microsoft and IBM have been downgraded over the past six months.
- Alphabet and Amazon have improved, as have Yahoo and recent Microsoft acquisition LinkedIn.
- Uber has always been viewed by banks as non-investment grade but it has recently slipped further from bb– to b+, coinciding with a wave of negative publicity over the past few months.
- Banks have a sceptical view of some of the other new-tech companies. For example, Fitbit is currently viewed as b+. Dropbox is yet to IPO but is currently viewed as b–.
Marine transportation
Figure 4 shows recent credit trends in marine transportation. This portfolio benchmark series uses a similar approach to Markit’s popular iTraxx indexes, with a series of fixed baskets that are reset every six months, with the focus on the most active obligors – ie, those that are currently quorate.
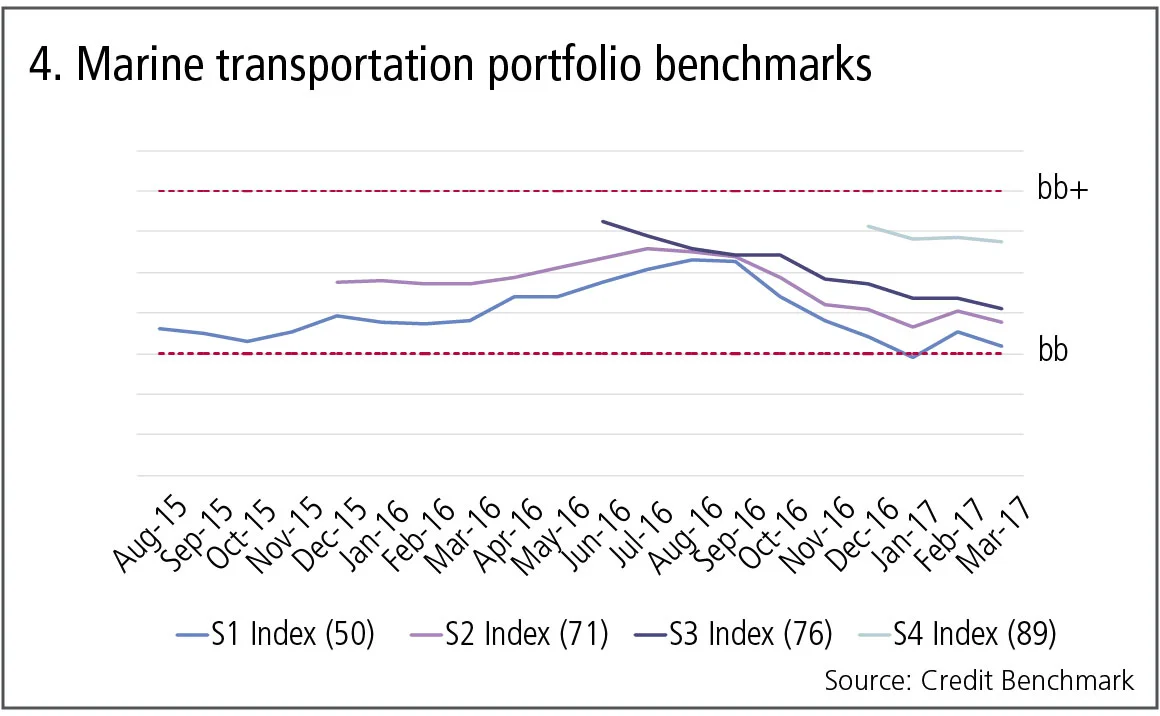
Figure 4 shows:
- A range of baskets used to track credit risk in the marine transportation sector show credit risk has typically been in the range bb to bb+. The legend shows the number of obligors in each basket.
- Credit risk improved in the first half of last year but has recently been increasing.
- The latest sample of obligors is of higher quality. If the credit environment in this sector is generally deteriorating, it is possible banks are focusing new loan activity on the higher-quality names within the sector.
About this data
The Credit Benchmark dataset is based on internally modelled credit ratings from a pool of 13 contributor banks. These are mapped into a standardised 21-bucket ratings scale, so downgrades and upgrades can be tracked on a monthly basis. Obligors are only included where ratings have been contributed by at least three different banks, yielding a total dataset of more than 8,000 names, which is growing by 5% per month.
Only users who have a paid subscription or are part of a corporate subscription are able to print or copy content.
To access these options, along with all other subscription benefits, please contact info@risk.net or view our subscription options here: http://subscriptions.risk.net/subscribe
You are currently unable to print this content. Please contact info@risk.net to find out more.
You are currently unable to copy this content. Please contact info@risk.net to find out more.
Copyright Infopro Digital Limited. All rights reserved.
As outlined in our terms and conditions, https://www.infopro-digital.com/terms-and-conditions/subscriptions/ (point 2.4), printing is limited to a single copy.
If you would like to purchase additional rights please email info@risk.net
Copyright Infopro Digital Limited. All rights reserved.
You may share this content using our article tools. As outlined in our terms and conditions, https://www.infopro-digital.com/terms-and-conditions/subscriptions/ (clause 2.4), an Authorised User may only make one copy of the materials for their own personal use. You must also comply with the restrictions in clause 2.5.
If you would like to purchase additional rights please email info@risk.net
More on Comment
Why do prices jump?
After years of investigation, we still aren’t sure, says Jean-Philippe Bouchaud

Don’t mind the gap risk: regulatory treatment of credit repacks
Gap risk in repackaging is not a credit valuation adjustment for Basel III capital purposes, argues senior quant Andrey Chirikhin

Op risk data: HSBC hit with $400m external fraud loss
Also: China’s unlicensed trading clampdown; SocGen’s insurance mis-selling woes. Data by ORX News

Vinicius fortune: quantifying luck in the World Cup draw
Julien Guyon explains how bias, variance and luck affect teams in this summer’s tournament – and explores wider relevance for portfolio managers

G-Sib capital surcharge: how indexing and averaging alter incentives
Capital risk strategist anticipates Basel III endgame impact on US big-bank behaviour

Podcast: Abi-Jaber and Li on a ‘sticky’ volatility problem
The pair discuss their model to jointly capture Vix, SPX and SSR

Markets perceive the future in very distorted ways
Discounting paradigms should adapt to be more realistic, says Jean-Philippe Bouchaud

Op risk data: Cyber hacks shake crypto protocols
Also: JP Morgan fined over investor losses; Symetra’s Methodist pensions mess. Data by ORX News
