
Monthly credit data review: gloomier than spreads suggest
David Carruthers of Credit Benchmark looks at banks’ credit risk data

Credit risk data is widely available for sovereigns and large corporates, but updates are infrequent and smaller companies are often ignored. In this series of monthly articles, David Carruthers, head of research at Credit Benchmark, discusses monthly credit risk trends in rated and unrated obligors based on bank-sourced data.
The first-quarter rally in equity markets was accompanied by a narrowing in high-yield credit spreads, but market measures of credit risk can be distorted by liquidity and technical factors. Banks’ own measures of credit risk offer a different – and clearer – picture of the underlying trend.
The Credit Benchmark dataset is based on internally modelled credit ratings from a pool of 13 contributor banks. These are mapped into a standardised 21-bucket ratings scale, so downgrades and upgrades can be tracked on a monthly basis. Obligors are only included where ratings have been contributed by at least three different banks, yielding a total dataset of more than 8,000 names.
The data for February is mixed, but in general is slightly more pessimistic than credit spread trends would imply. One-year default probabilities for both investment-grade (IG) and non-investment-grade (NIG) names rose in February, for example; over the past six months, corporate as well as financial obligors have migrated down the ratings scale, with downgrades heavily outnumbering upgrades by almost two to one.
By sector, downward migration is most pronounced for oil and gas and utilities names – eight upgrades are accompanied by 20 downgrades for the former, and three upgrades versus 12 downgrades for the latter.
There are some more optimistic signs, though. Financial downgrades are slowing; the February data even includes a small number of aaa-rated financials. Among corporates, the picture varies by sector, with downgrades and upgrades more or less in balance among consumer services and industrial obligors.
Global credit trends
Figure 1 shows trends for the most recent six months of published data. The IF series is based on a fixed sample of 3,470 corporate obligors and the NIG series is based on a fixed sample of 1,475 corporate obligors. Of the two, the IG credit trend has been more stable.
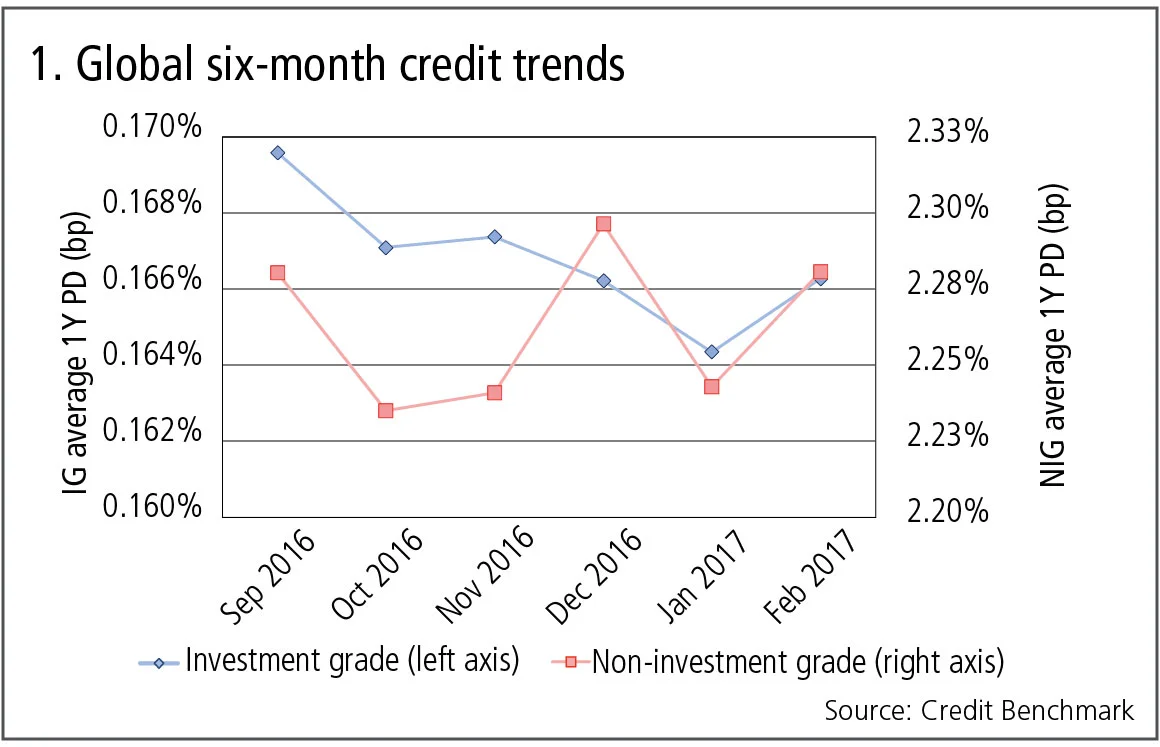
Figure 1 shows:
- The trend decline in investment grade credit risk over recent months reversed in February; the current one-year average default probability is 16.6 basis points per annum.
- Non-investment grade credit risk has been more volatile, but also turned up in February. The current one-year average credit risk is 228bp per annum.
Corporate credit distributions
The distribution of corporate credit risk now and six months ago is shown in figure 2.
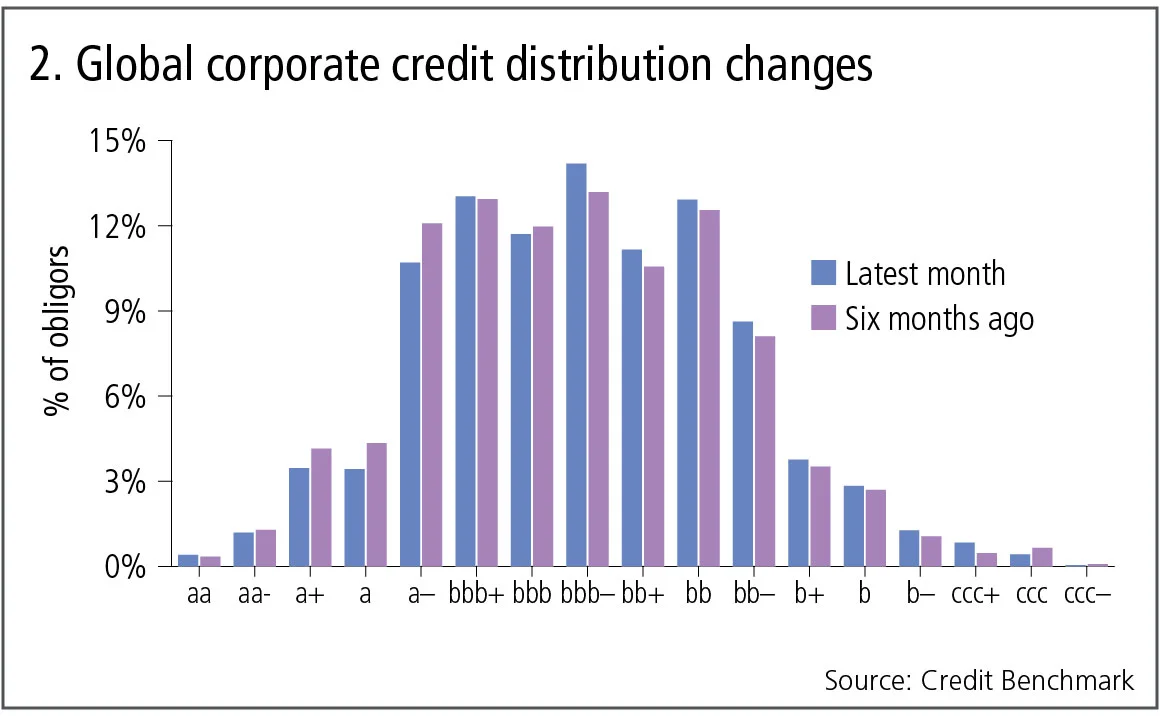
Figure 2 shows:
- The main six-month changes are small reductions in the proportion of names in the higher-quality credit categories and an increase in those in the middle categories, on the boundary between investment grade and non-investment grade.
- The credit distribution of corporate obligors is widely dispersed, with bbb- as the largest category, accounting for about 14% of all obligors.
- The published dataset does not include any corporates in the aaa or aa+ categories.
Financial credit distributions
The distribution of financial credit risk now and six months ago is shown in figure 3.
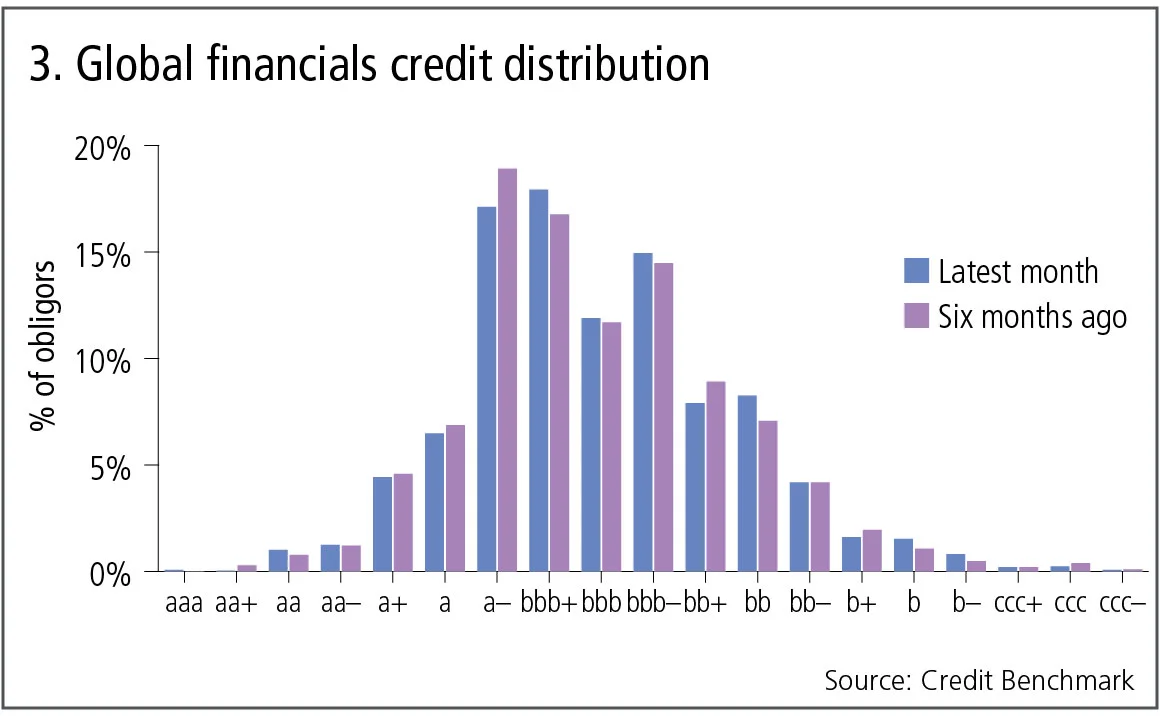
Figure 3 shows:
- The main six-month changes are small reductions in the proportion of names in the a- credit categories and an increase in those in the bbb+ and bbb- categories.
- The credit distribution of financial obligors shows less dispersal than for corporates, with bbb+ as the largest category, accounting for about 17% of all obligors.
- The most recent dataset now includes a small number of financials in the aaa category, including government-owned KFW BankenGruppe.
Corporates and financials: upgrades and downgrades
Figure 4 shows the frequency of upgrades and downgrades for the most recent month as well as for the previous 12 months.
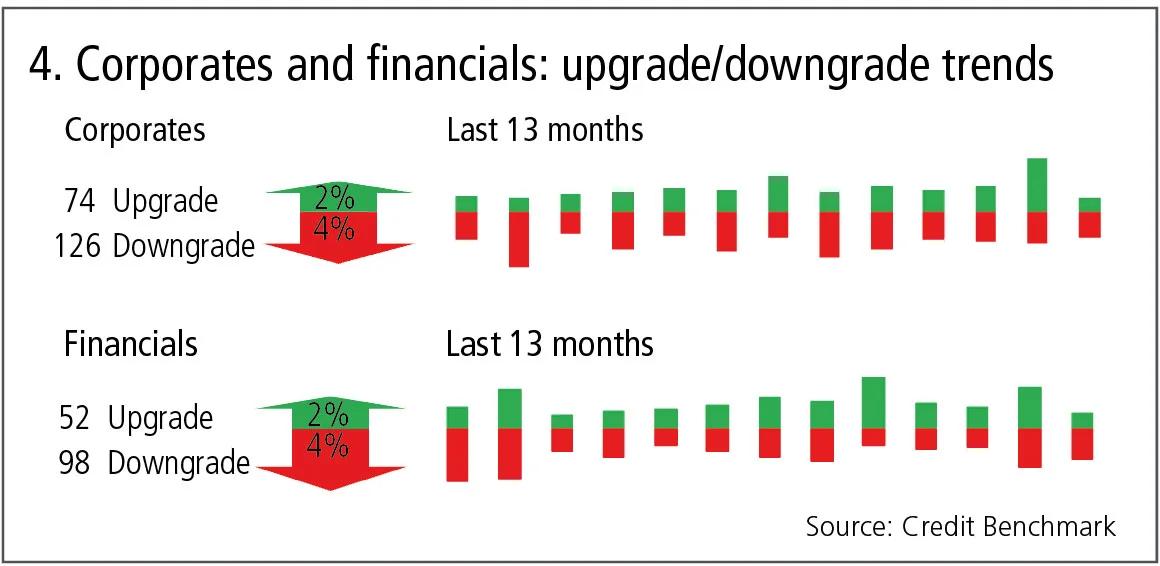
Figure 4 shows:
- Recent global corporate downgrades outnumber upgrades by a significant margin (126 versus 74).
- Financials show a similar pattern to corporates, with downgrades outnumbering upgrades by almost two to one (98 versus 52).
- However, financials show a clear trend towards fewer downgrades over time, whereas for corporates, the downgrade trend is more mixed. The pattern of upgrades is more volatile for both categories.
Industry upgrades and downgrades
Figure 5 shows the frequency of upgrades and downgrades for the most recent month across the main industries.

Figure 5 shows:
- In a reversal of recent trends, downgrades tend to outnumber upgrades over the past month.
- The exceptions are consumer services and industrials, with upgrades and downgrades more or less in balance.
- Oil and gas and utilities show the largest imbalances, with downgrades outnumbering upgrades by around three to one.
Only users who have a paid subscription or are part of a corporate subscription are able to print or copy content.
To access these options, along with all other subscription benefits, please contact info@risk.net or view our subscription options here: http://subscriptions.risk.net/subscribe
You are currently unable to print this content. Please contact info@risk.net to find out more.
You are currently unable to copy this content. Please contact info@risk.net to find out more.
Copyright Infopro Digital Limited. All rights reserved.
As outlined in our terms and conditions, https://www.infopro-digital.com/terms-and-conditions/subscriptions/ (point 2.4), printing is limited to a single copy.
If you would like to purchase additional rights please email info@risk.net
Copyright Infopro Digital Limited. All rights reserved.
You may share this content using our article tools. As outlined in our terms and conditions, https://www.infopro-digital.com/terms-and-conditions/subscriptions/ (clause 2.4), an Authorised User may only make one copy of the materials for their own personal use. You must also comply with the restrictions in clause 2.5.
If you would like to purchase additional rights please email info@risk.net
More on Comment
Why do prices jump?
After years of investigation, we still aren’t sure, says Jean-Philippe Bouchaud

Don’t mind the gap risk: regulatory treatment of credit repacks
Gap risk in repackaging is not a credit valuation adjustment for Basel III capital purposes, argues senior quant Andrey Chirikhin

Op risk data: HSBC hit with $400m external fraud loss
Also: China’s unlicensed trading clampdown; SocGen’s insurance mis-selling woes. Data by ORX News

Vinicius fortune: quantifying luck in the World Cup draw
Julien Guyon explains how bias, variance and luck affect teams in this summer’s tournament – and explores wider relevance for portfolio managers

G-Sib capital surcharge: how indexing and averaging alter incentives
Capital risk strategist anticipates Basel III endgame impact on US big-bank behaviour

Podcast: Abi-Jaber and Li on a ‘sticky’ volatility problem
The pair discuss their model to jointly capture Vix, SPX and SSR

Markets perceive the future in very distorted ways
Discounting paradigms should adapt to be more realistic, says Jean-Philippe Bouchaud

Op risk data: Cyber hacks shake crypto protocols
Also: JP Morgan fined over investor losses; Symetra’s Methodist pensions mess. Data by ORX News
