Monthly swaps data review: credit volumes peak in June
Global cleared credit derivatives volumes reached $1 trillion before ebbing in July

Cumulative volume of $3.5 trillion gross notional in global cleared credit derivatives over the April-July period peaked in June, with Ice capturing more than 90% of the business. This is a smaller market than the interest rate swap market, which was the main subject of my previous articles, but it is still significant in terms of volumes.
Global cleared volumes
Eighty-six per cent of global monthly cleared volumes was represented by credit default swap index (CDX). Let’s start with a chart breaking out CDX and single-name credit default swaps (CDS) by clearing house.
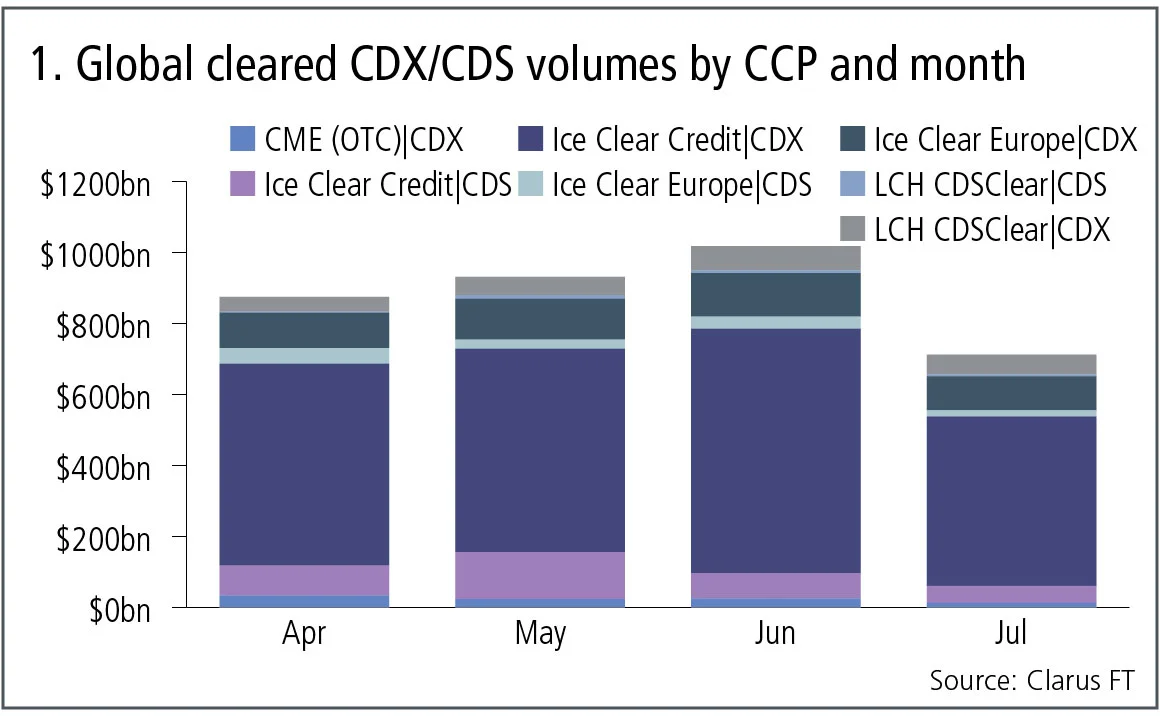
Figure 1 shows:
- Cumulative volume of $3.5 trillion gross notional in the past four months, of which the majority is CDS index ($3 trillion), and monthly volume ranging from $700 billion to $1 trillion.
- June 2017 was the highest month and July the lowest in the four-month period.
- Ice Clear Credit is by far the largest clearing house and CDX the largest product at Ice, with volume between $475–687 billion a month.
- Single-name CDS volumes at Ice Clear Credit are $48–132 billion a month.
- Ice Clear Credit represents 75% of the cumulative volume over the four-month period.
- Ice Clear Europe is the next largest and represents 16% of the cumulative volume, with monthly CDX volume of $96–123 billion and CDS volume of $18–45 billion.
- The combined share of the two Ice entities is 91% of cumulative volume.
- LCH CDSClear is the next largest with 7% market share, with CDX monthly volumes of $42–70 billion and CDS volumes of $4–11 billion.
- CME has 3% market share with CDX monthly volumes of $13–33 billion and no CDS volumes.
While these figures are much smaller than interest rate swaps where monthly volumes are $20–30 trillion, they are substantial in that almost $1 trillion gross notional is transacted and cleared each month.
Product types
Now let’s look at the same figures, but split by product type to see which types of contracts are the most traded.
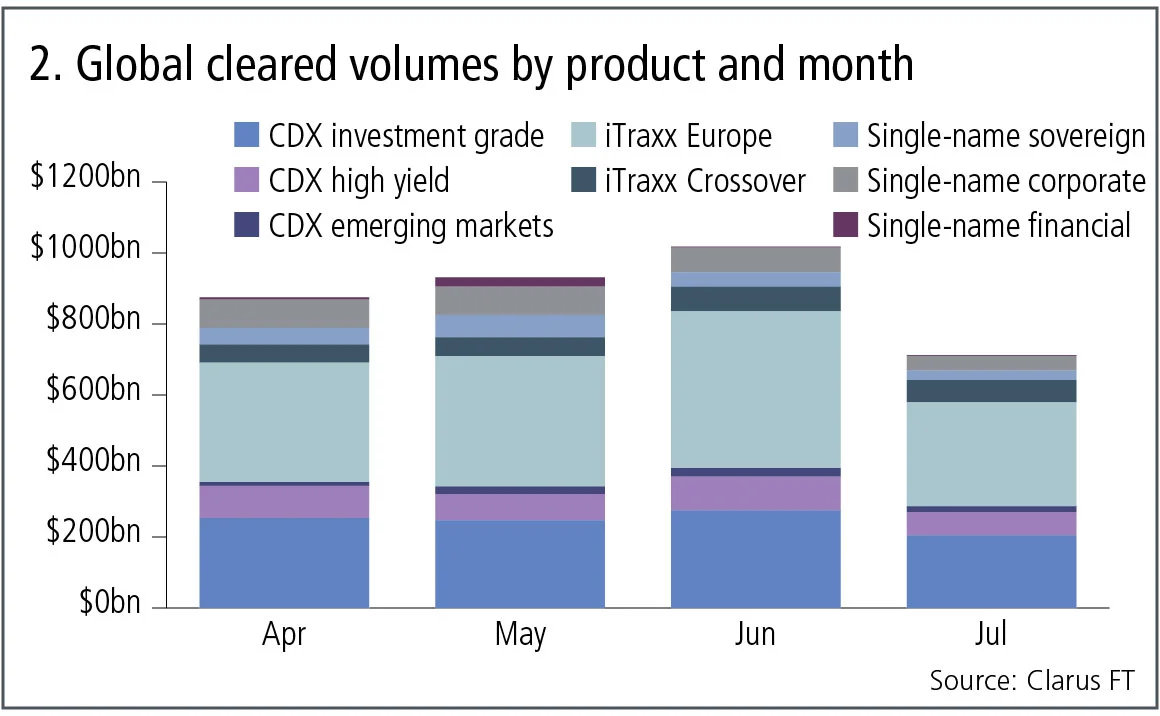
Figure 2 shows:
- iTraxx Europe is the largest product and represents 41% of the overall volume in this period with monthly volumes between $330–440 billion.
- CDX investment grade is the next largest product and represents 28% of the overall volume in this period with monthly volumes between $200–275 billion.
- CDX high-yield follows with a 9% share and monthly volumes of $65–95 billion.
- Single-name on corporates has 8% and monthly volumes of $40–80 billion, showing how much the single-name market is cleared, compared with the index market.
- Single-name on sovereigns represents 5% and single-name on financials represents 1% of the volume over this period.
- CDX emerging markets is 2% of the volume with $11–25 billion a month.
Swap execution facilities
Swap execution facilities (Sefs) are trading venues mandated for a subset of the cleared CDS index products executed by US-regulated market participants. They are required to publish daily volumes. However, single-name CDS do not fall under this regime, as they are regulated by the Securities and Exchange Commission, not the Commodity Futures Trading Commission.
Let’s look at monthly volumes over the same period for CDS index products.
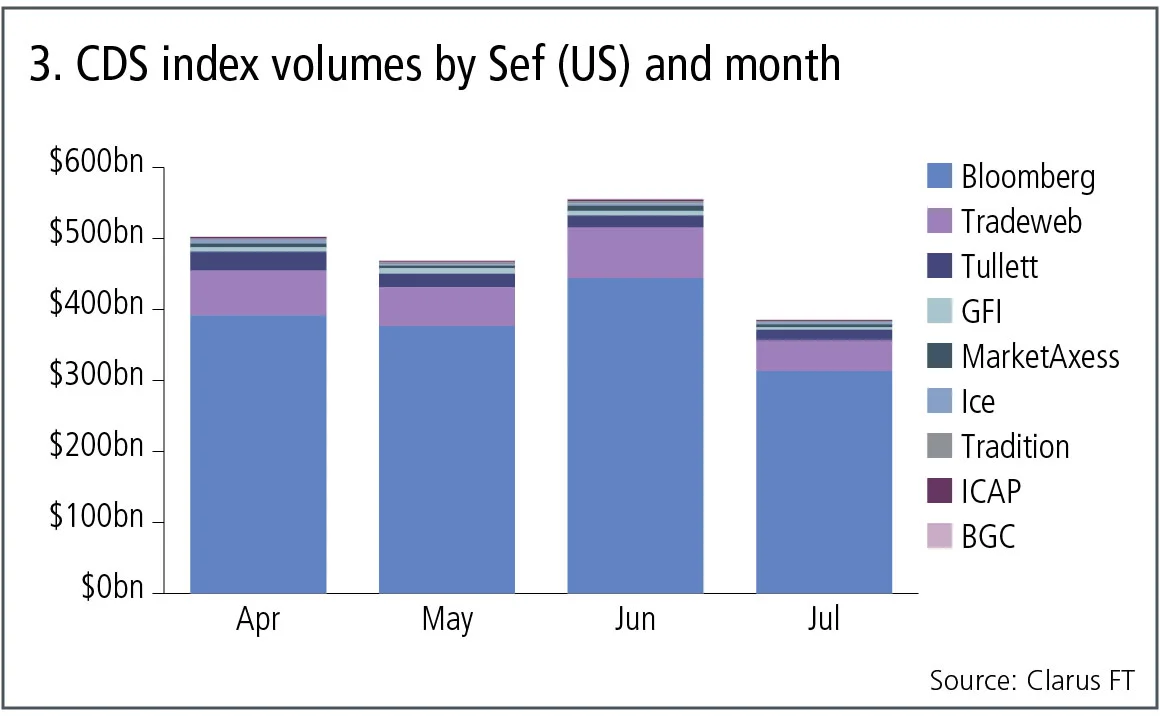
Figure 3 shows:
- Cumulative gross notional of $1.9 trillion over the four-month period, compared with the $3 trillion we saw in global cleared volumes, so representing 60% of the overall market.
- Bloomberg is by far the largest Sef, with 80% market share and monthly volumes between $300–450 billion.
- Tradeweb is the next largest with 12% share and monthly volumes between $40–70 billion.
- Tullett has a 4% share with monthly volumes between $15–30 billion.
- The remaining Sefs each have a 1% or smaller share.
Bloomberg’s dominance of trading of CDX mirrors the dominance of Ice in clearing of this asset class.
Option products
In addition to the above cleared products, there are two types of bilateral (uncleared) products that are commonly traded; options on indexes and tranches in indexes. Let’s look at the Sef reported volumes of options.
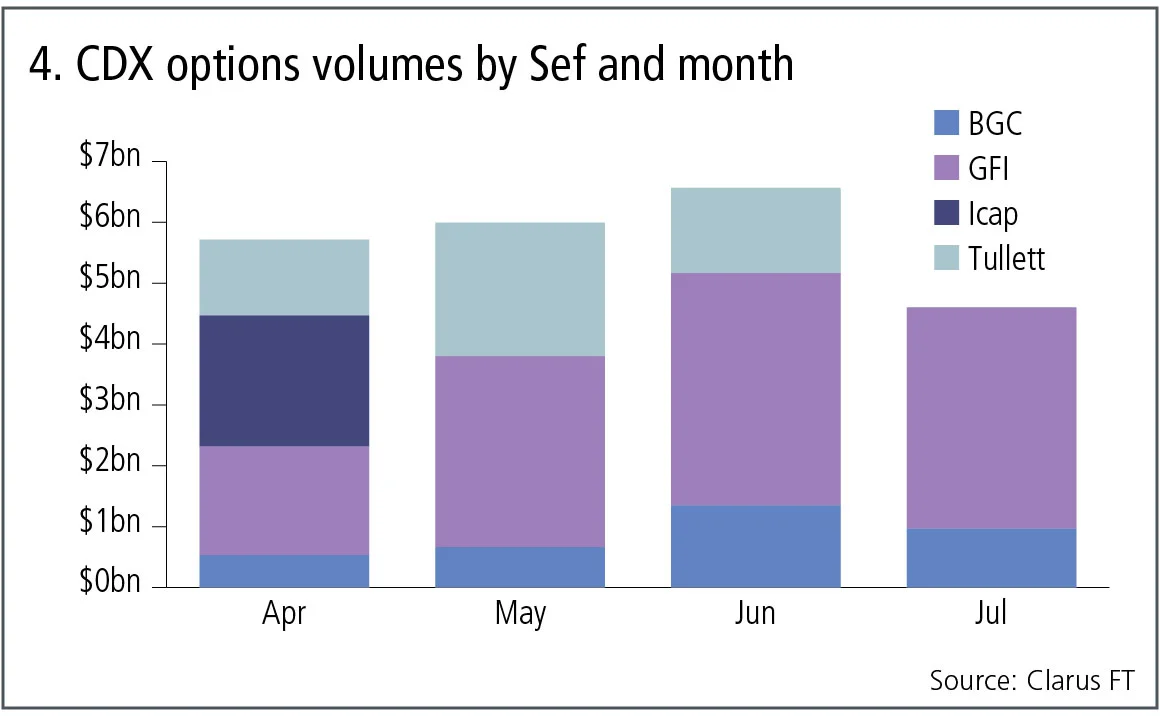
Figure 4 shows:
- Cumulative gross notional of $23 billion over the four-month period, compared with the $1.9 trillion in CDS index.
- GFI is the largest Sef with a 54% share and monthly volumes of $2–4 billion.
- Tullett is the next largest with a 21% share, followed by BGC with 15% and Icap with 9%.
So this not a huge market, but one that is active with transactions on most business days. Tranche index, however, shows very thin trading on Sefs with only $450 million reported in the four-month period, of which $380 million was at GFI.
Trade executions
A final chart before we end. Using swap data repository data we can isolate the prices of trades for a specific contract on a given business day. Let’s do so for CDX North American Investment Grade S28 (CDX.NA.IG.S28).
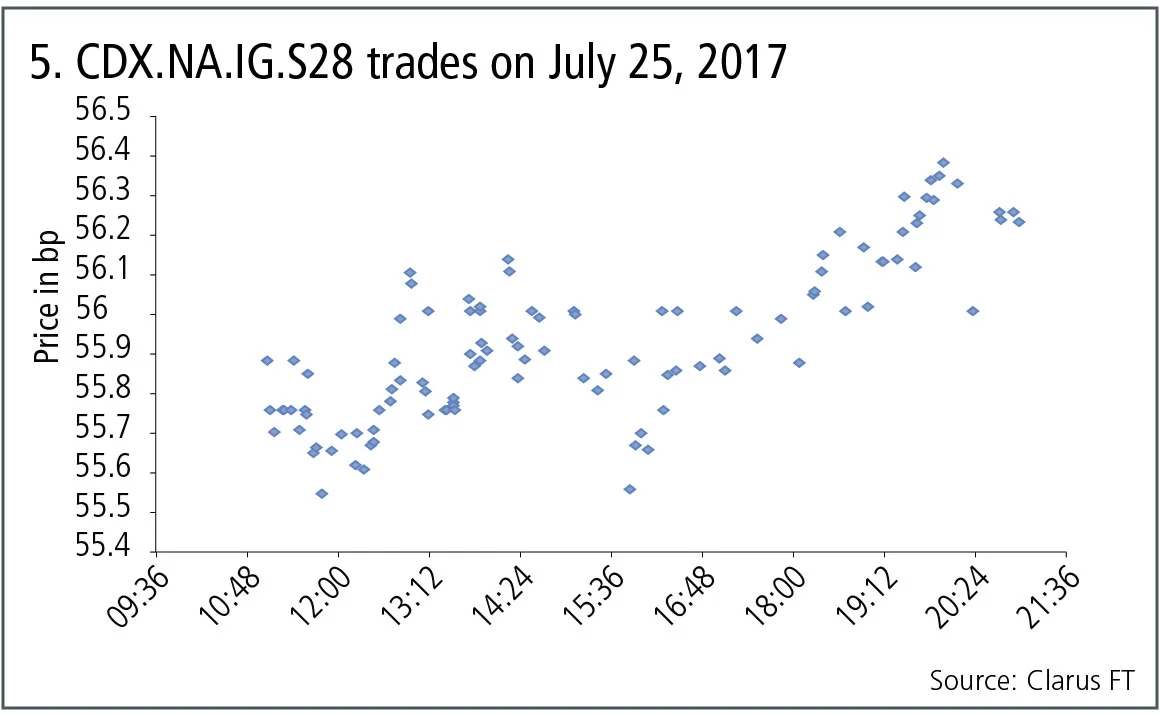
Figure 5 shows:
- The prices and times of trades executed between 11:00 universal time (UTC) and 21:00 UTC.
- 107 trades in total.
- Prices starting at 55.75 basis points and rising over the day to close at 56.25bp.
- Reasonable price volatility over the course of the trading day.
Amir Khwaja is chief executive of Clarus Financial Technology.
コンテンツを印刷またはコピーできるのは、有料の購読契約を結んでいるユーザー、または法人購読契約の一員であるユーザーのみです。
これらのオプションやその他の購読特典を利用するには、info@risk.net にお問い合わせいただくか、こちらの購読オプションをご覧ください: http://subscriptions.risk.net/subscribe
現在、このコンテンツを印刷することはできません。詳しくはinfo@risk.netまでお問い合わせください。
現在、このコンテンツをコピーすることはできません。詳しくはinfo@risk.netまでお問い合わせください。
Copyright インフォプロ・デジタル・リミテッド.無断複写・転載を禁じます。
当社の利用規約、https://www.infopro-digital.com/terms-and-conditions/subscriptions/(ポイント2.4)に記載されているように、印刷は1部のみです。
追加の権利を購入したい場合は、info@risk.netまで電子メールでご連絡ください。
Copyright インフォプロ・デジタル・リミテッド.無断複写・転載を禁じます。
このコンテンツは、当社の記事ツールを使用して共有することができます。当社の利用規約、https://www.infopro-digital.com/terms-and-conditions/subscriptions/(第2.4項)に概説されているように、認定ユーザーは、個人的な使用のために資料のコピーを1部のみ作成することができます。また、2.5項の制限にも従わなければなりません。
追加権利の購入をご希望の場合は、info@risk.netまで電子メールでご連絡ください。
詳細はこちら コメント
AIエージェントがリスク管理者の課題解決にどう役立つ
シティのリスク専門家は、取引や融資承認に関する構造化データと非構造化データを統合し、リスクに関する単一かつ統一されたビューを構築する自律型AIツールについて概説しました

オペリスク・データ:企業スパイがBBVAに脅威をもたらす
他にも:BofAがエプスタイン氏との関与疑惑で追及されています。また、少数株主がブルックフィールドに異議を唱えています。データ提供:ORX News

AI政治の台頭
MASの顧問であるデビッド・ハードーン氏は、AIを単なる一つの技術として扱うべきではないと述べています

AIリスク管理と能力制御への移行
リスク管理者によると、検証の枠組みを見直すことで、銀行はイノベーションと規制上の要件を両立させ、強固なリスク管理体制を維持することができます

トークン化された商品市場は、経済の円滑な運営に寄与する可能性がある
暗号資産の専門家は、実物資産をブロックチェーンに移行することで、担保に関する摩擦が緩和されると主張しています

GenAIの時代において、未だに優れたモデルが必要なのはなぜなのか?
ジャン=フィリップ・ブショー氏は、モデルが人工知能をレジームシフトの過程で導き、過学習から遠ざけることができると述べています

取引のスピードがガバナンスを上回る時:一瞬の統制の隙間
デリバティブの専門家によると、光駆動型エレクトロニクスの新たな形態が、市場インフラにおける次のリスクとなる可能性があるとのことです

先物とオプションが示す戦争のコスト
現物価格は大きな混乱を示していますが、先物市場はこれが一時的なものだと示唆しており、オプション市場は不安定な状況が続くと示唆しています