
Credit data: doom loop depends on sovereign strength
Analysis of 59 countries shows bank and sovereign credit are most likely to be correlated in lower-rated countries

Rising global rates, coupled with trade tensions, have contributed to the recent bout of volatility in emerging markets. Venezuela now has hyperinflation, Argentina is struggling with a renewed currency crisis despite emerging from default two years ago, while Turkey is grappling with high levels of dollar debt and a prolonged devaluation. Even Italy – still investment grade and a member of the euro – is at risk of a sovereign downgrade.
During these periodic and contagious crises, a key investment question centres on the link between sovereign, corporate and banking credit risk: put simply, can local companies chart their own course, or does everything become contaminated by sovereign risk? In the eurozone debt crisis, this dangerous embrace between banks and sovereigns was dubbed a ‘doom loop’.
Analysis of the credit trends of banks and corporates in 59 countries suggests some of this depends on the strength of the sovereign. Banks and corporates in non-investment-grade countries are more likely to be correlated with sovereign credit than those in investment-grade countries – perhaps because banks and corporates in more creditworthy countries are also more likely to be internationally active and have a more diverse mix of assets.
Turkey’s recent woes have raised questions about the risk of contagion between local banks and European lenders. A separate analysis in this article shows no apparent link between the two in terms of recent credit performance. In fact, as default probabilities for large Turkish banks have increased this year, those for eurozone banks have dipped. Elsewhere this month, we review credit trends for Main Street versus Silicon Valley and examine the six-month credit volatility of constituents for large US and European stock indexes – it has been growing strongly since the second quarter.
Global credit industry trends
The latest bank-sourced credit data, based on 25 contributor banks, shows upgrade and downgrade activity has further increased, with 80 companies moving more than one notch. Figure 1 shows detailed industry migration trends for the most recent published data, based on data adjusted for changes in contributor mix.
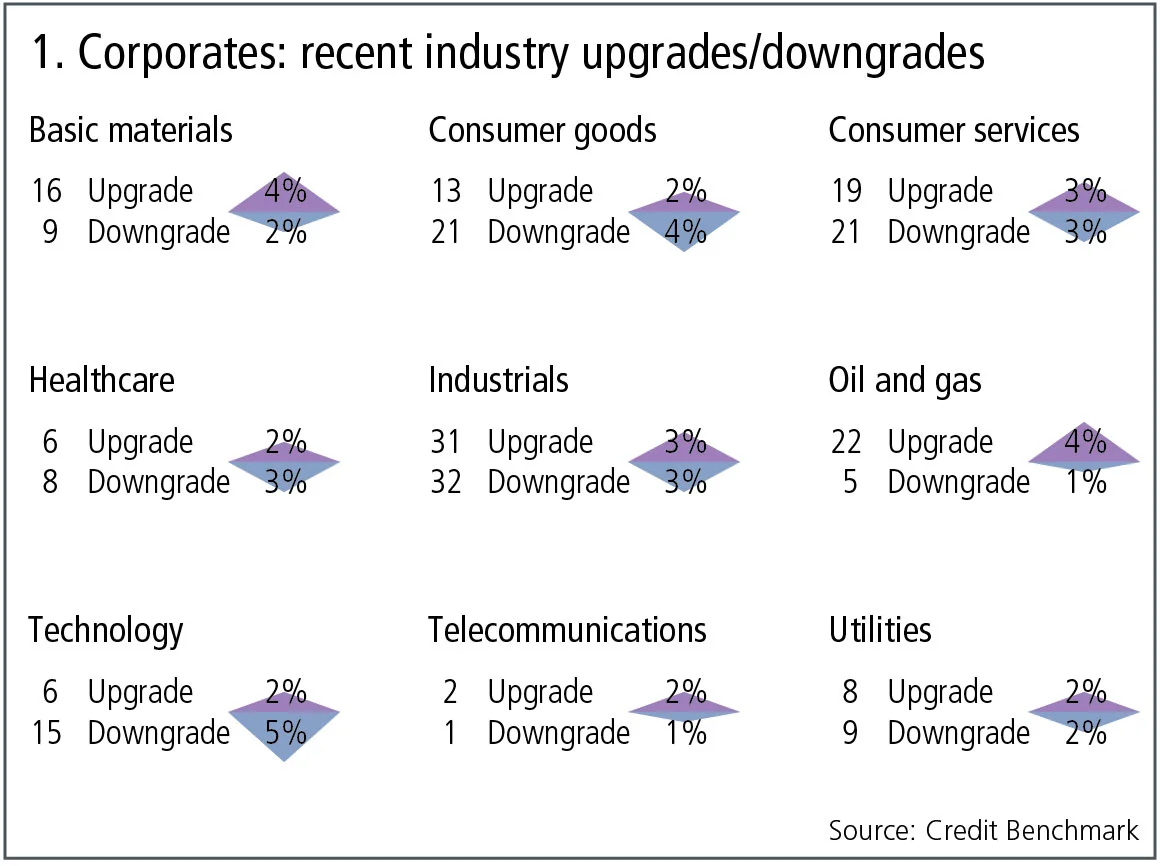
Figure 1 shows:
- Across global corporates, the number of upgrades and downgrades are in balance.
- An equal number of industries for which upgrades dominate, downgrades dominate or are balanced.
- Basic materials and oil and gas continue their trend of the past few months, with upgrades outweighing downgrades.
- Technology has seen a change to downgrades outnumbering upgrades, after a month of balance preceded by a quarter favouring upgrades.
- Consumer services, industrials and utilities have stabilised, with upgrades and downgrades in balance after two months that favoured upgrades.
- Telecommunications continues the trend of slightly favouring upgrades for the third month.
- Healthcare returns to its trend of downgrades outweighing upgrades, after a period of the reverse.
- Consumer goods once again sees downgrades outnumbering upgrades after a quarter of stability.
Sovereign vs corporate credit risk
Figure 2 plots relationships between sovereigns and corporates, and between sovereigns and banks, for 59 countries, split into investment-grade and high-yield categories.
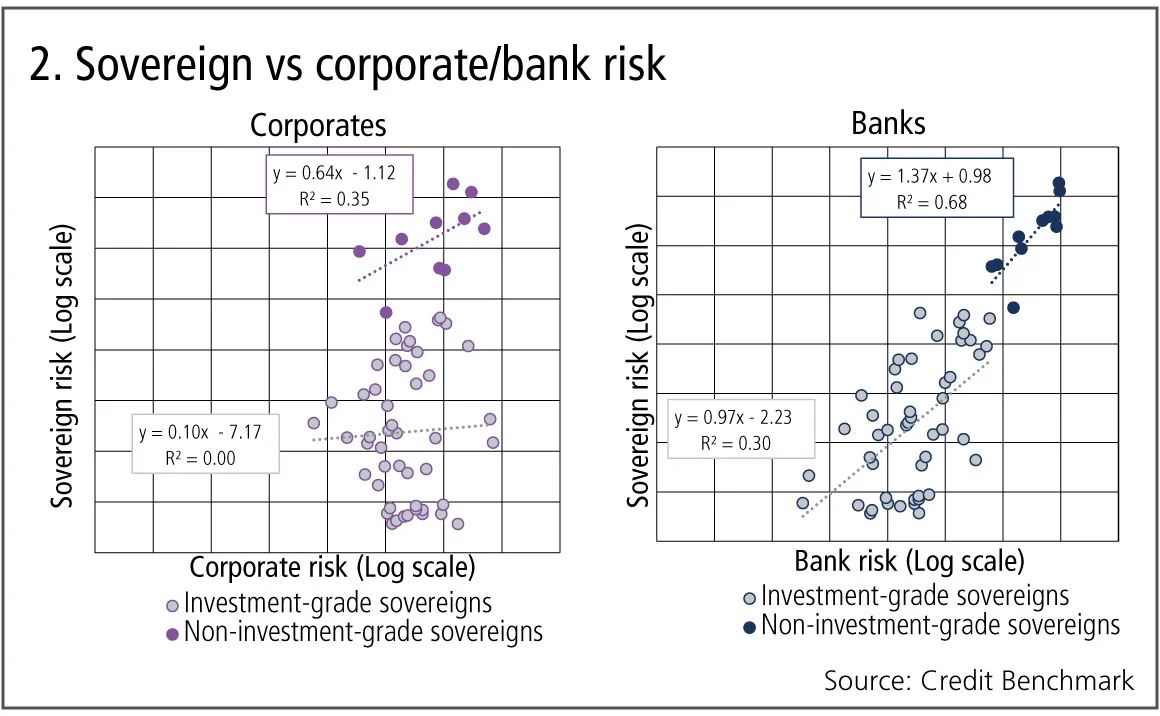
Figure 2 shows:
- For investment-grade sovereigns, there is no obvious relationship between sovereign and corporate credit risk.
- For high-yield sovereigns, there is a modestly positive relationship between sovereign and corporate credit risk, although the country sample is small.
- Bank credit risk shows modest (investment grade) and strong (high yield) positive relationships with sovereign credit risk.
- Section 4 of this report shows a detailed example of this for Turkey.
Main Street vs Silicon Valley
The US stock market continues to make new records, with the longest bull run in history, frequent new highs, and Apple becoming the first-ever $1 trillion market cap company. But some divergences are starting to appear. Some of the most reliable technology stocks have seen significant share-price drops, with earnings misses adding to concerns about social media governance and fickle young consumers turning away from smartphones. Main Street and Silicon Valley are increasingly in direct competition, with traditional manufacturers embedding increasingly sophisticated technology in their products while the largest tech companies are diversifying into telecoms, autos and logistics. Figure 3 shows the relative credit trends and credit distribution for the largest mainstream 500 companies in the US (a proxy for the S&P 500) and a large sample of about 1,000 companies with a Nasdaq listing.
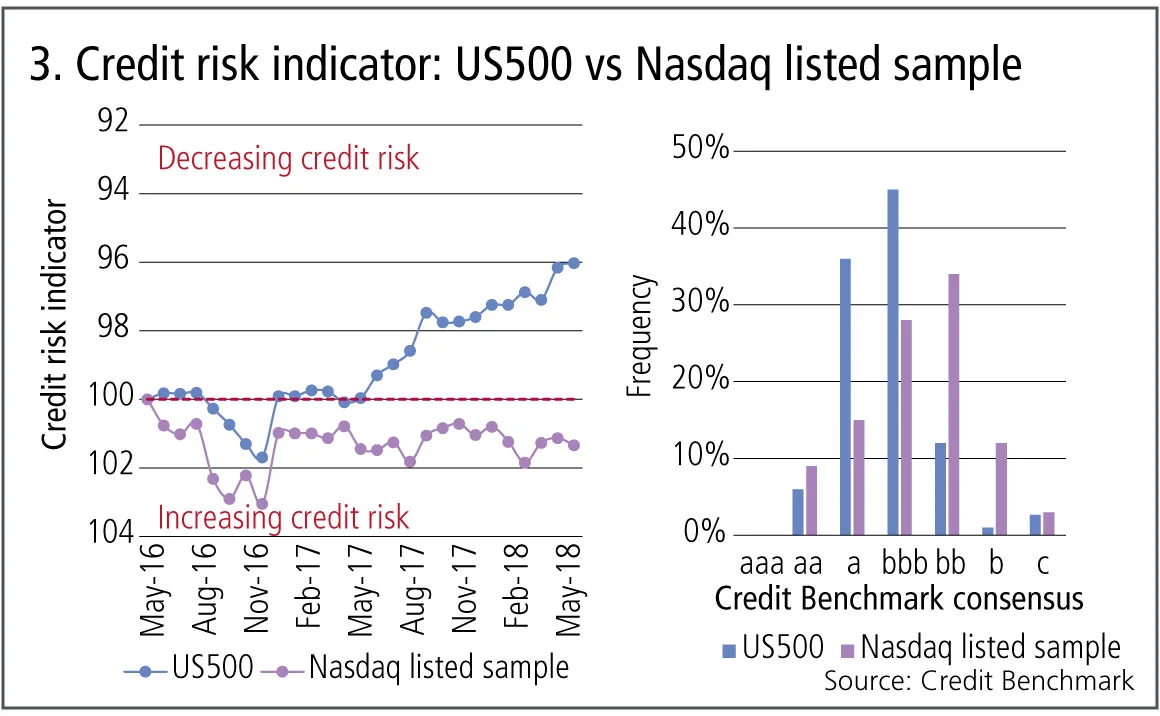
Figure 3 shows:
- Both series show a deterioration in credit quality in 2016.
- The two series tracked one another quite closely until mid-2017.
- After mid-2017, there has been a sustained improvement in credit risk for the US500 series.
- Credit risk for the Nasdaq listed sample has shown a slight deterioration since early 2017.
Turkish banks vs Europe
Recent emerging market woes seem to be spreading. Venezuela has been in serious difficulties for more than a year, while Argentina’s currency has slid since April. Turkey’s currency has been sliding since the start of this year, with the main concern being that its corporates have borrowed heavily in US dollars – an increasingly common activity in developing economies that can turn a traditional one-off currency devaluation into a full-blown foreign exchange crisis. Turkish domestic banks are understandably the most exposed lenders, but there have been widespread concerns about contagion to European banks. Bank-sourced data suggests these concerns are overdone.
Figure 4 compares the recent credit trends for eurozone and Turkish banks. It also shows the pattern of improvements and deteriorations in Turkey.
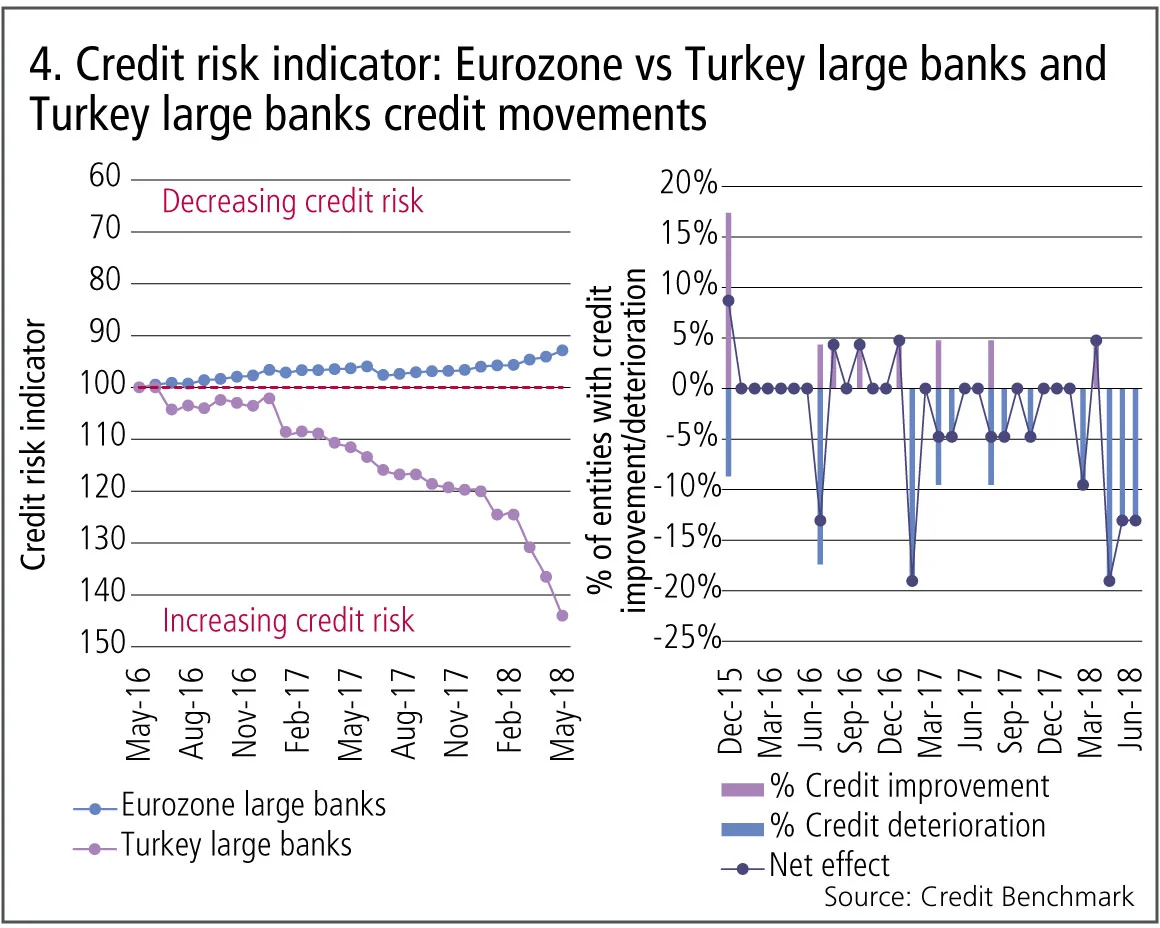
Figure 4 shows:
- The eurozone banks have been steadily improving over the past two years.
- Changes in bank estimates (the right hand chart) show that the pattern of frequent and large deteriorations began in 2016.
- Turkish banks show a dramatic and potentially accelerating decline.
- Credit data shows no evidence of ‘contagion’ from Turkish to eurozone banks.
Credit volatility
The equity Vix – often referred to as the ‘fear index’ – has been below its long-run average in recent years, and any spikes have been short-lived. Some commentators have linked this extended period of muted volatility to the persistence of low interest rates, so a sustained monetary tightening could see the Vix moving back towards more typical levels. There is no direct credit equivalent to the equity Vix; but the observed volatility of credit spreads provides a proxy. Bank-sourced data provides a more forward-looking view of credit risk, free from risk premium distortions, so the rolling volatility of bank credit estimates can be seen as a closer credit equivalent to the Vix.
Figure 5 shows the annualised six-month rolling volatility of credit estimates for the constituents of the main equity indexes, covering the US, UK, France and Germany.

Figure 5 shows:
- Similar to the equity Vix, credit volatility is itself quite volatile.
- Unlike the equity Vix, credit volatility can drop to very low levels – such as June 2017 – during periods when credit risk estimates are seeing no significant revisions.
Credit volatility has been trending higher over this period, suggesting increasing uncertainty about the outlook for credit. Data from the St Louis Fed (not shown) indicates US credit spreads have narrowed over most of this period. If volatility remains high or increases further, spreads may start to expand.
About this data
The Credit Benchmark dataset is based on internally modelled credit ratings from a pool of contributor banks. These are mapped into a standardised 21-bucket ratings scale, so downgrades and upgrades can be tracked on a monthly basis. Obligors are only included where ratings have been contributed by at least three different banks, yielding a total dataset of nearly 21,200 names.
David Carruthers is head of research at Credit Benchmark.
Only users who have a paid subscription or are part of a corporate subscription are able to print or copy content.
To access these options, along with all other subscription benefits, please contact info@risk.net or view our subscription options here: http://subscriptions.risk.net/subscribe
You are currently unable to print this content. Please contact info@risk.net to find out more.
You are currently unable to copy this content. Please contact info@risk.net to find out more.
Copyright Infopro Digital Limited. All rights reserved.
As outlined in our terms and conditions, https://www.infopro-digital.com/terms-and-conditions/subscriptions/ (point 2.4), printing is limited to a single copy.
If you would like to purchase additional rights please email info@risk.net
Copyright Infopro Digital Limited. All rights reserved.
You may share this content using our article tools. As outlined in our terms and conditions, https://www.infopro-digital.com/terms-and-conditions/subscriptions/ (clause 2.4), an Authorised User may only make one copy of the materials for their own personal use. You must also comply with the restrictions in clause 2.5.
If you would like to purchase additional rights please email info@risk.net
More on Comment
Don’t mind the gap risk: regulatory treatment of credit repacks
Gap risk in repackaging is not a credit valuation adjustment for Basel III capital purposes, argues senior quant Andrey Chirikhin

Op risk data: HSBC hit with $400m external fraud loss
Also: China’s unlicensed trading clampdown; SocGen’s insurance mis-selling woes. Data by ORX News

Vinicius fortune: quantifying luck in the World Cup draw
Julien Guyon explains how bias, variance and luck affect teams in this summer’s tournament – and explores wider relevance for portfolio managers

G-Sib capital surcharge: how indexing and averaging alter incentives
Capital risk strategist anticipates Basel III endgame impact on US big-bank behaviour

Podcast: Abi-Jaber and Li on a ‘sticky’ volatility problem
The pair discuss their model to jointly capture Vix, SPX and SSR

Markets perceive the future in very distorted ways
Discounting paradigms should adapt to be more realistic, says Jean-Philippe Bouchaud

Op risk data: Cyber hacks shake crypto protocols
Also: JP Morgan fined over investor losses; Symetra’s Methodist pensions mess. Data by ORX News

Prediction markets can be a canary in the coal mine
Prices of contracts on the likes of Polymarket can act as signals for risk management and hedging, says risk expert
