
Credit data: default risk still growing for Italy’s banks
Despite a drop in the bad loan ratio, default estimates continue to rise, writes David Carruthers of Credit Benchmark

Since the 2008 financial crisis, Italian banks have seen particularly rapid growth in non-performing loans (NPLs) compared with other eurozone countries. In the past decade, the ratio of Italian bank NPLs to total loan value increased from 5.8% in 2007 to 18.1% in 2016.
The problem is particularly acute in construction and real estate loans; these sectors make up more than 40% of corporate NPLs in Italy. While nearly three-quarters of Italian bank loans are secured by personal guarantees or real estate collateral, the Italian House Price index has fallen by more than 15% since 2010.
Italy’s oldest and third-largest bank, Monte dei Paschi (MPS), was bailed out by the Italian government in mid-2017. This may have represented a turning point – World Bank data shows the NPL ratio decreased from 18.1% to 17.1% in 2017. But this is still nearly four times that of the European Union average, and International Montetary Fund data shows that under current projections, Italian GDP may not return to its pre-crisis level until 2025 – that may help explain why, despite the recent reduction in bad loans over the past year, default risk has continued to increase in 2018.
Elsewhere this month, we look at sovereign credit risk in sub-Saharan Africa, and report on credit trends of the top 500 global companies vs the top 500 US companies. We also discuss the credit distribution of small and medium-sized enterprises (SMEs) in the US.
Global credit industry trends
Figure 1 shows industry migration trends for the most recent published data.
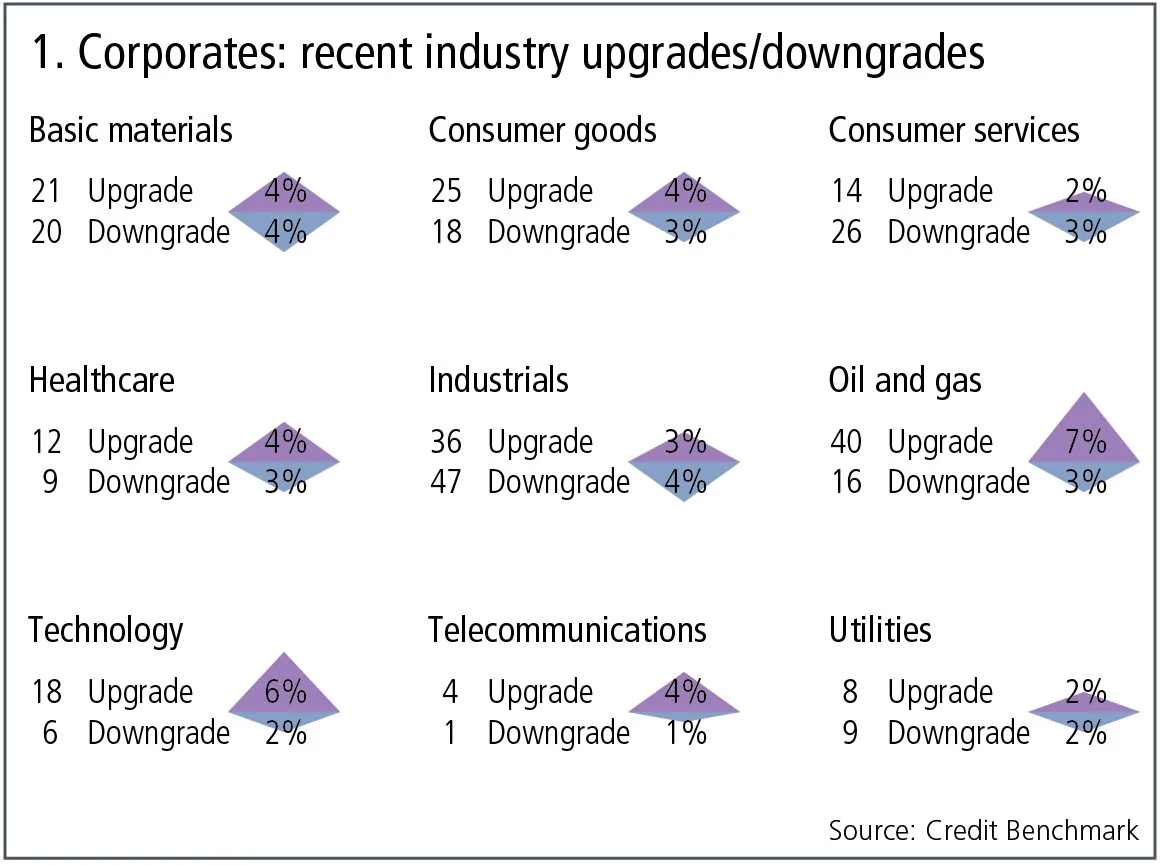
Figure 1 shows:
- In global corporates, consensus upgrades outnumber downgrades. Upgrades dominate downgrades in five out of nine industries. Two industries are dominated by upgrades and two are balanced.
- Overall, 4% of the global corporates obligors have improved and 3% show a deterioration. Compared with the previous month, the imbalance has switched in favour of upgrades.
- Consumer services and industrials continue their trend from last month, with downgrades outnumbering upgrades.
- Healthcare, consumer goods and telecommunications now favour upgrades after a period of downgrades outweighing upgrades.
- After a month of balance, both oil and gas and technology have continued their previous trend of upgrades outweighing downgrades.
- Utilities has returned to balance after a quarter of downgrades outweighing upgrades, as has basic materials, which saw a period of upgrades outnumbering downgrades.
Italian banks
Figure 2 shows the average credit quality level and trends for large Italian banks (45 banks), large EU banks (540 banks), and the top 30 global systemically important banks.
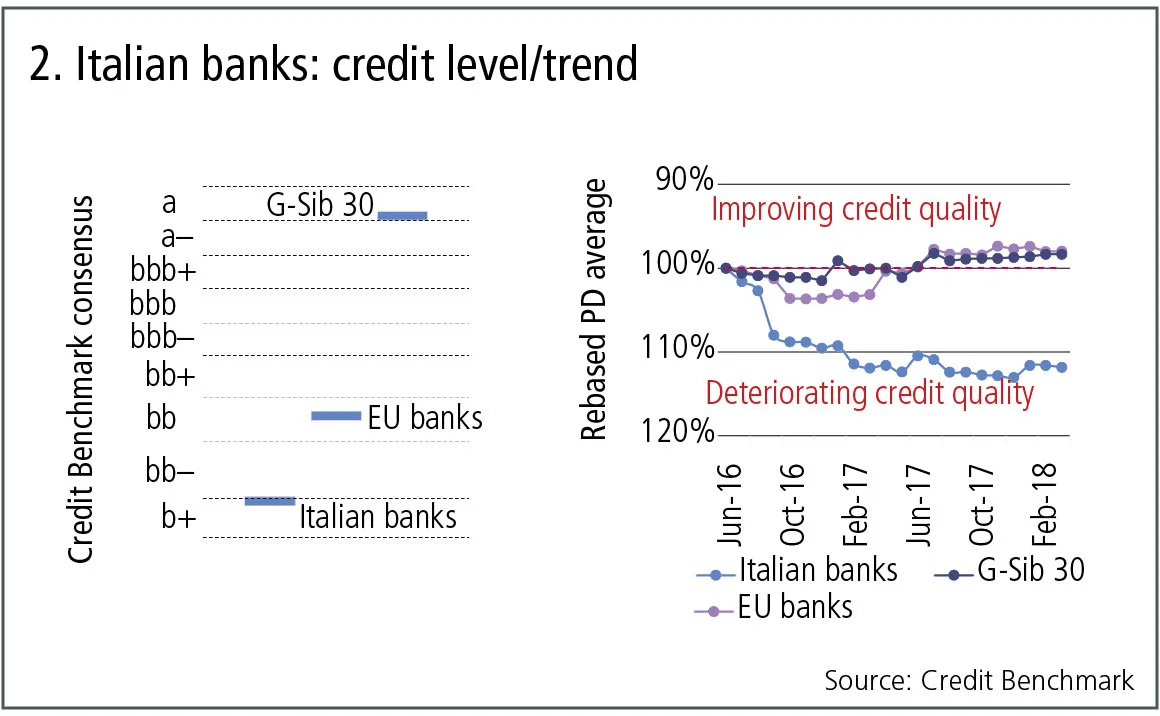
Figure 2 shows:
- Large Italian banks have the lowest Credit Benchmark consensus (CBC), which is b+, while the CBC of EU banks is bb and the CBC of the G-Sib 30 is a.
- The credit quality of these Italian banks has deteriorated by just over 10%, while the credit quality of the EU and G-Sib banks has slightly improved.
- The decline was particularly sharp in 2016, but the trend has been towards deterioration in 15 out of the 21 months plotted here.
Sub-Saharan Africa
In a recent Regional Economic Outlook, the IMF discusses the increase in debt levels across sub-Saharan African countries. This debt growth is mainly a response to very favourable frontier market borrowing terms offered during the cheap money environment of the past few years.
But the IMF report estimates 40% of low-income sub-Saharan African countries are now in or close to debt distress. These countries typically rely on debt-driven public investment to drive growth, but much of the recent issuance has been in foreign currency. If US interest rates continue to rise and potentially strengthen the dollar, there will be considerable refinancing pressure on all indebted frontier countries.
The following chart is based on bank-sourced estimates for 21 sovereigns in the region. It plots the balance of sovereigns with improving vs deteriorating credit quality, and also shows the rebased trend for sovereign risk in these countries.
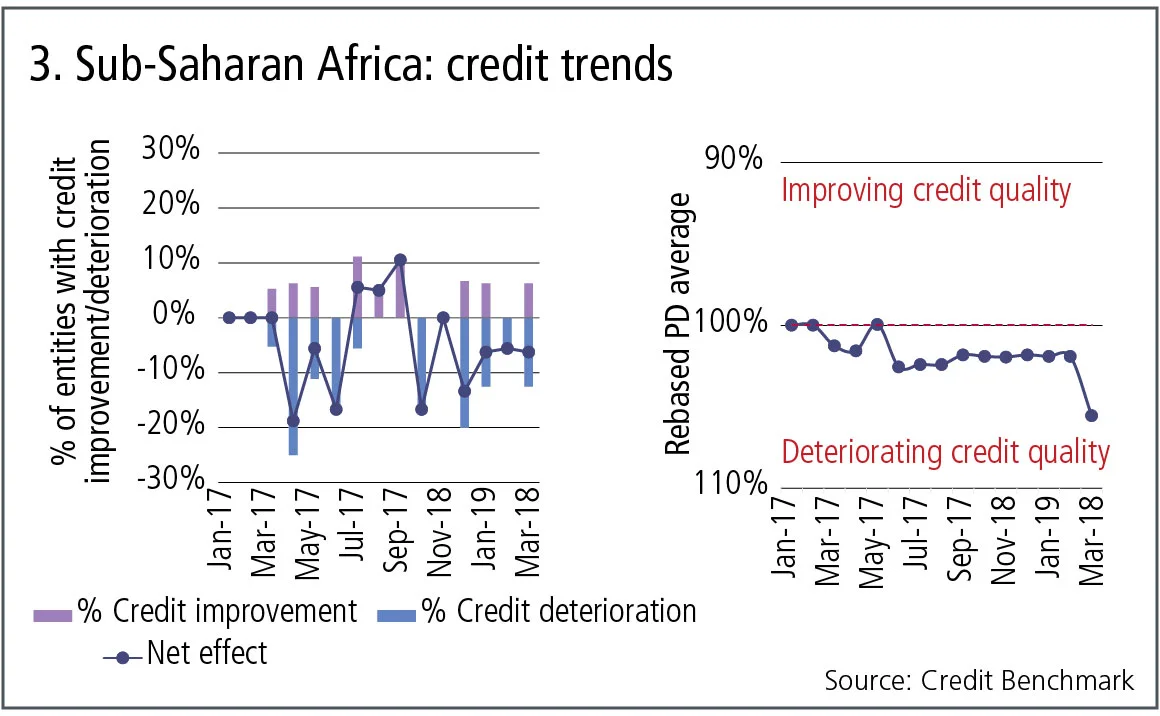
Figure 3 shows:
- A sustained trend towards credit deterioration – the increasing risk of debt distress has already affected the credit quality of sub-Saharan African countries.
- Over the past 20 months, credit risk has increased for 10 countries and has improved for only five.
- Apart from a modest recovery in Q2 2017, the credit quality trend has been stable or down for most of this period, with one country – Angola – driving a particularly sharp deterioration in the most recent month.
Global 500 vs US 500 – the Trump effect?
Since Donald Trump took office, US government policy has focused on creating a business-friendly environment for corporate America. A combination of tax cuts and selective increases in spending has been good for profits, share prices and consensus credit ratings. There is more uncertainty about the long-term effects of trade tariffs – there is a risk that some US industries may see short-term windfall gains eroded by long-term declines in trading volumes.
Figure 4 shows the credit distribution and credit trends for the largest 500 companies in the US compared with the global equivalent.
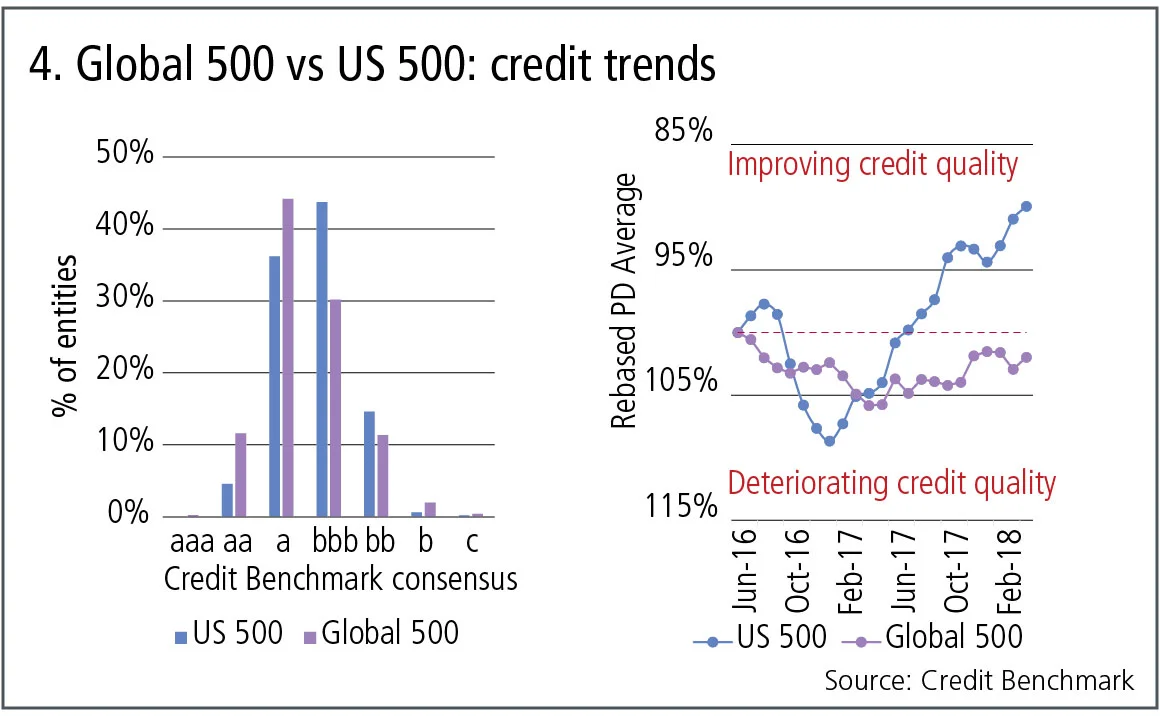
Figure 4 shows:
- Both the top 500 global companies and the top US companies have an average Credit Benchmark consensus of bbb–.
- Compared with the US 500, the global 500 has a higher proportion of companies in the a category, but the distribution is positively skewed.
- The global 500 has been broadly stable over the period, with a 5% deterioration followed by a modest improvement.
- The US 500 saw a rapid deterioration in credit quality until early 2017, having decreased by about 10%. However, it has shown a steady improvement over the past year and now shows an overall improvement of 10%.
SME corporate credit distribution
The Basel revisions published in December 2017 include a risk-weighted average (RWA) weight of 85% for SMEs. This may create some unusual lending incentives depending on the typical credit quality of these smaller companies.
Figure 5 compares the US SME credit distribution with that of large US corporates; both of these samples cover private companies – ie, they have no bonds or equities in issue – so they would not qualify as investment grade under the Basel 2017 rules for the US and similar jurisdictions where nationally recognised statistical rating organisation ratings are inadmissible for RWA purposes.
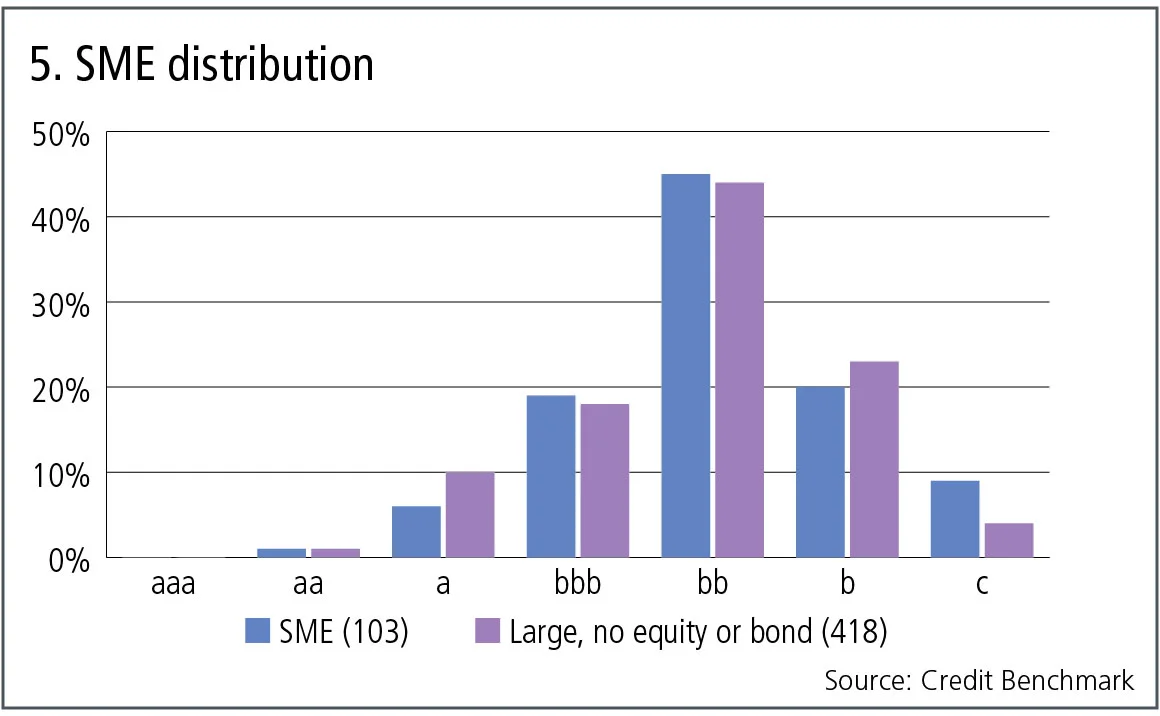
Figure 5 shows:
- The credit risk of 103 private SME companies is slightly lower than that of 418 large private companies.
- Both categories are dominated by the bb category.
- Both categories show a very low share of investment-grade obligors; these account for 26% of private SMEs and 29% of large private companies.
About this data
The Credit Benchmark dataset is based on internally modelled credit ratings from a pool of contributor banks. These are mapped into a standardised 21-bucket ratings scale, so downgrades and upgrades can be tracked on a monthly basis. Obligors are only included where ratings have been contributed by at least three different banks, yielding a total dataset of almost 19,400 names, which is growing by 5% per month.
David Carruthers is head of research at Credit Benchmark.
Only users who have a paid subscription or are part of a corporate subscription are able to print or copy content.
To access these options, along with all other subscription benefits, please contact info@risk.net or view our subscription options here: http://subscriptions.risk.net/subscribe
You are currently unable to print this content. Please contact info@risk.net to find out more.
You are currently unable to copy this content. Please contact info@risk.net to find out more.
Copyright Infopro Digital Limited. All rights reserved.
As outlined in our terms and conditions, https://www.infopro-digital.com/terms-and-conditions/subscriptions/ (point 2.4), printing is limited to a single copy.
If you would like to purchase additional rights please email info@risk.net
Copyright Infopro Digital Limited. All rights reserved.
You may share this content using our article tools. As outlined in our terms and conditions, https://www.infopro-digital.com/terms-and-conditions/subscriptions/ (clause 2.4), an Authorised User may only make one copy of the materials for their own personal use. You must also comply with the restrictions in clause 2.5.
If you would like to purchase additional rights please email info@risk.net
More on Comment
Op risk data: HSBC hit with $400m external fraud loss
Also: China’s unlicensed trading clampdown; SocGen’s insurance mis-selling woes. Data by ORX News

Vinicius fortune: quantifying luck in the World Cup draw
Julien Guyon explains how bias, variance and luck affect teams in this summer’s tournament – and explores wider relevance for portfolio managers

G-Sib capital surcharge: how indexing and averaging alter incentives
Capital risk strategist anticipates Basel III endgame impact on US big-bank behaviour

Podcast: Abi-Jaber and Li on a ‘sticky’ volatility problem
The pair discuss their model to jointly capture Vix, SPX and SSR

Markets perceive the future in very distorted ways
Discounting paradigms should adapt to be more realistic, says Jean-Philippe Bouchaud

Op risk data: Cyber hacks shake crypto protocols
Also: JP Morgan fined over investor losses; Symetra’s Methodist pensions mess. Data by ORX News

Prediction markets can be a canary in the coal mine
Prices of contracts on the likes of Polymarket can act as signals for risk management and hedging, says risk expert

How AI agents can join the dots for risk managers
Citi risk expert outlines agentic AI tool that would pull together structured and unstructured data on trading and lending approvals to create single, unified view of risk
