Credit data: US retail woes are not universal
Default probabilities paint a mixed picture of the decline of American shops

As articles about the parlous state of US retailing piled up this year, a schism emerged: should it be described as an apocalypse or merely a meltdown?
Broadly, the facts are clear: under pressure from Amazon and other online retailers, bricks-and-mortar retailers are closing shops and slipping down the credit spectrum. In June, a report from Moody’s Investors Service revealed 22 retailers were sitting on the bottom rung of the agency’s rating scale – up from 19 at the start of the year – and predicted the number of distressed firms would continue growing.
Banks’ estimates of probability of default (PD) agree with aspects of this. During 2017, PDs have risen for six different US retail segments. But the decline in credit quality is worse for some than others, and plenty of individual credits are bucking the general trend – a chart of credit migrations during 2017 shows a mix of both downgrades and upgrades. The former outweigh the latter, but it’s not overwhelming: some retailers are finding ways to succeed.
This month’s article also shows the distribution of credit risks across Latin America, a region that is currently attracting a lot of interest from lenders. And we review some of the global sectors that are showing the largest improvements in credit risk over the past 12 months.
Global credit industry trends
Figure 1 shows industry migration trends for the most recent published data.
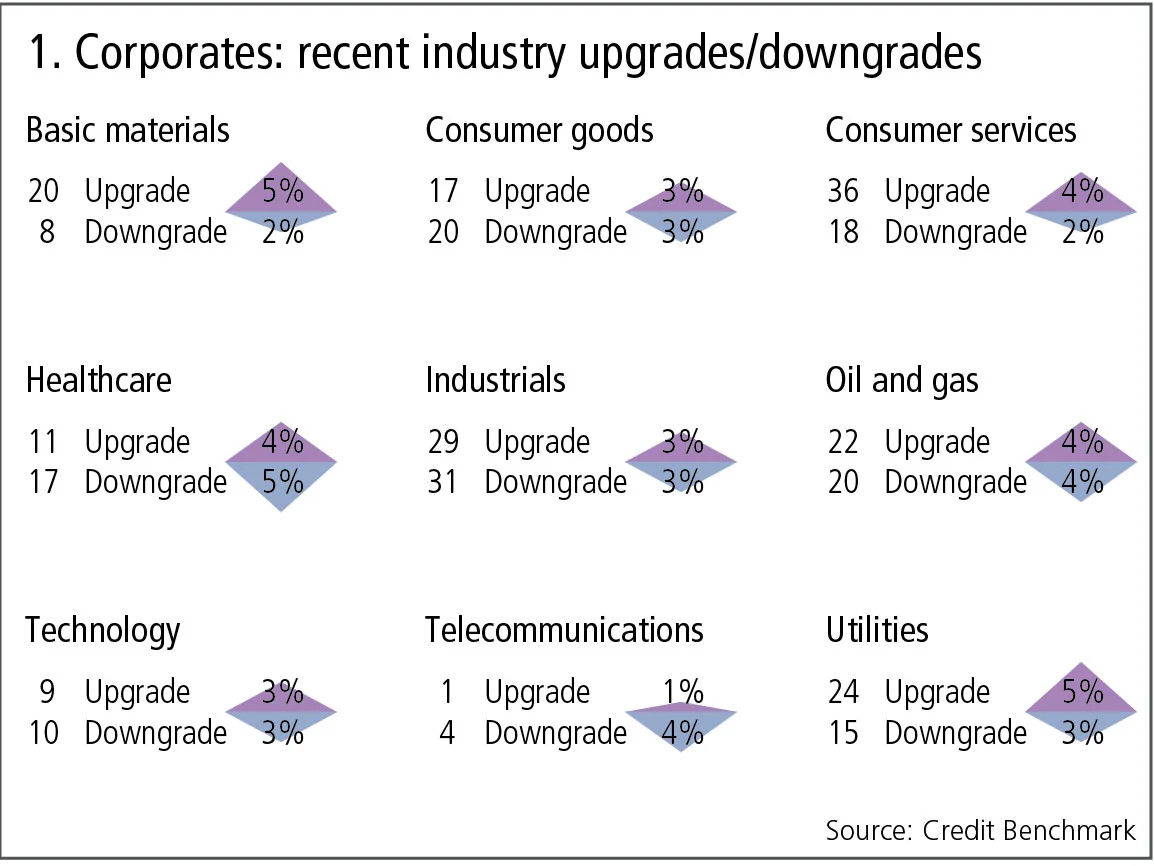
Figure 1 shows:
- Global corporate downgrades have dropped back after last month’s surge, with upgrades slightly outnumbering downgrades. Reversals of this sort have been a feature of the past few months.
- In industries where downgrades still outnumber upgrades, the imbalance has generally reduced.
- Basic materials and utilities have both moved in favour of upgrades.
- Downgrades still outnumber upgrades in consumer goods and health, but the imbalance has reduced.
- Technology and oil and gas are now balanced; previously they were heavily skewed towards downgrades.
- Industrials remain in balance.
US retail: credit risk trends
The past year has been very difficult for some of the largest conventional retailers in the US. The growth of online merchandising has been a threat for years, but many mainstream companies are only now being forced out. Figure 2 shows the 2017 trends in credit risk across the main US retail subsectors. (Note that the y-axis is inverted.)
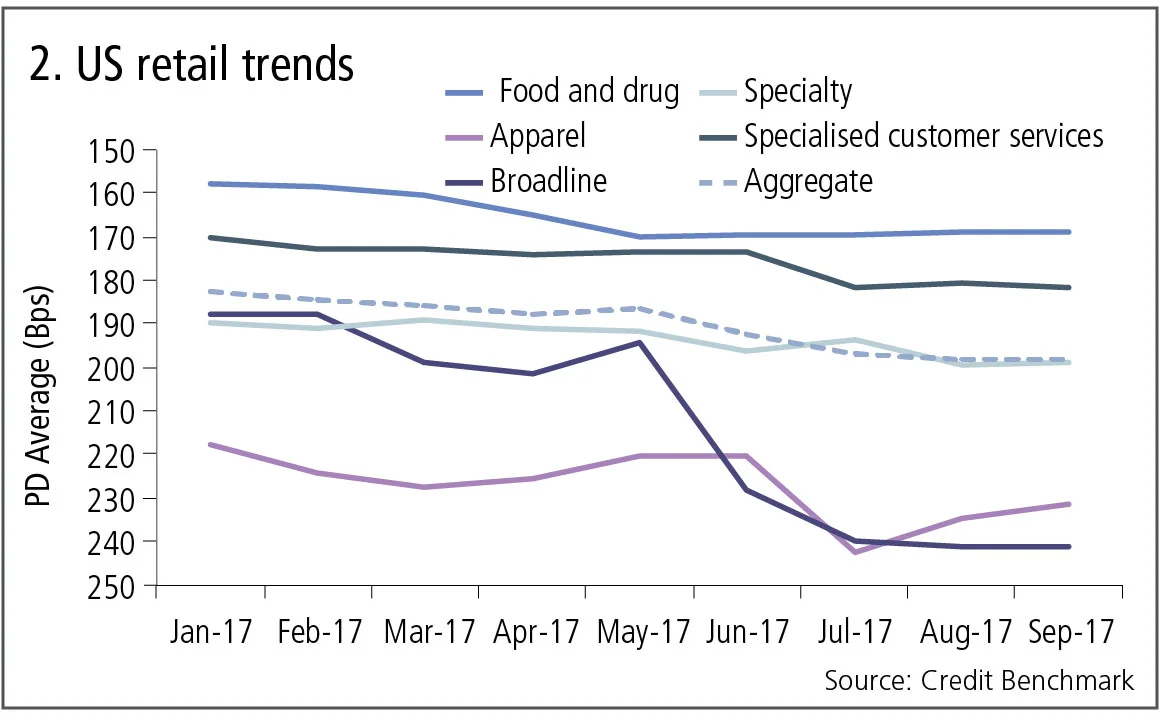
Figure 2 shows:
- Credit risk for food and drug retailers shows the shallowest decline.
- Specialised and specialty retailers show a similar moderate decline.
- Apparel retailers were the highest risk at the start of 2017 by a considerable margin, but broadline retailers – high-volume, budget outlets – have now overtaken them.
US retail: credit migrations
The trend graphs show major differences between the sub-sectors in the retail industry. Although the overall impression is one of decline, in practice the picture is more complex. Figure 3 shows the 2017 pattern of migrations across the credit spectrum.
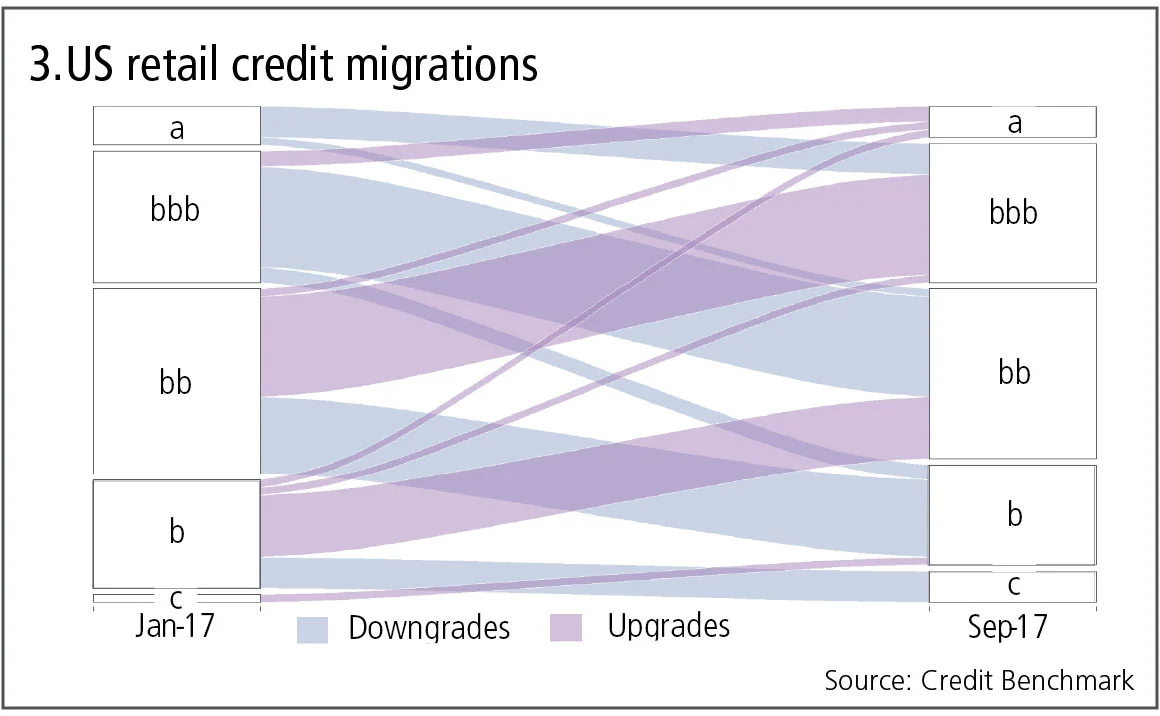
Figure 3 shows:
- The pattern of downgrades and upgrades is approximately symmetric.
- The migration from a to bbb outweighs the upgrades in the opposite direction.
- Migrations between investment grade (bbb) and non-investment grade (bb) are in balance, although a significant number of bbb retailers have migrated two categories down to b.
- The volume of migrations from b to c outweighs those in the opposite direction.
Credit risk in Latin America
Lenders are showing growing interest in credit benchmarks for Latin America; this partly reflects a rebalancing of new business portfolios away from the Middle East and Africa. GDP expansion across the region has been subdued; recent data reported by The Economist shows a range from 2.7% in Argentina to –8.8% in Venezuela. Figure 4 shows the current distribution of corporate credit risks for three of the largest Latin American economies.
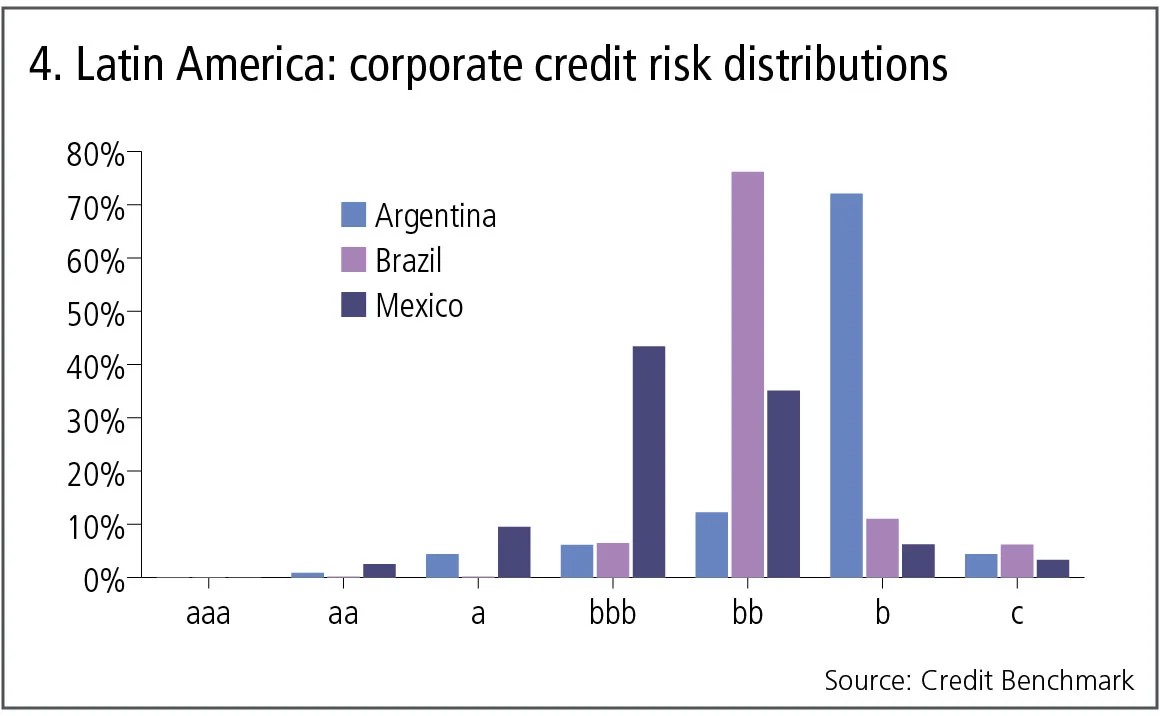
Figure 4 shows:
- In Argentina, the majority of corporates are in the bb category. It is the fastest growing economy in the region after emerging from default. It expects to rely on new debt to finance this recovery.
- Brazilian corporates are mainly bbb. While this is typical of a diverse and relatively robust economy, there are very few obligors in the a and aa categories; suggesting that overall Brazilian corporate credit risk is relatively vulnerable to economic shocks. The economy is expected to show just +0.7% growth for 2017.
- In Mexico, the majority of obligors are in the a or bbb categories, with a small percentage in the aa/aaa categories. The fate of the North American Free Trade Association may have a significant impact on this distribution over the next few years. Mexican trade patterns are already beginning to change, with more competition from other Latin American economies.
Global corporate trends: improving sectors
Credit trends provide an additional macro-indicator. But changes in credit risk can be incremental and piecemeal, so it is worth tracking broad groups of obligors across a range of sectors to identify strong trends and turning points. Figure 5 shows three global sectors with steady improvements in credit risk.
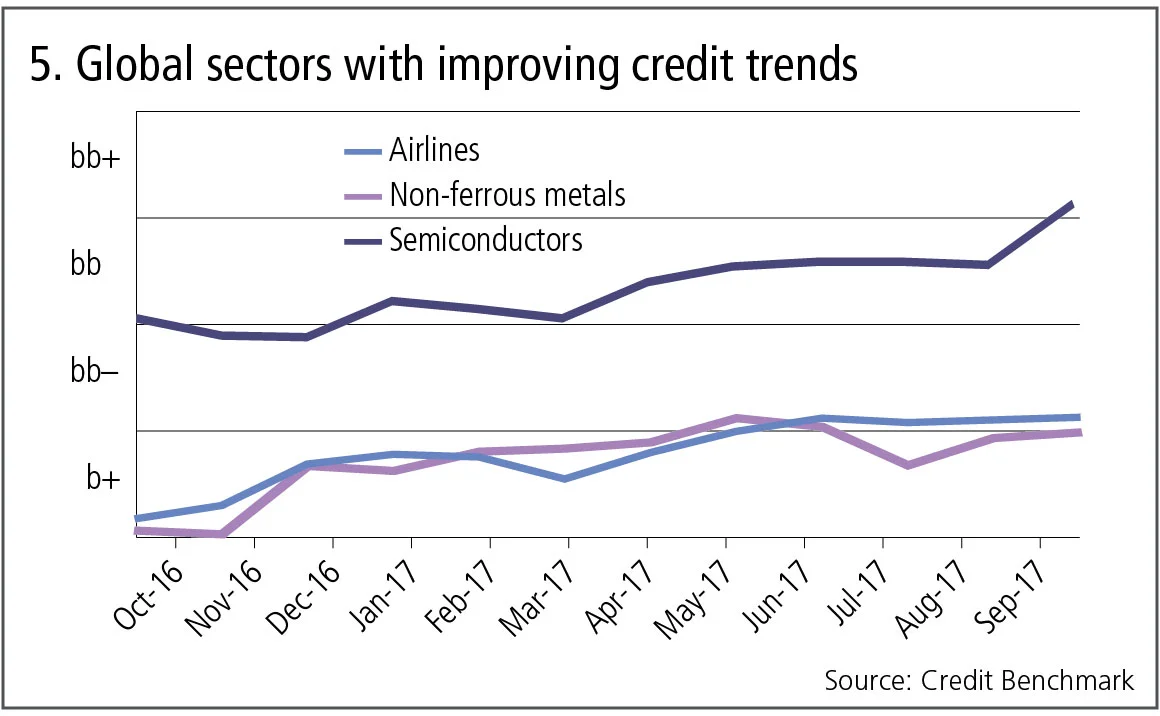
Figure 5 shows:
- Non-ferrous metals reflect the 2017 improvement in copper and brass prices. Average credit risk for this sample of 16 companies is now close to being upgraded to bb–.
- Airlines have steadily improved over 2017, benefiting from the lower oil price. The average credit risk for this sample of 54 companies has moved from b+ to bb–.
- Semiconductors show the most dramatic trend. From bb– a year ago, they have traversed bb and are currently bb+. If current trends continue, average risk for the sector could soon reach investment grade.
About this data
The Credit Benchmark dataset is based on internally modelled credit ratings from a pool of contributor banks. These are mapped into a standardised 21-bucket ratings scale, so downgrades and upgrades can be tracked on a monthly basis. Obligors are only included where ratings have been contributed by at least three different banks, yielding a total dataset of roughly 13,000 names, which is growing by 5% per month.
David Carruthers is the head of research at Credit Benchmark, a credit risk data provider.
Only users who have a paid subscription or are part of a corporate subscription are able to print or copy content.
To access these options, along with all other subscription benefits, please contact info@risk.net or view our subscription options here: http://subscriptions.risk.net/subscribe
You are currently unable to print this content. Please contact info@risk.net to find out more.
You are currently unable to copy this content. Please contact info@risk.net to find out more.
Copyright Infopro Digital Limited. All rights reserved.
As outlined in our terms and conditions, https://www.infopro-digital.com/terms-and-conditions/subscriptions/ (point 2.4), printing is limited to a single copy.
If you would like to purchase additional rights please email info@risk.net
Copyright Infopro Digital Limited. All rights reserved.
You may share this content using our article tools. As outlined in our terms and conditions, https://www.infopro-digital.com/terms-and-conditions/subscriptions/ (clause 2.4), an Authorised User may only make one copy of the materials for their own personal use. You must also comply with the restrictions in clause 2.5.
If you would like to purchase additional rights please email info@risk.net
More on Comment
Op risk data: Corporate spies spell trouble for BBVA
Also: BofA buttonholed for alleged Epstein links; minority shareholders take a bite of Brookfield. Data by ORX News

The rise of AI politics
AI should not be treated as just another technology, writes MAS adviser David Hardoon

AI risk management and the shift to capability control
By reframing validation, banks can align innovation with regulatory demands and maintain robust risk discipline, argues risk manager

Tokenised commodities could help oil the machine
Shifting physical assets onto the blockchain eases collateral frictions, argues crypto expert

In the age of GenAI, why do we still need good models?
Jean-Philippe Bouchaud says models can guide artificial intelligence through regime shifts and away from overfitting

When trading speed outruns governance: the split-second control gap
A new form of light-driven electronics could be the next risk in market infrastructure, explains derivatives expert

What futures and options say about the cost of war
Spot prices reveal major disruption, futures indicate this will pass, options imply ongoing instability

For collateral, can TINA become TIA?
US Treasuries’ dominance as collateral in repo and derivatives is no longer set in stone, argues economist