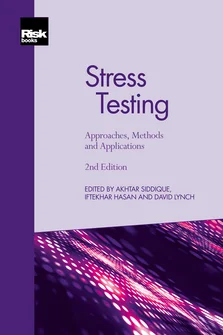
Stress Testing and Other Risk Management Tools
Foreword
Introduction
Response to Financial Crises: The Development of Stress Testing over Time
Stress Testing and Other Risk Management Tools
Econometric Pitfalls in Stress Testing
Stress-testing applications of Machine Learning Models
Four Years of Concurrent Stress Testing at the Bank of England: Developing the Macroprudential Perspective
Stress Testing for Market Risk
The Evolution of Stress Testing Counterparty Exposures
Liquidity Risk: The Case of the Brazilian Banking System
Operational Risk: An Overview of Stress-testing Methodologies
Peacetime Stress Testing: A Proposal
Stress-test Modelling for Loan Losses and Reserves
A New Framework for Stress Testing Banks’ Corporate Credit Portfolio
EU-wide Stress Test: The Experience of the EBA
Stress Testing Across International Exposures and Activities
The Asset Market Effects of Bank Stress-test Disclosures
An Alternative Approach to Stress Testing a Bank’s Trading Book
Determining the Severity of Macroeconomic Stress Scenarios
Governance over Stress Testing
The later chapters of this book will focus on various elements and aspects of stress testing. Although stress tests have gained in prominence since the financial crisis of 2007–09, stress testing existed in the arsenal of risk managers well before the financial crisis. However, it has not existed in isolation: along with stress tests, risk managers have always used other tools.
Quite sophisticated stress testing existed in many banks’ management of market risk before the 2007–09 crisis, and it often focused on the trading book, including both transaction and portfolio-level stress testing. In contrast, the stress testing of credit risk was more likely to be at a transaction level. Portfolio-level stress-testing was often rudimentary, if it existed all. Enterprise-wide stress tests also tended to be rudimentary (with one or two notable exceptions), especially for institutions that had large banking books.
Risk management in financial institutions has always relied on a panoply of tools and measures. Textbooks on risk management at financial institutions describe various other tools, such as position limits and exposure limits, as well as limits on the Greeks, including delta or vega.11 See, for example, Hull (2012). This chapter will therefore discuss the relationship between those other tools and stress testing, focusing on the similarities, differences and consistencies between them, before discussing the ongoing evolution whereby stress testing has affected other risk management tools. We will also discuss how other risk management tools are affecting stress testing.
Of the other risk measures, we concentrate on value-at-risk (VaR) measures, which include economic capital (EC) measures. This choice is motivated by the fact that such metrics are designed to capture risk across disparate scenarios in a manner similar to stress testing. Additionally, regulatory capital models as used in Basel II/ III can also be viewed as akin to EC models. Enterprise-wide risk limits have often been based on VaR or its variants. More concretely, many institutions have expressed their risk appetite in terms of a very high percentile, such as 99.97% EC.
ENTERPRISE-WIDE STRESS TESTING
As is well known, an important use of stress testing has been to acquire enterprise-wide views of risk, especially in the supervisory stress tests run by regulators around the world. These are the enterprise-wide stress tests. At a basic level, different risk management tools can produce different results because of differences in the inputs. For both VaR measures and stress tests, the inputs are data and scenarios.
A stress test may be viewed as a translation of a scenario into a loss estimate. In a similar vein, EC or VaR methods also involve translation of scenarios into loss estimates. The distribution of the loss estimates are then used to derive the VaR at a high percentile, such as 99% or 99.9%. In practice, stress tests usually focus on a few scenarios, whereas VaR measures commonly utilise a very large number of scenarios. Hence, as long as identical inputs and similar definitions of loss estimates are used between stress tests and EC/ VaR methods, there can be consistency between them – at least when identical scenarios are used.
However, in practice the loss estimates are often defined quite differently between stress tests and EC methods. In particular, a significant difference is that losses in stress tests have more often than not taken an accounting view rather than the “market” view commonly attempted in EC methods. The second significant difference has been the horizon. Enterprise-wide stress tests have often examined a long period, such as losses over nine quarters in the Dodd–Frank stress tests in the US. In contrast, EC models have focused on losses at a point in time, such as the loss in value at the end of a year.
The final significant difference is the role of probabilities. Scenarios for stress tests can sometimes be generated using distributions of the macroeconomic variables. Therefore, the results of a scenario in a stress test can be assigned a probability – ie, the probability of that scenario. However, probabilities have not played a prominent role in stress tests. For many stress tests conducted around the world, ordinal rank assignments such as “base”, “adverse” and “severely adverse” have been used, but with little discussion of the cardinal probabilities attached to them. In contrast, cardinal probabilities generally play a large role in VaR-type models. For the VaR/EC models using Monte Carlo simulation, there exist complex underlying statistical models. For the VaR models using historical simulation, the history has been viewed as the distribution to draw from. More importantly, in the interpretation and use of the VaR/EC model results, probabilities have played a very large role. A 99.9% VaR loss has often been viewed as a one-in-1,000 event, albeit with uncertainty (or standard errors) around it.
The last difference has been the approach to scenarios. Stress-test scenarios are often ad hoc and conditional, rather than the unconditional scenarios typically generated in VaR-type metrics. Especially for the regulatory stress tests, the scenario-generation process has looked at the present period as the starting point and then generated two or three hypothetical scenarios from that starting point.
A simple example: Stress test
A concrete example can be given for a wholesale portfolio. It is a very simplified example designed to get the idea across rather than provide a guideline to follow. Let us assume a bank is using a two-year scenario that consists of GDP growth and unemployment (see Table 3.1).
| Macro variable | First year change from base | Second year change from base |
| GDP | –1% | –0.5% |
| Unemployment | +1% | 0% |
For wholesale exposures, let us assume that the bank has chosen to model at a portfolio (top-down) level rather than at a loan level. At a basic level, the bank needs to estimate the sensitivities of losses in this portfolio to the changes in the two macro variables: GDP growth and unemployment.
Let us also assume the information on the bank’s wholesale portfolio shown in Table 3.2.
| Rating bucket | Balance | One-year default rate (%) | Two-year default rate (%) |
| 1 | 200 | 0.00 | 0.00 |
| 2 | 350 | 0.01 | 0.02 |
| 3 | 400 | 0.02 | 0.10 |
| 4 | 500 | 0.18 | 0.53 |
| 5 | 100 | 1.23 | 3.31 |
| 6 | 10 | 5.65 | 12.35 |
| 7 | 0 | 21.12 | 33.53 |
Let us now assume that the bank chooses to use a PD LGD (probability of default loss given default) approach. Therefore, the bank needs to compute the PD in the stress scenario for each of the two years. Additionally, the bank needs to model which of the exposures transition to a lower rating. Finally, the bank needs to understand what new wholesale loans the bank will generate in the two years and what rating buckets (and PD) the new loans will be in.22 For the purposes of this simplified example, we are making very strong assumptions and simplifications and ignoring many elements that banks account for. For instance, banks can find that the underwriting of new loans can actually be stricter in a recession, resulting in a lower PD for new business compared with the existing book. Based on historical experience, the bank establishes the following first-year and second-year stressed PDs. This may be based on the bank’s own historical experience or on industry data. The exposures (exposure at default, EAD) are not expected to change. However, the LGD does change. Using the experience of 2008, the bank finds that, according to Moody’s Ultimate Recovery Database (URD) data, the LGD for senior unsecured increases from 53% to 63%. The bank chooses to increase its LGD by 10% for all rating buckets. Table 3.3 presents the balances and the stressed parameters for the bank’s wholesale portfolio. We are assuming no new business and are not taking into account migration between the two years.
The two-year cumulative loss rate comes out to be 7.44% with these assumptions.
| Rating bucket | Balance | Stressed LGD | First year stressed PD (%) | Second year stressed PD (%) |
| 1 | 100 | 60% | 0.02 | 0.00 |
| 2 | 200 | 60% | 0.03 | 0.02 |
| 3 | 400 | 70% | 0.04 | 0.03 |
| 4 | 500 | 70% | 0.25 | 0.20 |
| 5 | 100 | 80% | 1.85 | 1.50 |
| 6 | 200 | 80% | 8.00 | 8.50 |
| 7 | 500 | 90% | 25.00 | 20.00 |
A simple example, continued: EC/VaR
In the implementation of EC models, banks commonly use a Merton model framework to simulate the defaults and credit quality. In this framework, asset returns are simulated using a factor model framework, and default occurs when the simulated asset value is below a threshold (generally tied to the leverage of the borrower) at the one-year horizon.
In a multifactor set-up, for a borrower i with default probability PD,
Zi < N−1 (PDi)
where
where Zi is a unit normal variable and GDP and unemployment are simulated values for the two macroeconomic factors. For credit quality, the simulated asset value (and, by extension, the simulated leverage) is used to impute a spread. It is common for the shock to the spreads to be modelled as a function of Zi as well. Banks generally generate the asset values using a correlation matrix using correlations between industries and countries.
Banks run these simulations a number of times, sort the losses from the draws, and arrive at the 99th or 99.9th percentile of the loss distribution as the 99th or 99.9th percentile VaR. The loss for the stress test may correspond to one of the losses, and can allow the user to roughly gauge the severity of the stress test.
USE OF VAR MODELS IN STRESS TESTS
The VaR models provide a mechanism for computing loss via:
Loss = PD× LGD× EAD
One approach that some institutions have taken is to assess where the losses based on stress tests lie in the loss distribution used in the VaR/EC estimation. This process has been one mechanism to associate probability with a given hypothetical or historical stress scenario. Going one step further, some institutions have also used such mechanisms to tie together scenarios across disparate lines of business. As an example, if a scenario’s loss magnitude translates into a 90th percentile loss on the loss distribution for VaR, the bank may take the 90th percentile loss in the EC model as an approximation to the stressed loss for market risk.
No financial institution can be run with zero risk tolerance, nor can all sources of risk be eliminated. However, clearly some losses are unacceptable because of their magnitudes, irrespective of the scenarios. For such losses, the likelihood (or probability) of the scenario is not that material. Nevertheless, for most scenarios the output tends to be used as the loss in that scenario and the likelihood of that scenario.
The assignment of probability via “matching” the stressed loss to a point on the loss distribution serves the useful purpose of coming up with the probability of that scenario. Since, for the practical implementation of stress tests in risk management, assignment of probabilities to the outcomes is important, the probability arrived via the loss distribution can help make the stress tests more actionable.33 Action triggers (when actions need to be taken) for stress tests can be tied to the output – ie, if the losses exceed a certain level. Alternatively, they can be tied to the input – ie, if the realised input into a test is below/above a threshold. For example, a stress test can involve a scenario for GDP growth, and if GDP growth in a quarter is below a trigger (such as ?2%), actions can be taken.
STRESSED CALIBRATION OF VALUE AT RISK MEASURES
Another approach to incorporating stress into risk measurement methodologies has been the use of stressed inputs. There have been quite a few variants. This has been particularly useful in the market risk area. The incorporation of stress into the risk measurement as well as capital metrics has occurred in both the supervisory approaches and the many banks’ internal approaches.
On the supervisory approaches, the market risk rule requires banks to use stressed inputs – ie, the revisions to the market risk capital framework (BCBS, 2011a) states:
In addition, a bank must calculate a “stressed value-at-risk” measure. This measure is intended to replicate a value-at-risk calculation that would be generated on the bank’s current portfolio if the relevant market factors were experiencing a period of stress; and should therefore be based on the 10-day, 99th percentile, one-tailed confidence interval value-at-risk measure of the current portfolio, with model inputs calibrated to historical data from a continuous 12-month period of significant financial stress relevant to the bank’s portfolio.
The revisions to the market risk capital framework also explicitly require the use of stress tests: “Banks that use the internal models approach for meeting market risk capital requirements must have in place a rigorous and comprehensive stress-testing programme”.
Similarly, in the revisions to Basel III (BCBS, 2011b), stressed parameters are required:
To determine the default risk capital charge for counterparty credit risk as defined in paragraph 105, banks must use the greater of the portfolio-level capital charge (not including the CVA charge in paragraphs 97–104) based on effective EPE [expected positive exposure] using current market data and the portfolio-level capital charge based on effective EPE using a stress calibration. The stress calibration should be a single consistent stress calibration for the whole portfolio of counterparties.
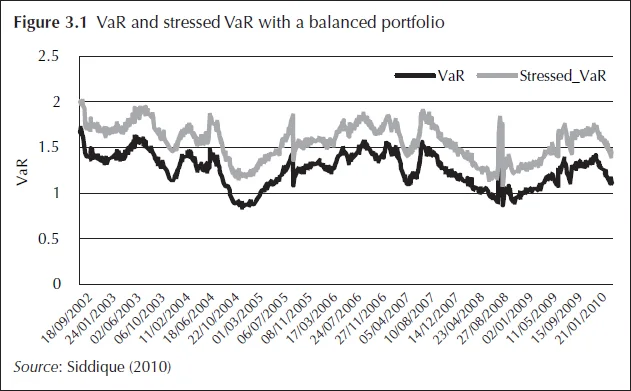
As an illustration, we present below some results from Siddique (2010), with six risk factors to simulate the exposures. These are: (i) three-month Libor (LIBOR3M); (ii) the yield on BAA-rated bonds (BAA); (iii) the spread between yields on BAA– and AAA–rated bonds (BAA–AAA); (iv) the return on the S&P 500 index (SPX); (v) the change in the volatility option index (VIX); and (vi) contract interest rates on commitments for fixed rate first mortgages (from the Freddie Mac survey) (MORTG). MORTG is in a weekly frequency that is converted to daily data through imputation using a Markov chain Monte Carlo. There are a total of 2,103 daily observations for the period January 2, 2002, to May 10, 2010.
With Monte Carlo, the stressed VaR as 99.9th percentile of a distribution of profit and losses (P&Ls) generated using stressed parameters can be constructed. Two separate sets of moments, (1) using the previous 180 days or 750 days history of the risk factors; and (ii) the stress period (180 days or 750 days ending on June 30, 2009), are used to simulate the risk factors. The 99.9th percentile of the portfolio value is then the 99.9th regular VaR or stressed VaR based on which sets of moments are used. Figure 3.1 illustrates VaR and stressed VaR with a balanced portfolio.

Stressed inputs are also used in the capital charge for credit valuation adjustment (CVA), as mentioned above. To assess the impact of the use of stressed inputs for those metrics, Siddique (2010) carries out some other simulations whose results are presented in Figure 3.2.
Two separate periods are used to compute the stressed calibration: (i) 180 days ending on September 30, 2008; and (ii) 180 days ending on June 30, 2009. The impact of a stressed calibration appears in the early period in the data, where the CVA VaR is substantially higher than the unstressed (regular) CVA VaR. However, in the latter period the unstressed and stressed VaR are identical. It is important to note that an incorrect stress period (ie, ending on September 30, 2008) can actually produce VaR lower than an unstressed CVA VaR.
There are both advantages and disadvantages of such stressed risk metrics. An obvious advantage is that, with capital for unexpected losses taking into account stressed environments, capital should be adequate when the next stress or shock occurs – that is, a risk metric with a stressed input is usually going to be more conservative. However, given that the inputs are always stressed, the risk metric will no longer be responsive to the current market conditions, but primarily depend on the portfolio composition. Only time will tell what the final impact of the incorporation of stress-testing elements into risk management and capital adequacy metrics will be.


CONCLUSION
Stress testing has played a very large role in the assessment of capital adequacy. It has always played a role in risk management as well, which has become much larger as a result of the 2007–09 financial crisis. However, banks have continued to use other risk management tools, such as VaR. Nevertheless, stress testing has influenced those tools, and they have also been used in stress testing.
The views expressed in this chapter are those of the authors and do not reflect the views or policies of the Federal Reserve or Office of the Comptroller of the Currency or the US Department of the Treasury or Fordham University. The views in this chapter also do not establish supervisory policy, requirements, or expectations.
References
Basel Committee on Banking Supervision, 2011a, “Revisions to the Basel II Market Risk Framework”, BIS, February (available at http://www.bis.org/publ/bcbs193.pdf).
Basel Committee on Banking Supervision, 2011b, “Basel III: A Global Regulatory Framework for More Resilient Banks and Banking System”, BIS, June (available at http://www.bis.org/publ/bcbs189.pdf).
Hull, J., 2012, Risk Management and Financial Institutions (3e) (New York: Wiley Books).
Siddique, A., 2010, “Stressed Versus Unstressed Calibration”, manuscript, Office of the Comptroller of the Currency.
Only users who have a paid subscription or are part of a corporate subscription are able to print or copy content.
To access these options, along with all other subscription benefits, please contact info@risk.net or view our subscription options here: http://subscriptions.risk.net/subscribe
You are currently unable to print this content. Please contact info@risk.net to find out more.
You are currently unable to copy this content. Please contact info@risk.net to find out more.
Copyright Infopro Digital Limited. All rights reserved.
As outlined in our terms and conditions, https://www.infopro-digital.com/terms-and-conditions/subscriptions/ (point 2.4), printing is limited to a single copy.
If you would like to purchase additional rights please email info@risk.net
Copyright Infopro Digital Limited. All rights reserved.
You may share this content using our article tools. As outlined in our terms and conditions, https://www.infopro-digital.com/terms-and-conditions/subscriptions/ (clause 2.4), an Authorised User may only make one copy of the materials for their own personal use. You must also comply with the restrictions in clause 2.5.
If you would like to purchase additional rights please email info@risk.net

