
Brexit or Bremain: looking for clues in bubble analysis
Crisis analysis model suggests rates and credit markets see danger

Marco Bianchetti, Intesa Sanpaolo, financial and market risk dept, and Università di Bologna; Davide Galli, Università degli Studi di Milano, physics dept; Camilla Ricci, Intesa Sanpaolo, financial and market risk dept; Angelo Salvatori, Università degli Studi di Milano, physics dept; and Marco Scaringi, Università degli Studi di Milano, physics dept
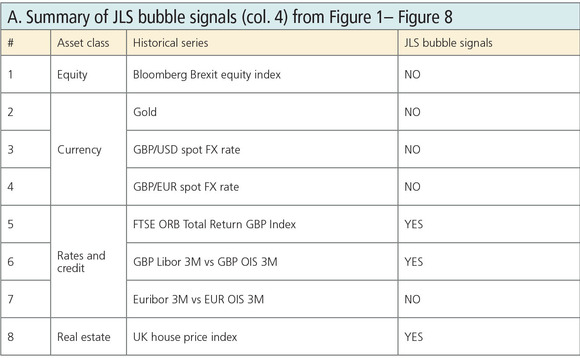
The UK's referendum on membership of the EU has triggered intense speculation about the market impact of a vote to leave. To shed some light on the market's own expectations, we applied the Johansen-Ledoit-Sornette (JLS) model to a selection of financial markets that are sensitive to the results of the referendum, in an attempt to detect possible bubbles and crashes across a range of asset classes (references [1]-[4], below).
Our study suggests equity and currency markets do not expect crashes or violent rallies following the referendum results, implying market participants anticipate the UK will vote to stay – the so-called Bremain scenario.
The rates and credit markets consider the referendum a risky event, however, expecting either a Bremain or a Brexit scenario along with a central bank intervention. In the case of real estate, a crash is expected, but its relationship with the referendum results is questionable.
Brexit or Bremain?
Forecasting the result of the referendum, given the apparent parity between the two camps – and the high percentage of undecided voters – is clearly a very challenging task, with a high error probability.
There are three main sources of forecast data: opinion polls; bookmaker betting odds; and market data. We applied a forecasting methodology based on the JLS model, developed in the 1990s at ETH Zürich by Didier Sornette and co-authors (see [1]–[4] and references therein).
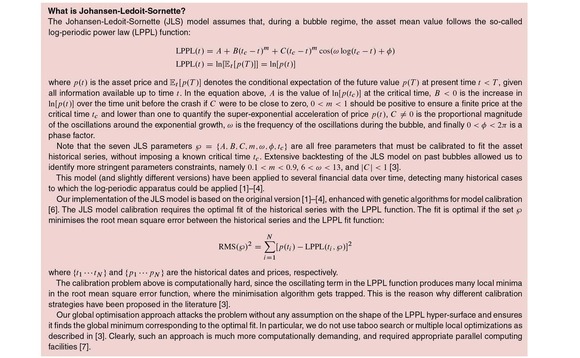
The JLS model is extensively applied to detect bubbles, crashes and crises in many fields – and a fuller, more technical overview of the approach can be found at the end of this article (see box, What is Johansen-Ledoit-Sornette?).
Overall, the JLS model describes the dynamics of a system with a growing instability, generated by the behaviour of investors and traders that create positive feedback in the valuation of assets, leading to unsustainable growth and culminating with a finite-time singularity at some future critical time tc, which is interpreted as the forecast of a possible crash.
We applied the JLS model to a selection of historical financial series. For each, we ran multiple model calibrations with different calibration windows, and detected possible bubble signals, corresponding to possible critical times tc. Such bubble signals were accepted or rejected according to the constraints discussed at the end of this article. This procedure ensures the stability of the observed results.
Interpreting the JLS bubble signal is crucial. The theory behind the JLS model states that if investors in some asset expect a future event – for example, the UK referendum – that could have a negative impact on that asset, for example Brexit, then this may trigger a dynamic leading to a bubble regime, possibly followed by a crash. Reversing the argument, if one detects bubble signals for an asset and knows how a future event will affect the asset price, then one can infer the investors expect a negative scenario for that asset.
Translating this into the context of the UK referendum, if one detects bubble signals for an asset with a critical time tc around June 23, and knows Brexit or Bremain are negative/positive scenarios for that asset, respectively, one can conclude investors are expecting Brexit. Equally, if one knows Bremain or Brexit are negative/positive scenarios for the asset, respectively, one can conclude investors are expecting Bremain.
Figure 1:
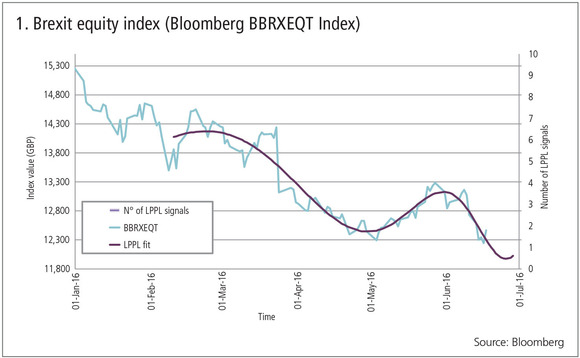
Source: Brexit Equity Index (Bloomberg BBRXEQT Index). A basket of 10 UK stocks designed to reflect UK exposure to the EU across different sectors. Data up to Friday June 17, 2016.
Comments: The historical series shows a decreasing trend, but no super-exponential behaviour and instabilities typical of bubble regime. In fact, the JLS model (LPPL fit) does not show valid bubble and crash signals.
Interpretation: Market participants are currently suspicious about the UK stock market, but do not actually fear either a crash following Brexit or a surge following Bremain.
Figure 2:
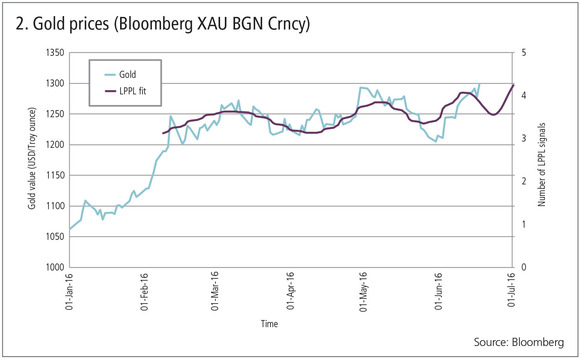
Source: Gold prices (Bloomberg XAU BGN Crncy). Data up to June 17.
Comments: The historical series shows an increasing trend, but no super-exponential behaviour and instabilities typical of bubble regime. Again, the JLS model (LPPL fit) does not propose valid bubble and crash signals.
Interpretation: Market participants are currently moving into gold as a safe haven, but do not fear either a surge following Brexit or a crash following Bremain. This result is consistent with the BBRXEQT observations above and the GBP/USD foreign exchange rate observations below.
Figure 3:
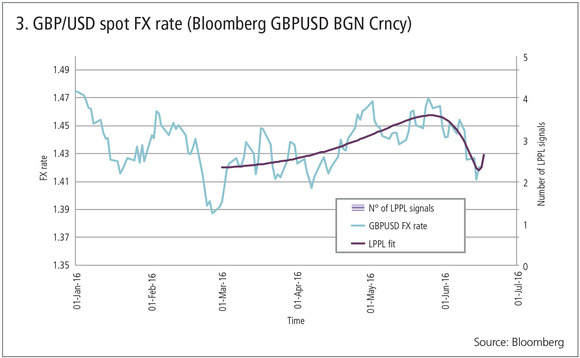
Source: GBP/USD foreign exchange rate (Bloomberg GBPUSD BGN Crncy). Data up to June 17.
Comments: The historical series shows an erratic trend, no super-exponential behaviour and instabilities typical of bubble regime. In fact, the JLS model (LPPL fit) does not propose valid bubble and crash signals.
Interpretation: Again, market participants do not fear a big gap up or down following the referendum. This result is consistent with the BBRXEQT and GBP/USD forex rate observations.
Figure 4:
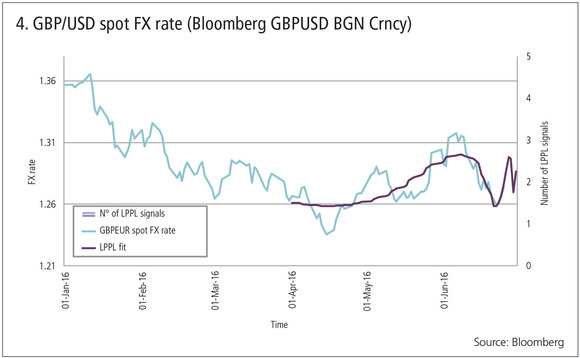
Source: GBP/EUR forex rate (Bloomberg GBPEUR BGN Crncy). The data is up to June 17.
Comments: As for GBP/USD.
Interpretation: As for GBP/USD.
Figure 5:
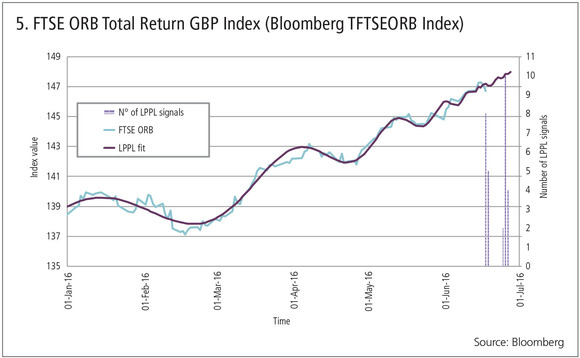
Source: FTSE ORB Total Return GBP Index (Bloomberg TFTSEORB index), includes sterling-denominated fixed-coupon corporate bonds trading on the London Stock Exchange across different industry sectors and maturity bands. The data is up to June 17.
Comments: The historical series shows an upward trend, driven by the falling sterling Libor rate, not fully compensated by the increasing sterling credit spreads. It also shows super-exponential growth and instabilities typical of a bubble regime. In fact, the JLS model (LPPL fit) proposes several valid crash signals around June 23 (counted by the histograms shown on the right-hand scale).
Interpretation: Market participants consider the referendum a risky event for corporate bonds, implying either a victory for remain, or a Bank of England intervention in the case of Brexit.
Figure 6:
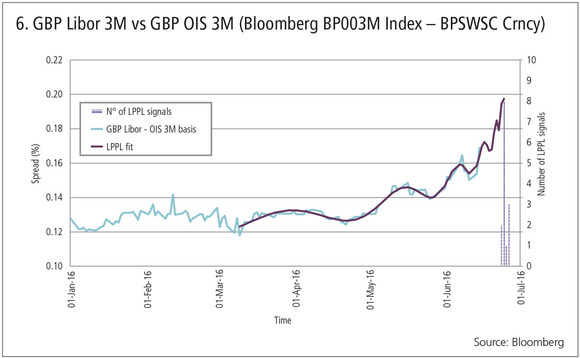
Source: Three-month sterling Libor vs three-month sterling overnight index swaps. (Bloomberg BP003M Index - BPSWSC Crncy). This measures the London interbank credit and liquidity risk over a three-month time horizon relative to overnight. The data is up to June 17.
Comments: The historical series shows super-exponential behaviour and instabilities typical of a bubble regime. In fact, the JLS model (LPPL fit) implies valid bubble and crash signals around June 24.
Interpretation: Market participants expect the basis spread will crash back to lower values, corresponding to lower credit and liquidity risk in the London interbank market. This result is consistent with the FTSE ORB observations.
Figure 7:
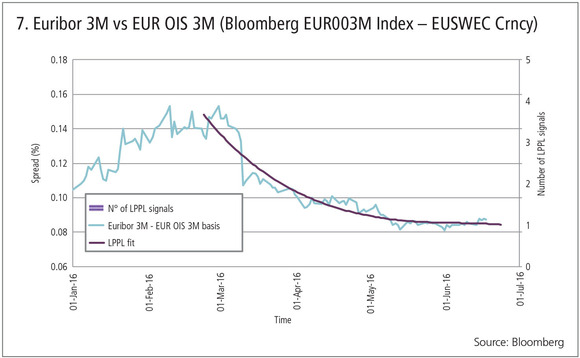
Source: Three-month Euribor versus three-month Eonia (Bloomberg EUR003M Index - EUSWEC Crncy). This measures euro interbank credit and liquidity risk on a three-month time horizon relative to overnight. The data is up to June 16.
Comments: The historical series shows a decreasing trend but no super-exponential behaviour and instabilities typical of bubble regime. In fact, the JLS model (LPPL fit) does not propose valid bubble and crash signals.
Interpretation: Market participants do not fear a crash following a Brexit, possibly due to an expected intervention by the European Central Bank, or a surge following a Bremain vote.
Figure 8:
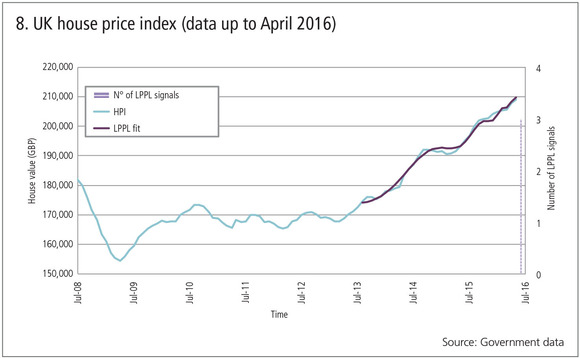
Source: UK house price index (HPI). The data is up to April 2016 (this data is updated with a delay, however).
Comments: The historical series shows an increasing trend with super-exponential behaviour and instabilities typical of a bubble regime. The JLS model (LPPL fit) does propose valid bubble and crash signals around June.
Interpretation: The trend is reminiscent of those observed during the 2008 subprime crisis. Market participants expect a crash, but its relationship with the referendum is questionable, since the growth regime started before the current Brexit/Bremain context, and more recent UK HPI data would be needed to establish a clear connection.
Conclusions
Using the JLS model, it is possible to conclude market participants do not expect crashes or violent rallies in the equity and currency markets following the referendum results, thus suggesting a victory for the Remain camp.
In the sterling rates and credit markets, market participants consider the referendum a risky event for the London market, implying either a Bremain scenario or a Brexit scenario with central bank intervention. The Euribor-Eonia basis, though, does not show contagion effects.
In the real-estate market, market participants expect a crash, but it is harder to conclude that this is tied to the referendum results.
Click here to enlarge, or tap image on app
References
[1] D Sornette: Dragon-kings, black swans and the prediction of crises, Swiss Finance Institute Research Paper, no 09-36, 2009.
[2] A Johansen, O Ledoit and D Sornette: Crashes as critical points, International Journal of Theoretical and Applied Finance, vol 3, no 02, pp 219-255, 2000.
[3] P Geraskin, D Fantazzini: Everything You Always Wanted to Know about Log Periodic Power Laws for Bubble Modelling but Were Afraid to Ask, Feb 1, 2011, SSRN working paper.
[4] D Sornette, R Woodard, W Yana, W Zhou: Clarifications to questions and criticisms on the Johansen-Ledoit-Sornette financial bubble model, Physica A 392 (2013) 4417-4428.
[5] ETHZ Financial Crisis Observatory
[6] A Salvatori: Stochastic Models for Self-Organized Criticality in Financial Markets, Msci Physics Thesis, Università degli Studi di Milano, Mar 2016.
[7] Parallel Computing and Condensed Matter Simulations Lab, physics dept, Università degli Studi di Milano,
[8] Opinion polls: see for example Wikipedia
[9] Bookmakers betting odds: see for example Oddschecker
[10] Bloomberg, Brexit watch indicators
[11] UK house price index
Disclaimer and acknowledgments
The views and opinions expressed in this document are those of the authors and do not represent the opinions of their employers. They are not responsible for any use that may be made of these contents. The opinions, forecasts or estimates included in this document strictly refer to the document date, and there is no guarantee that future results or events will be consistent with the present observations and considerations. This document is written for informative purposes only, it is not intended to influence any investment decisions or promote any product or service. The authors gratefully acknowledge Luca Lopez for fruitful discussion and analysis at the early stage of this work.
Only users who have a paid subscription or are part of a corporate subscription are able to print or copy content.
To access these options, along with all other subscription benefits, please contact info@risk.net or view our subscription options here: http://subscriptions.risk.net/subscribe
You are currently unable to print this content. Please contact info@risk.net to find out more.
You are currently unable to copy this content. Please contact info@risk.net to find out more.
Copyright Infopro Digital Limited. All rights reserved.
As outlined in our terms and conditions, https://www.infopro-digital.com/terms-and-conditions/subscriptions/ (point 2.4), printing is limited to a single copy.
If you would like to purchase additional rights please email info@risk.net
Copyright Infopro Digital Limited. All rights reserved.
You may share this content using our article tools. As outlined in our terms and conditions, https://www.infopro-digital.com/terms-and-conditions/subscriptions/ (clause 2.4), an Authorised User may only make one copy of the materials for their own personal use. You must also comply with the restrictions in clause 2.5.
If you would like to purchase additional rights please email info@risk.net
More on Market risk
Repo and FX markets buck year-end crunch fears
Price spike concerns ease as September’s surprise SOFR jump led to early preparations for bank window dressing
Market risk solutions 2023: market and vendor landscape
A Chartis Research report that examines the structural shifts in enterprise risk systems and the impact of regulations, as well as the available technology.
The new rules of market risk management
Amid 2020’s Covid-19-related market turmoil – with volatility and value-at-risk (VAR) measures soaring – some of the world’s largest investment banks took advantage of the extraordinary conditions to notch up record trading revenues. In a recent Risk.net…
ETF strategies to manage market volatility
Money managers and institutional investors are re-evaluating investment strategies in the face of rapidly shifting market conditions. Consequently, selective genres of exchange-traded funds (ETFs) are seeing robust growth in assets. Hong Kong Exchanges…
FRTB spurs data mining push at StanChart
Bank building “single golden source” of trade data in a bid to lower NMRF burden
Asian privacy laws obstruct FRTB data pooling efforts
Bank scepticism and regulatory hurdles likely to inhibit cross-border information sharing
Seizing the opportunity of transformational change
Sponsored Q&A: CompatibL, Murex and Numerix
Doubts grow over US FRTB implementation
Fragmented roll-out would price European banks “out of the market”


