Vol control indexes rewire for V-shaped rebounds
Dealers aim to fix sluggish performance of indexes that underpin $130 billion-a-year FIA market

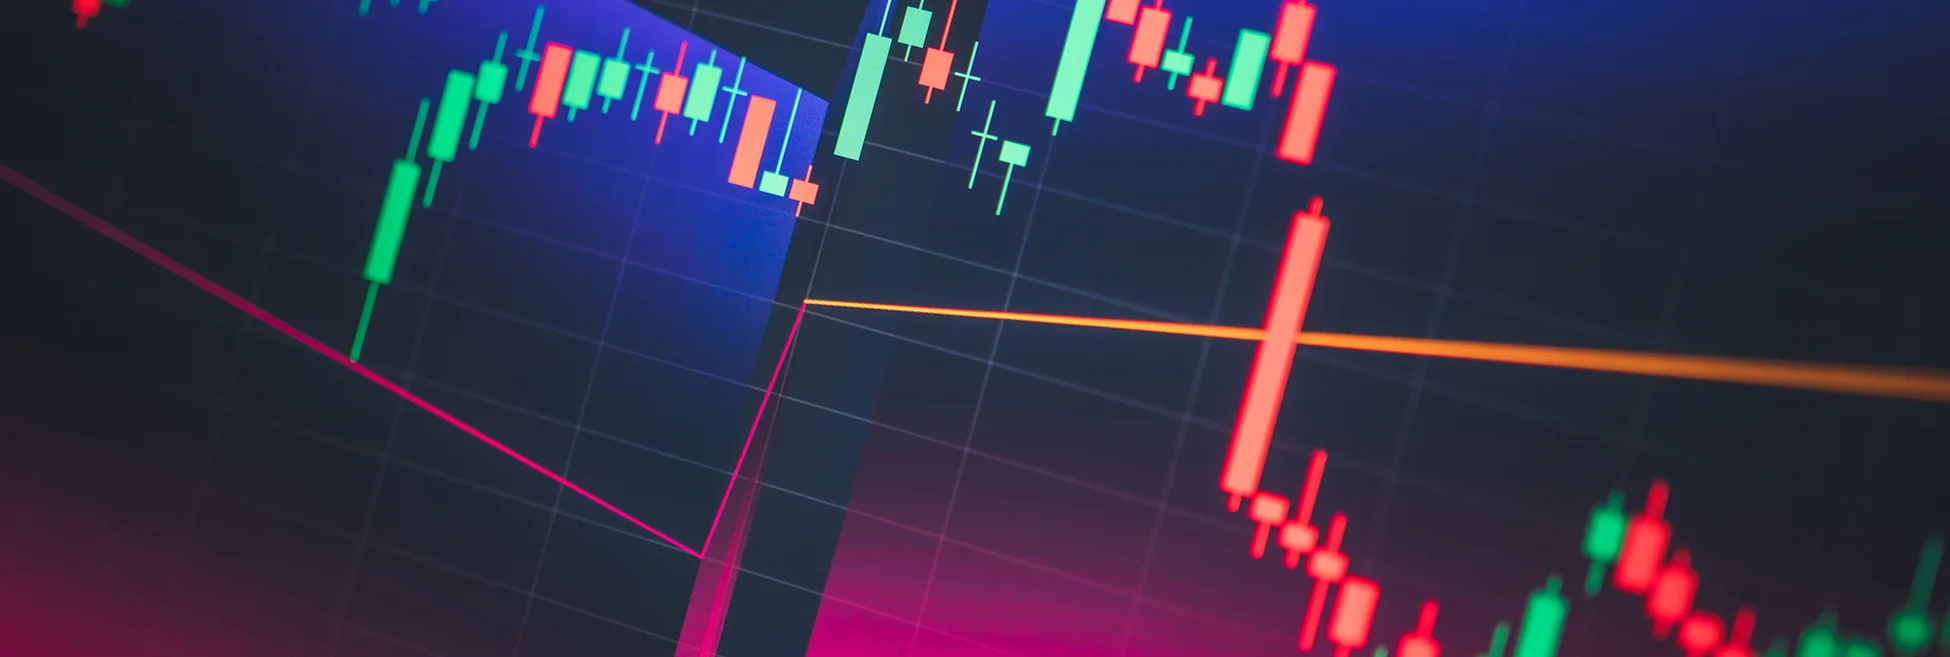
Last April’s Liberation Day announcement sent the S&P 500 tumbling 12% in four days. A subsequent pause on tariffs saw the market claw back losses in just nine. This March, the conflict in Iran dragged the index down 8%. Just two weeks later it was marking new highs.
These V-shaped rebounds have become a regular feature of markets amid policy flip-flops and buy-the-dip retail enthusiasm.
For
Only users who have a paid subscription or are part of a corporate subscription are able to print or copy content.
To access these options, along with all other subscription benefits, please contact info@risk.net or view our subscription options here: http://subscriptions.risk.net/subscribe
You are currently unable to print this content. Please contact info@risk.net to find out more.
You are currently unable to copy this content. Please contact info@risk.net to find out more.
Copyright Infopro Digital Limited. All rights reserved.
As outlined in our terms and conditions, https://www.infopro-digital.com/terms-and-conditions/subscriptions/ (point 2.4), printing is limited to a single copy.
If you would like to purchase additional rights please email info@risk.net
Copyright Infopro Digital Limited. All rights reserved.
You may share this content using our article tools. As outlined in our terms and conditions, https://www.infopro-digital.com/terms-and-conditions/subscriptions/ (clause 2.4), an Authorised User may only make one copy of the materials for their own personal use. You must also comply with the restrictions in clause 2.5.
If you would like to purchase additional rights please email info@risk.net
More on Markets
Treasury basis trade loses its allure as returns shrink
Tight spreads and rising funding costs are pushing the cash-futures basis trade out of favour

How vol eruption blew up Goldman’s rates book
Dealers were short payer skew from corporate and hedge fund flows. Then came the Iran war.

XTX Markets’ US sales head joins rival IMC Trading
Benjamin Klixball takes up new role at Dutch prop trader in New York

Hong Kong biotech: from niche exposure to broader product ecosystem
Hong Kong’s biotech market is maturing from a niche thematic allocation into a broader capital markets proposition

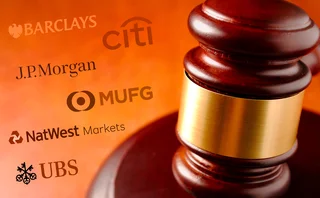
Doubts swirl over future of FX cartel case
Group of banks accused of manipulation have filed for the class action to be dismissed
Liquidity on Kalshi, Polymarket ‘too thin’ for institutional use
Patchy trade flows cause outsize market impact for financial events, research from Risk.net shows

Is alt data betting on prediction markets?
While offering a rich source of new data, legal uncertainties remain

Deutsche Bank takes on custodians with automated FX service
Bank claims integration of HausFX with BlackRock’s Aladdin can help cut costs by up to 90%