Swaps data: cleared volumes and CCP market share
Data shows CME and Eurex growing faster than LCH Swapclear

All in all, it’s been a topsy-turvy first quarter of 2019. The US Federal Reserve first paused and then ultimately halted its rate rises. Meanwhile, after a series of bruising votes, the chances of an orderly Brexit hang by a thread.
Those machinations have pulled global swap volumes in opposing directions. Cleared US dollar swap volumes are down 14% on a year ago, while euro swaps volumes are 35% higher.
Looking at the market share of clearing houses, a different theme emerges. While LCH continues to dominate both US dollar and euro interest rate swap clearing, its rivals are gaining ground.
Cleared US dollar swaps
Let’s start with the largest product: cleared US dollar interest rate swaps. We include all clearable types – vanilla fixed versus float, overnight index, basis, zero coupon and variable – and look at single-sided gross notional volumes.
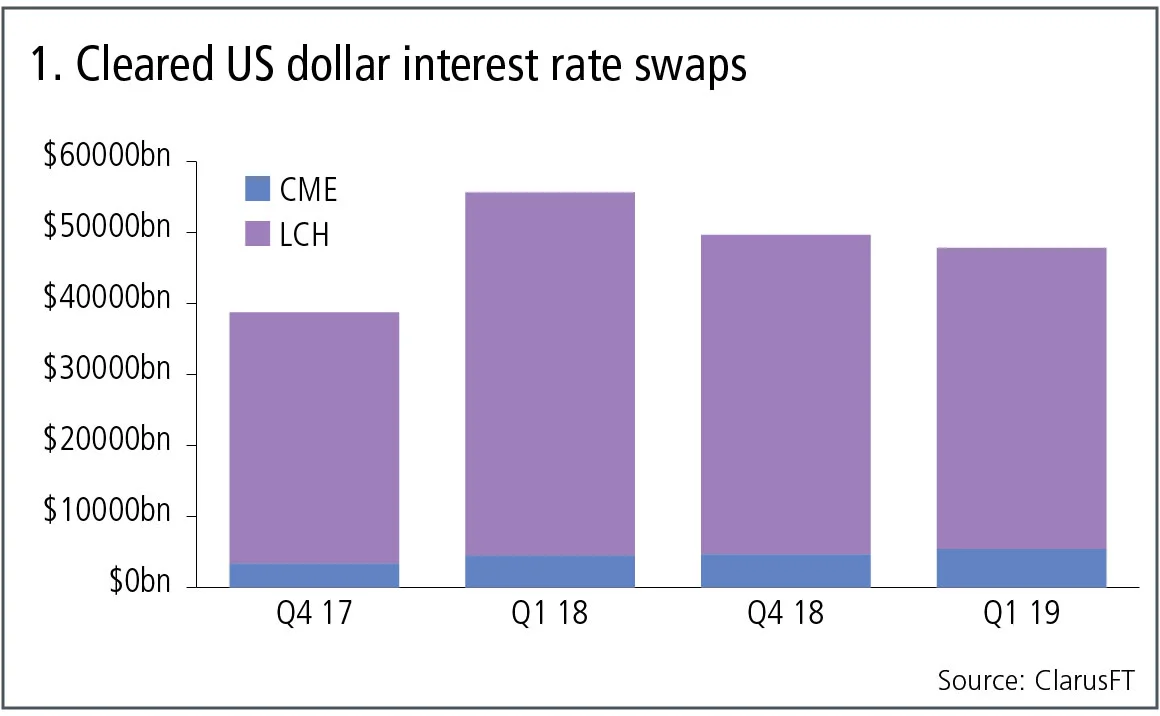
Figure 1 shows:
- Q1 2019 volumes at $48 trillion are 14% lower than the $55.5 trillion in Q1 2018, a very different trend to Q4 2018, which was much higher than Q4 2017.
- LCH SwapClear with 89% share and CME with 11%, in the most recent quarter.
- LCH SwapClear is down 17% from a year earlier, February 2019 was a particularly low month.
- CME is up 20% in the most recent quarter from a year earlier.
The halt in Federal Reserve rate rises for 2019, has certainly resulted in lower US dollar swaps volume at LCH, while CME has bucked the trend with an up quarter.
Cleared euro swaps
Next, the second-largest product: cleared euro interest rate swaps, all clearable types.
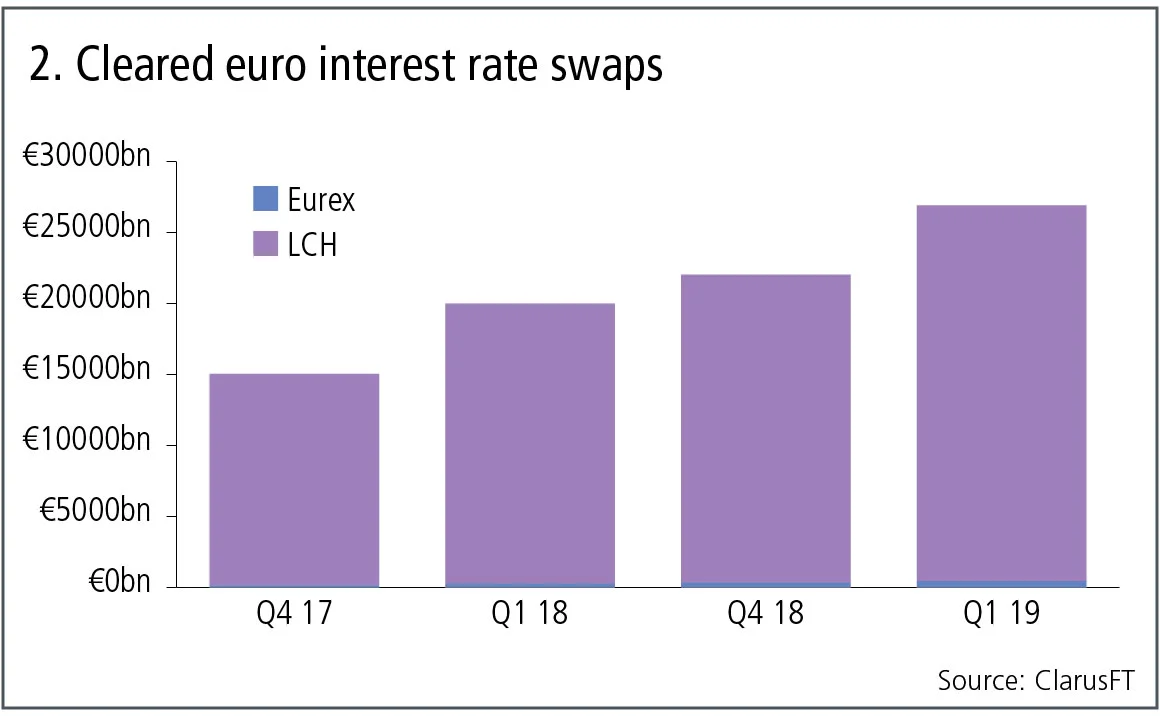
Figure 2 shows:
- Q1 2019 volumes at €27 trillion ($30 trillion) are 35% higher than the €20 trillion in Q1 2018.
- LCH SwapClear with 98.3% share and Eurex with 1.7% in the most recent quarter.
- LCH SwapClear up 34% in Q1 2019 from a year earlier.
- Eurex up 83% in Q1 19 with €454 billion of single-sided gross notional.
LCH SwapClear continues its dominance in euro swap volumes, but with Eurex growing at more than double the rate from a low base.
Cleared yen swaps
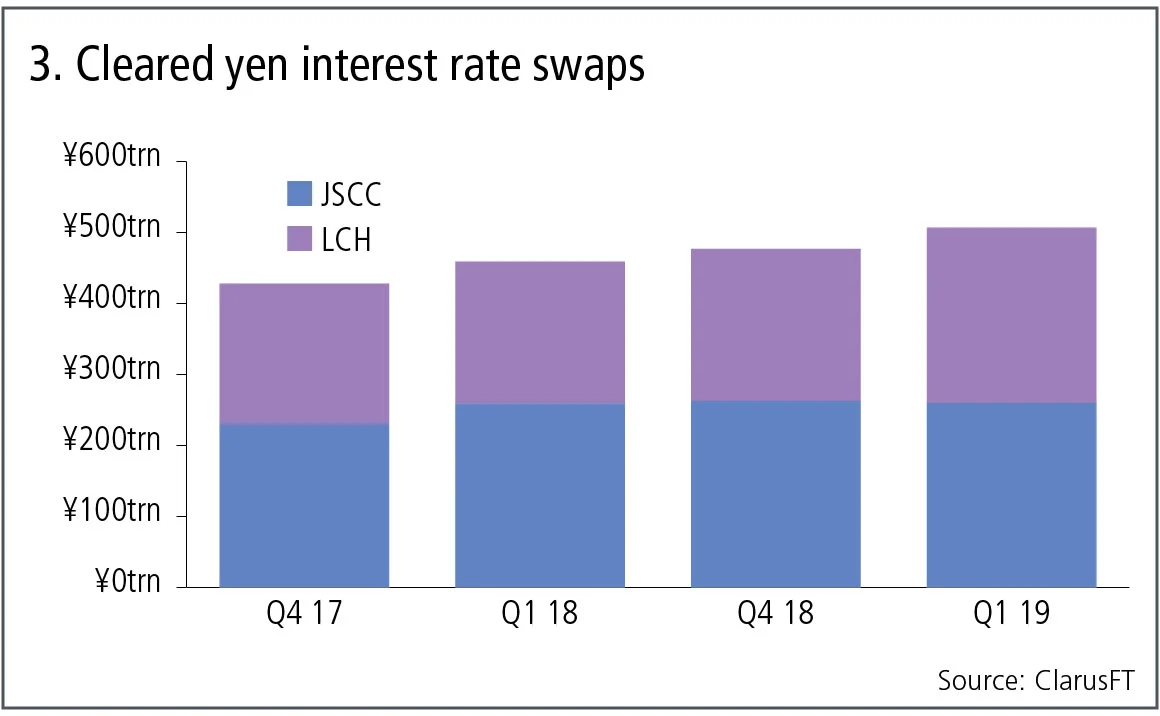
Figure 3 shows:
- Q1 2019 at ¥507 trillion ($4.56 trillion) is 11% higher than the ¥459 trillion a year earlier.
- JSCC with 51% share and LCH SwapClear with 49% in the most recent quarter, which is a 4% shift in LCH’s favour compared to Q4 2018.
- JSCC volume in the most recent quarter is the same as a year earlier.
- LCH is up 24% in Q1 2019 from a year earlier.
So, continuing growth in cleared yen swaps with market share evenly split between JSCC and LCH.
Cleared US dollar credit default swaps
Let’s now switch focus to credit derivatives and the volume of credit indexes and single names in US dollars.
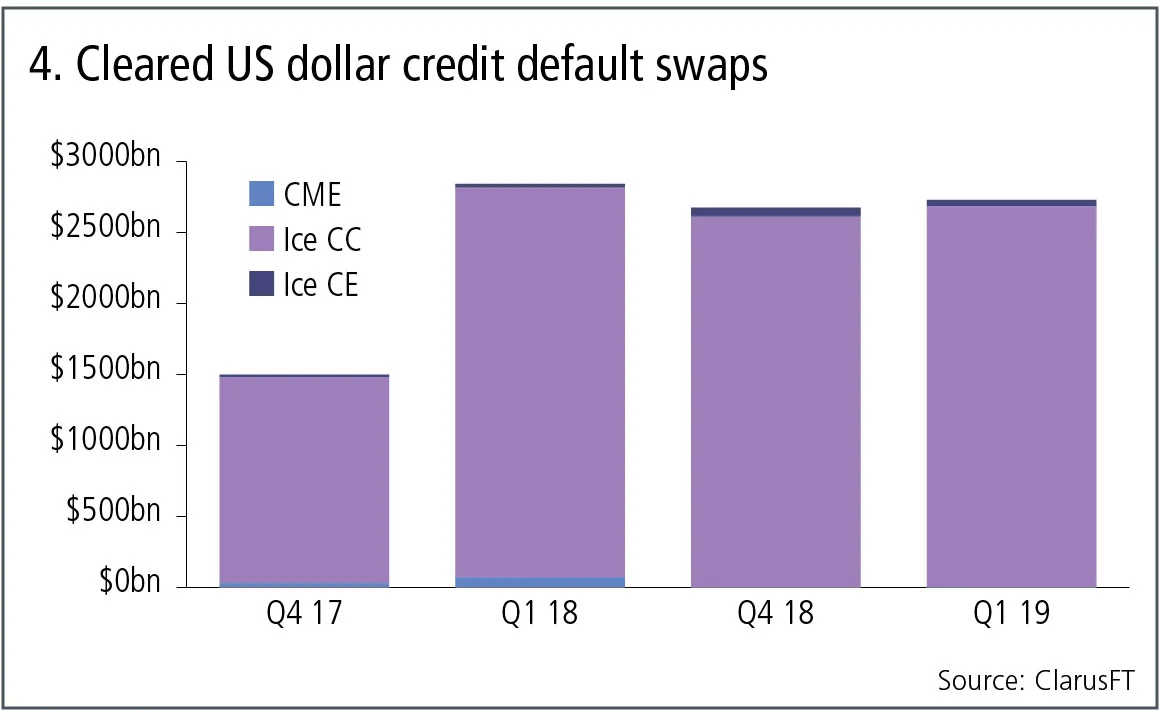
Figure 4 shows:
- Q1 2019 volumes at $2.7 trillion are 4% lower than the $2.8 trillion in Q1 2018, a very different trend to Q4 2018, which was much higher than Q4 2017.
- Ice Credit Clear dominates with 98% share.
- Ice Clear Europe is up from a year earlier with $46 billion in Q1 2019.
- CME shutting down its service.
- LCH CDS with $3 billion in Q1 2019.
Cleared credit derivatives volumes in US dollars slightly down in the most recent quarter.
Cleared euro credit default swaps
Next, the volume of credit indexes and single names in euro.
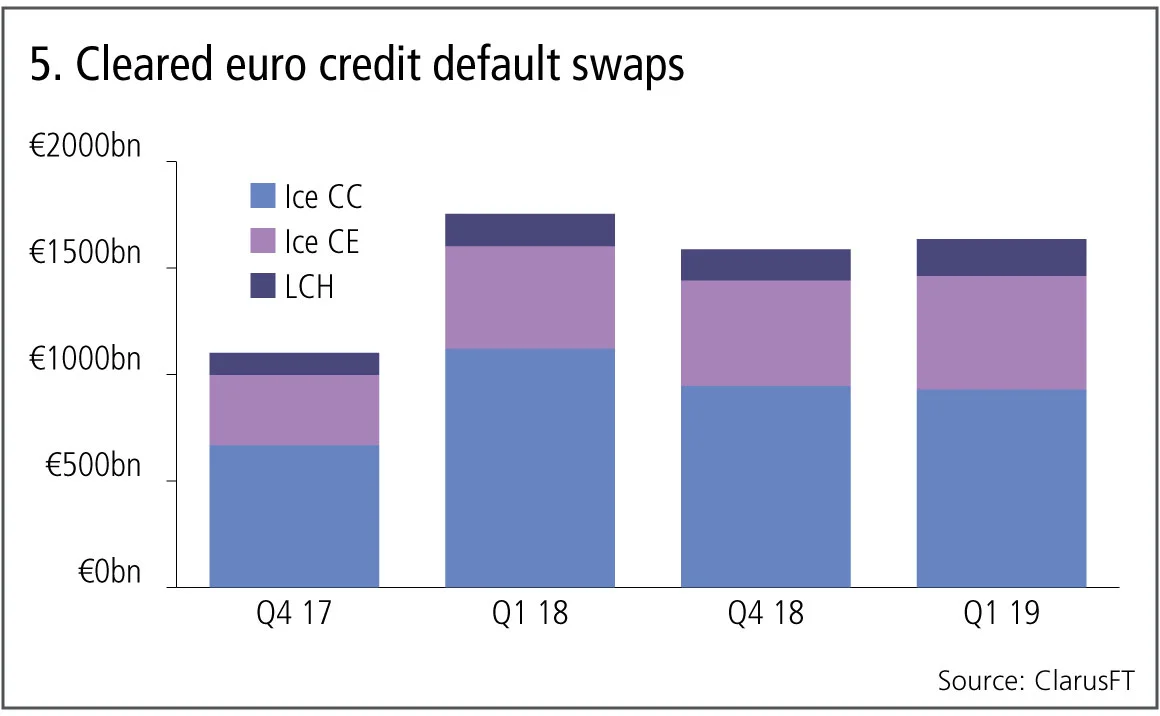
Figure 5 shows:
- Q1 2019 volumes at €1.65 trillion are 7% lower than the €1.75 trillion in Q1 2018, a very different trend to Q4 2018, which was much higher than Q4 2017.
- Ice Credit Clear with 56.8% share, Ice Clear Europe 32.6% and LCH CDSClear with 10.6% in the most recent quarter.
- Ice Credit Clear down 17% from a year earlier.
- Ice Clear Europe up 11% and LCH CDSClear up 13%.
Cleared credit derivatives volumes in euros is slightly down in the most recent quarter.
Cleared non-deliverable forwards
Finally cleared non-deliverable forwards.
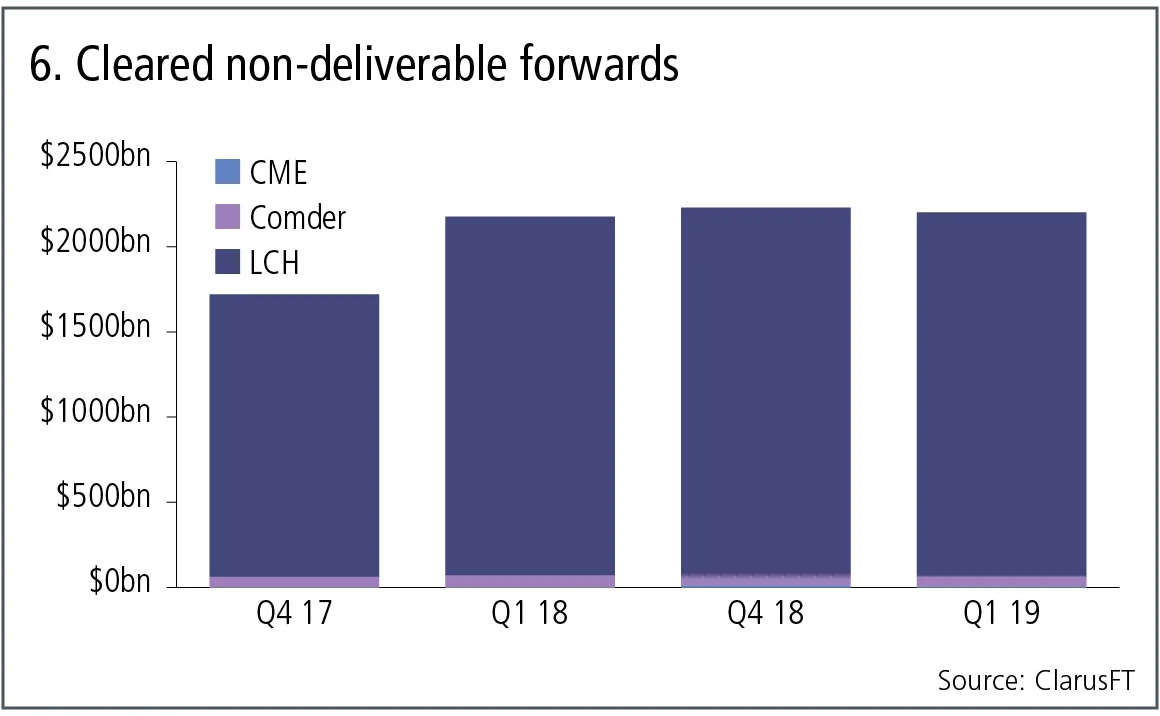
Figure 6 shows:
- Q1 2019 volumes at $2.2 trillion are 1% higher than Q1 2018,
- a very different trend to Q4 2018, which was 30% higher
- than Q4 2017.
- LCH ForexClear with 97.1% share in the quarter.
- Comder with 2.7%.
- CME with volume from Q4 18 onwards, with $5 billion in Q1 19 for a 0.2% share in the quarter.
Cleared non-deliverable forwards volumes no longer show their long-running trend of high growth rates. Is this a pause before a further ramp-up later in the year when phase four of the uncleared margin rules takes effect in September 2019? Or will we have to wait until the lead-up to September 2020 and phase five of the UMR for the next growth spurt in non-deliverable forward volumes?
Only time will tell.
Amir Khwaja is chief executive of Clarus Financial Technology.
コンテンツを印刷またはコピーできるのは、有料の購読契約を結んでいるユーザー、または法人購読契約の一員であるユーザーのみです。
これらのオプションやその他の購読特典を利用するには、info@risk.net にお問い合わせいただくか、こちらの購読オプションをご覧ください: http://subscriptions.risk.net/subscribe
現在、このコンテンツを印刷することはできません。詳しくはinfo@risk.netまでお問い合わせください。
現在、このコンテンツをコピーすることはできません。詳しくはinfo@risk.netまでお問い合わせください。
Copyright インフォプロ・デジタル・リミテッド.無断複写・転載を禁じます。
当社の利用規約、https://www.infopro-digital.com/terms-and-conditions/subscriptions/(ポイント2.4)に記載されているように、印刷は1部のみです。
追加の権利を購入したい場合は、info@risk.netまで電子メールでご連絡ください。
Copyright インフォプロ・デジタル・リミテッド.無断複写・転載を禁じます。
このコンテンツは、当社の記事ツールを使用して共有することができます。当社の利用規約、https://www.infopro-digital.com/terms-and-conditions/subscriptions/(第2.4項)に概説されているように、認定ユーザーは、個人的な使用のために資料のコピーを1部のみ作成することができます。また、2.5項の制限にも従わなければなりません。
追加権利の購入をご希望の場合は、info@risk.netまで電子メールでご連絡ください。
詳細はこちら 市場
Isda’s Basel III playbook: speak softly and carry a big QIS
Scott O’Malia on capital reforms, repo markets and tokenised collateral

LCHとASX、オーストラリアのレポ清算事業に注視
債券ブームにより資金調達需要が高まる中、CCPがディーラーと協議を進めています

ネオクリア、ユーロ建てスワップの清算業務をめぐる競争に参入
パリに拠点を置く中央清算機関が、2027年のサービス開始を計画し、ユーレックスやLCHに挑む
スタッフの大量離職により、LMAXのFXスワップ取引プラットフォームに疑問の声が
FX HedgePoolから移籍してきた9名以上の幹部が同社を去りました――中にはCEOのジェイ・ムーア氏の名前も

ドルのドーシードー:ヘッジ業者たちが為替相場の動きを分析
イラン情勢の混乱を受け、米ドルが一時的に安全資産としての地位を取り戻したことで、実需投資家はヘッジ取引を一時中断しています
中東危機によりVKOへの需要が再燃した――一風変わった形で
株式投資家は、2022年の最良のヘッジ手段とルックバック・オプションを組み合わせることで、不安と楽観のバランスを取っています

小規模な債券ファンドが、巨額のソブリンCDS取引という主流から外れる
カウンターパーティ・レーダー:ボストン・マネジメント・アンド・リサーチは、より限定された発行体群に対して、ヘッジを重視した大規模なポジションを構築しています

GenAIの時代において、未だに優れたモデルが必要なのはなぜなのか?
ジャン=フィリップ・ブショー氏は、モデルが人工知能をレジームシフトの過程で導き、過学習から遠ざけることができると述べています