
This article was paid for by a contributing third party.More Information.
Whitepaper: Options strategies in grain
By Steven Stasys and Dominic Sutton-Vermeulen
Across the grains complex options strategies are heavily utilized by both hedgers and liquidity providers in a multitude of approaches. Options can provide cost-effective directional coverage and allow for flexibility. Within options, the growth and proliferation of option spread strategies has grown steadily, today accounting for just over 50% of all grain options volume executed at CME Group. Since the migration to CME Globex in 2012, electronically executed option spread strategies have grown over 2,200%. This paper will seek to explore some of the overall trends driving the growth of options strategies and look at the differentiating characteristics between the most utilized strategies in Corn, Soybeans, and Wheat using trade volume data from 2017, 2018, and 2019.
Figure 1: Option Spread Strategy Volume as a Percent of Total Volume
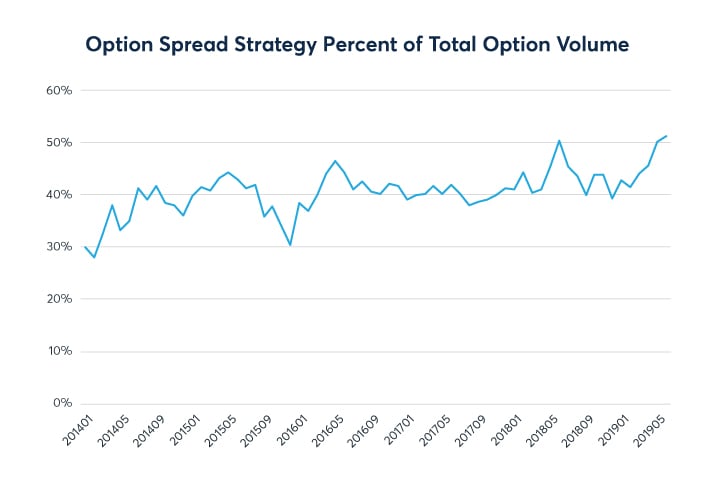
Source: CME Group
Outright vs spread option strategy
While an outright represents an option that is bought or sold individually without the simultaneous placement of an offsetting hedge, an option spread strategy represents an options position that involves buying or selling multiple strikes and or expirations on the same commodity. Utilized in the proper manner, option spread strategies provide market participants with added flexibility, lower cost, and more specified risk management characteristics when compared to outright strategies. Globex has the ability to enter option spreads as one order through the Request for Quote (RFQ) functionality.
Who uses option spread strategies?
A broad spectrum of customers use Agricultural option spreads. Depending on volatility levels and time of year, certain strategies may become more popular to optimize risk/reward profiles and mitigate risk. The rise of option analytical tools such as QuikStrike have allowed customers to build, view, and test option spreads making it easier for new traders to understand option spreads.
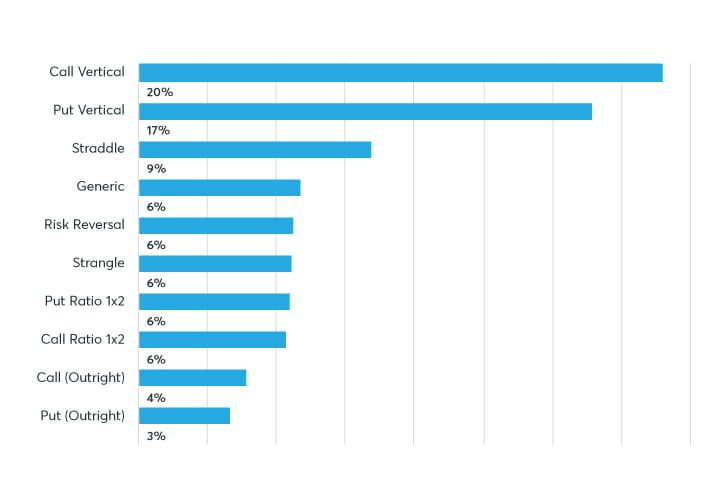
Figure 2: Top 10 Corn Option Spread Strategies

Source: CME Group
Corn:
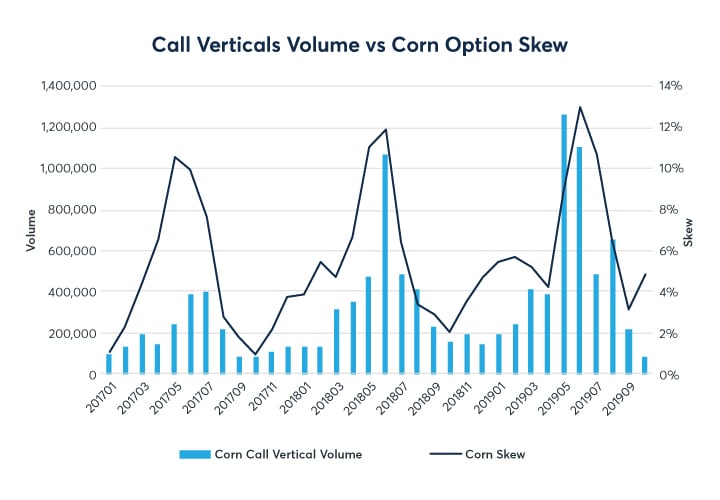
Representing 82% of total options spread volume from 2017 through 2019, the most popular spread strategies include put/call verticals, put/call ratios, straddles, risk reversals, strangles, horizontal straddles and covered calls. Of these, call verticals make up the greatest proportion of Corn options volume. Call verticals offer hedgers and traders an opportunity to take on defined risk, while allowing for upward mobility in price movement. For example, a call vertical can be used to take a bullish position in the market with a defined maximum profit and loss.
For more information on this strategy type and similar option spreads, please visit CME Group’s Option Strategy course.
Relative to Soybeans and Wheat, Corn call verticals make up a significantly larger proportion of total option spread strategy volumes. One difference that could account for this is the implied volatility (IV) profile or skew seen in Corn options. Options skew compares the implied volatility of a call to the implied volatility of a put with both the call and put being the same distance away from the current price of the underlying.
Corn has historically seen a large call skew leading to low delta (1-20) calls exhibiting a higher implied volatility compared to equal distant puts or at-the-money option. Higher implied volatility of lower delta calls directly impacts the risk-reward profile of a Call Vertical strategy. In Corn, call vertical activity showed a strong correlation to the North America growing season when call skew historically is at its peak.
As seen in Figure 3, the average call skew over the last 10 years has the 15 delta call at a 7% higher implied volatility compared to a 15 delta put around May and June. Looking at 2017 versus 2018 and 2019, call vertical volumes were almost double that of put vertical volumes in Corn options.
Figure 3: Corn Skew from 2017 through 2019 and 3-year Average Grain Complex Skew Seasonality
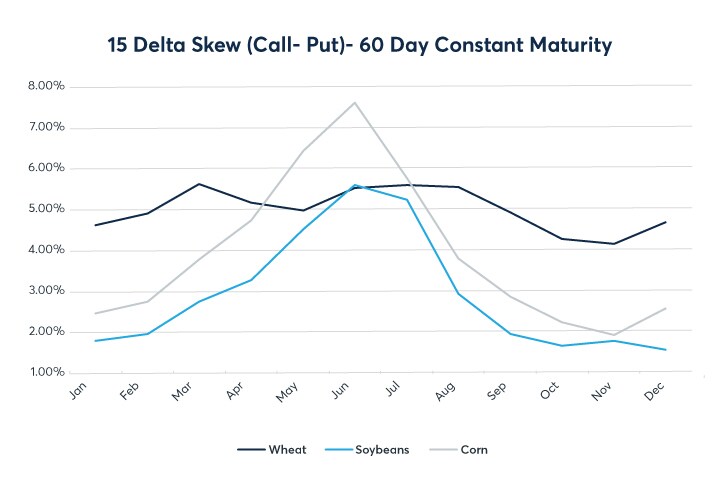
Source: Quikstrike
Last year’s 2019 US corn crop was marked by turbulence due to poor weather conditions and record prevented planting numbers coupled with trade war headlines happening during non-US hours. This resulted in record spread option volume as market participants from around the world accessed the market to manage their risk related to market events. Non-US spread volumes accounted for almost 20% of total spread volumes and 10% of total option volumes in the summer of 2019, demonstrating an increased demand and utilization for these strategies under volatile market conditions from overseas market participants.
Figure 4: Corn Option Spread Strategy Volume

Source: CME Group
Soybeans:
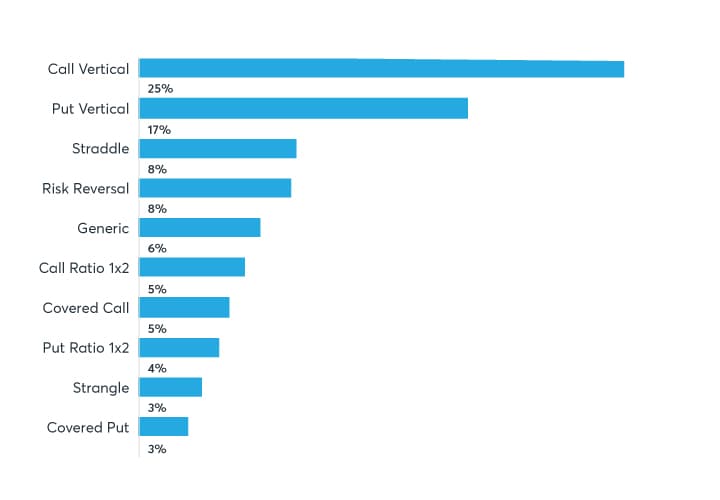
Figure 5: Top 10 Soybean Option Spread Strategies
Source: CME Group
Accounting for 84% of total option spread volume from 2017 through 2019, the most popular Soybean option spread strategies include put/call verticals, straddles, risk reversals, strangles, put/call ratios, horizontal straddles, and covered calls. Similar to Corn option volume, call verticals are the single most popular strategy in Soybean options. However, unlike Corn options, Soybean put verticals volume is almost equivalent to call vertical volume. Put verticals, like call verticals, offer market participants the ability to participate in upward or downward price movement at a known level of risk in for a limited return.
Figure 6: Historic Soybean Put Vertical Volume versus Soybean Futures Price

Source: CME Group
While the overall price movement of corn has been bullish since beginning of 2017, facing record harvests and poor marketing conditions due to the US-China Trade War, the price of soybeans over the same period decreased roughly 18%. In times of heightened volatility and large bearish price movement in soybeans, such as Q1 2017, Q3 2018, and Q1 2019, put verticals outweighed call verticals as a percentage of total Soybean spread strategy volumes.
Wheat:
Figure 7: Top 10 Wheat Option Spread Strategies
Source: CME Group
Representing 83% of total Wheat option spread volume from 2017 through 2019, the most popular option spread strategies include put/call verticals, straddles, risk reversals, put/call ratios, covered calls/puts, and strangles. Similar to Corn and Soybeans, vertical strategies make up the lion’s share of total Wheat option spread volume. However, tying for third, risk reversals are ranked much higher in Wheat and make up almost double the proportion of total option spread volume when compared to the other two markets. A long risk reversal involves purchasing an out of the money call and selling an out of the money put, a short risk reversal involves selling the call and buying the put.
Independently, the strategy is directional in nature given the payoff scenarios of both the long and short option positions if the market moves in the desired direction. The strategy can also be a very effective hedge to protect an underlying futures or cash position. While one option is bought and the other is sold, the exposure to unfavorable price movement is mitigated in exchange for limited profitability giving traders a defined pricing window. In an ideal situation the trader can use this strategy to lock in a favorable position, while the purchased option acts as a “stop loss” order. The premium from the written or short option is used to fund the purchase of the long option making the strategy possibility premium neutral or a small debit or credit depending on which strike prices are used and the put/call skew.
Looking at the skew profile of Wheat relative to Corn and Soybean options, the call skew seems to have less seasonality factors with the 15 delta call typically trading around 5% above a 15 delta put throughout the year. Market structure of the underlying may help explain consistently upward skew as food buyers, millers, and processors could be regularly more willing to pay premiums for extreme upside protection, using out-of-the-money (OTM) calls, than producers are to pay for downside protection throughout the year in Wheat. The years 2017, 2018 and 2019 all saw Soft Red Winter Wheat (SRW) production, the underlying commodity of Chicago Wheat (ZW), historically small, resulting in tight SRW availability and record SRW cash premiums in the US.
With over 33% of total Wheat spread option volume having a delta-hedged component versus 19% in Corn and 17% in Soybeans, covered spread option volume in Wheat also stands out relative to the other grains. A delta hedge is a way of managing the directional risk by taking a position in the underlying future. The position in the underlying has the effect of reducing the options exposure to directional risk and or making the position directionally neutral. With less exposure to directional risk, the options position takes on higher exposure to volatility. Traders who trade on volatility do not worry about the direction of price-moves, only how much the price of an instrument will move in the future i.e. volatility. Taking a closer look at the delta distribution in covered OZW Call Verticals data shows a concentration around the 20-delta strike seen in Figure 9. A similar 20-delta profile was observed in Wheat put verticals volume.
Figure 8: Covered Spread Option Volume – Wheat vs. Corn vs Soybeans, and Wheat Vertical Call Option Delta Distribution


Source: CME Group
Conclusion
It should be emphasized that these results are sensitive to the sample period and going forward the relationships and characteristics exhibited in the dataset could look very different than they did over the past few years. Nevertheless, as options spread strategies continue to proliferate throughout the agricultural markets and become an increasingly utilized instrument in the hedger’s toolkit, it would be worth noting how implied volatility, skew, and underlying fundamentals impact some of the strategies discussed above.
For more information and further insights on option strategies. please visit CME Group’s Options Strategy course.
Sponsored content
Copyright Infopro Digital Limited. All rights reserved.
As outlined in our terms and conditions, https://www.infopro-digital.com/terms-and-conditions/subscriptions/ (point 2.4), printing is limited to a single copy.
If you would like to purchase additional rights please email info@risk.net
Copyright Infopro Digital Limited. All rights reserved.
You may share this content using our article tools. As outlined in our terms and conditions, https://www.infopro-digital.com/terms-and-conditions/subscriptions/ (clause 2.4), an Authorised User may only make one copy of the materials for their own personal use. You must also comply with the restrictions in clause 2.5.
If you would like to purchase additional rights please email info@risk.net