
Credit data: a sharp turning point in CCP credit risk
The credit risk of CCPs is worsening, even as margin requirements rise, writes David Carruthers

For anyone who shudders at the mere thought of a clearing house failure, the latest bank-sourced data from Credit Benchmark could make for uncomfortable reading.
After improving by more than 5% from November 2017 to September 2019, the credit risk of 30 central counterparties (CCPs) reversed sharply at the end of last year. The 2.6% deterioration seen in October and November was the worst in two years, and compares with a drop of less than 2% following the default of power trader Einar Aas at Nasdaq Clearing in September 2018.
The sudden shift in sentiment defies easy explanation. CCPs have made a concerted effort to improve their risk management since the Nasdaq default, resulting in higher margin requirements and deeper liquidity buffers.
Following changes to its value-at-risk model for client clearing, required initial margin at LCH’s SwapClear service hit ₤145.1 billion ($189.6 billion) at the end of the third quarter of 2019, up 46% from a year ago. At Eurex and CME, initial margin was up 25% and 18%, respectively, over the same period.
Meanwhile, as Risk.net reported in January, the Japan Securities Clearing Corporation (JSCC) is making changes to its futures margin model that will result in higher margin requirements for clients with riskier positions.
All of this should make CCPs safer from a credit risk perspective. The data tells a different story.
That is not to say a default is on the cards. The credit risk of CCPs is notoriously hard to measure and often overstated. Still, the sudden deterioration in credit risk could be costly for banks that apply a credit valuation adjustment (CVA) charge to reflect the counterparty risk of centrally cleared trades.
This month, we also look at the credit risk of European Union banks and the healthcare and global technology industries.
Global credit industry trends
The latest consensus credit data shows credit activity for corporates and financials has slightly increased, with 4.6% of entities moving by at least one notch, compared with 4.3% last month. Figure 1 shows detailed industry migration trends for the most recent published data, adjusted for changes in contributor mix.
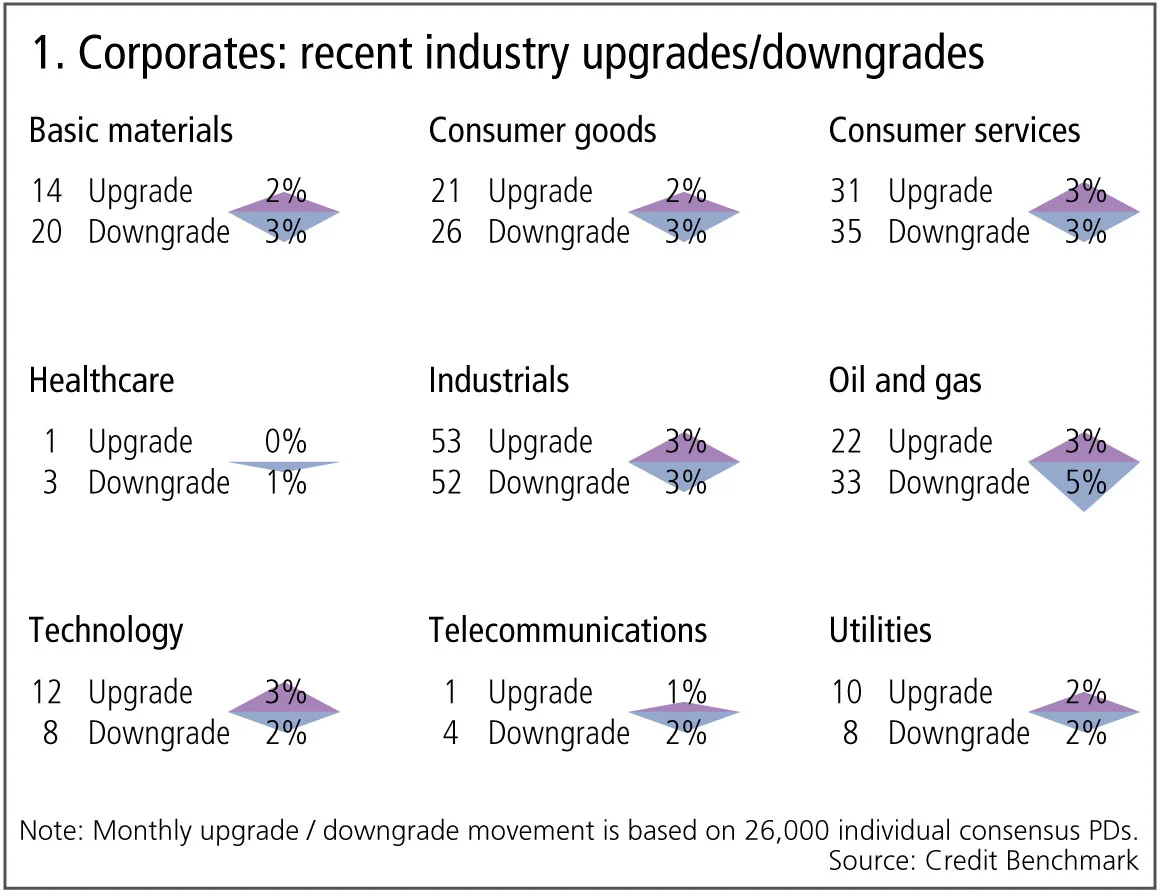
Figure 1 shows:
- Globally, corporate downgrades and upgrades are in balance.
- Upgrades outnumber downgrades in one of the nine industries, five industries are biased towards downgrades and three are in balance.
- Technology has more upgrades than downgrades, after four months of the opposite.
- Oil and gas and telecommunications see downgrades dominating for a third month.
- Basic materials and consumer goods return to downgrades outweighing upgrades after a period of balance.
- Healthcare shows volatility with downgrades now outnumbering upgrades.
- Consumer services are in balance for the third month.
- Industrials remain in balance for the second month.
- Utilities return to balance after two months of upgrades dominating.
Central counterparty clearing firms
There are currently more than 70 central counterparty (CCP) firms, ranging from global industry giant DTCC to specialised regional CCPs focused on specific sectors and derivatives types. The growing dominance of CCPs is a direct response to the systemic risks of derivatives trading that became apparent in 2008. Concerns that CCPs themselves are also a source of systemic risk come and go. A number of recent studies have attempted to map the shifting web of systemic connections between CCPs, seeking to answer the question “How sensitive is the CCP network to an individual CCP or CCP member failure?”.
Figure 2 shows the credit trend and distribution of 30 CCPs.
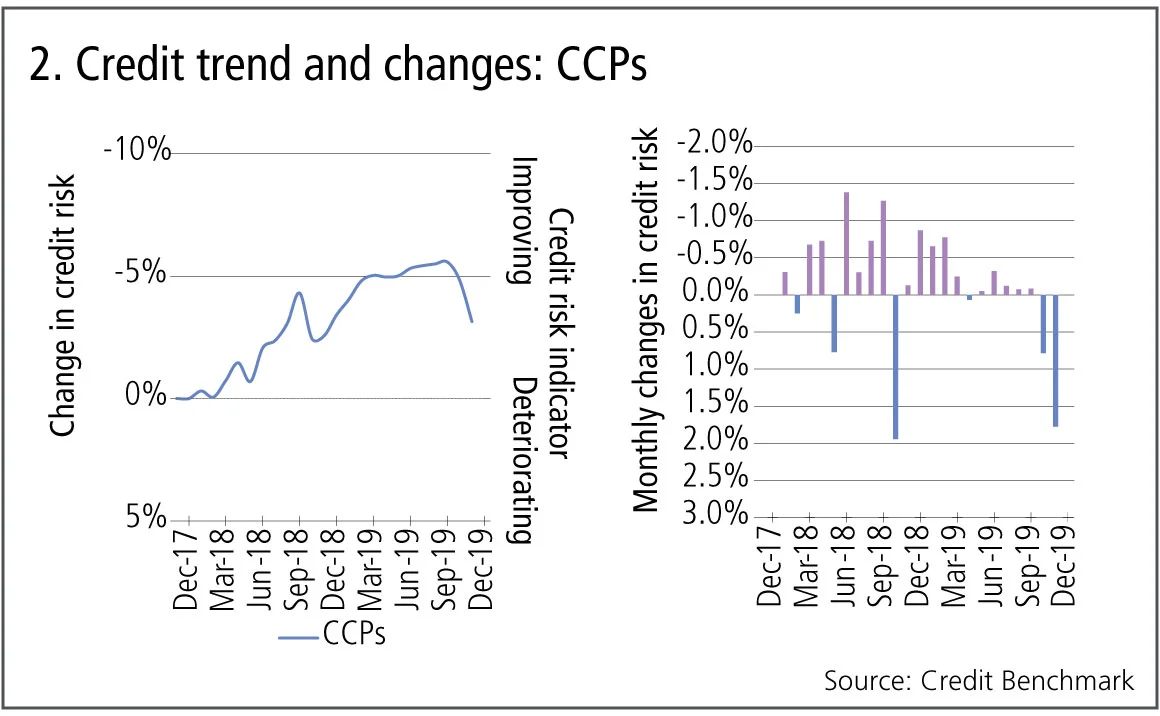
Figure 2 shows:
- Credit risk of CCPs improved by more than 5% from November 2017 to September 2019.
- In the past two months there has been a sharp turning point, with credit risk deteriorating by 2.6%.
- The right-hand chart shows these monthly changes, with positive momentum slowing from mid-2018. Since then, the size of improvements has gradually decreased, and the latest two months show large consecutive deteriorations.
EU banks
Most EU banks improved their capital ratios in 2019 but loan growth has been weak, reflecting the sluggish economy. EU bank shares also underperformed their US counterparts. Brexit is likely to create banking winners and losers across the EU, and this has been reflected in very mixed share price performances from UK and continental European bank shares.
Figure 3 shows the credit trends and distributions of 470 EU ex-UK and 140 UK banks.
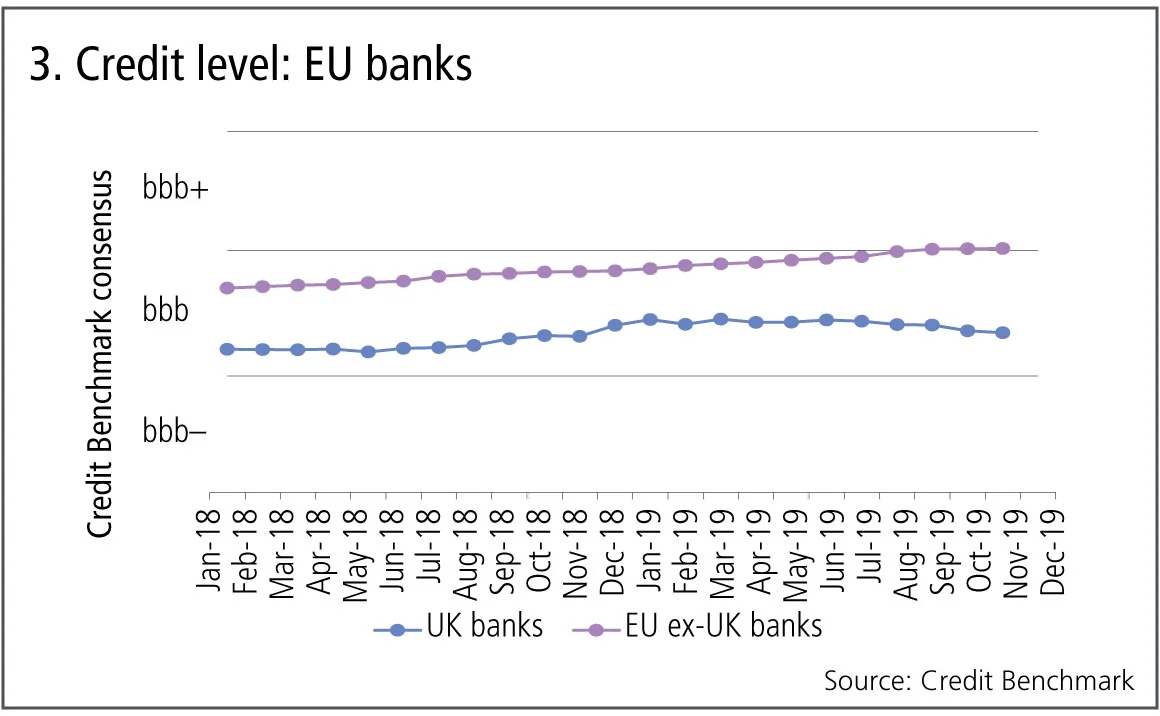
Figure 3 shows:
- EU ex-UK bank credit risk has been steadily improving since early 2018, but has stabilised in the past few months.
- The EU ex-UK bank average credit moved from bbb to bbb+ in September 2019.
- UK banks began to improve from May 2018, moving into the centre of the bbb category by the end of 2018.
- UK banks have given up some of these gains, deteriorating since January 2019.
US v UK healthcare
The US healthcare industry has a number of positive drivers: increasing longevity, the development of virtual care, a steadily rising population. But the drive for pricing transparency and increased competition will mitigate some of these. In the UK, the steady growth of private health spending has mitigated some of the impact on the healthcare industry of the relentless NHS focus on value.
Figure 4 shows the credit trend and distribution of 310 US and 160 UK healthcare companies.
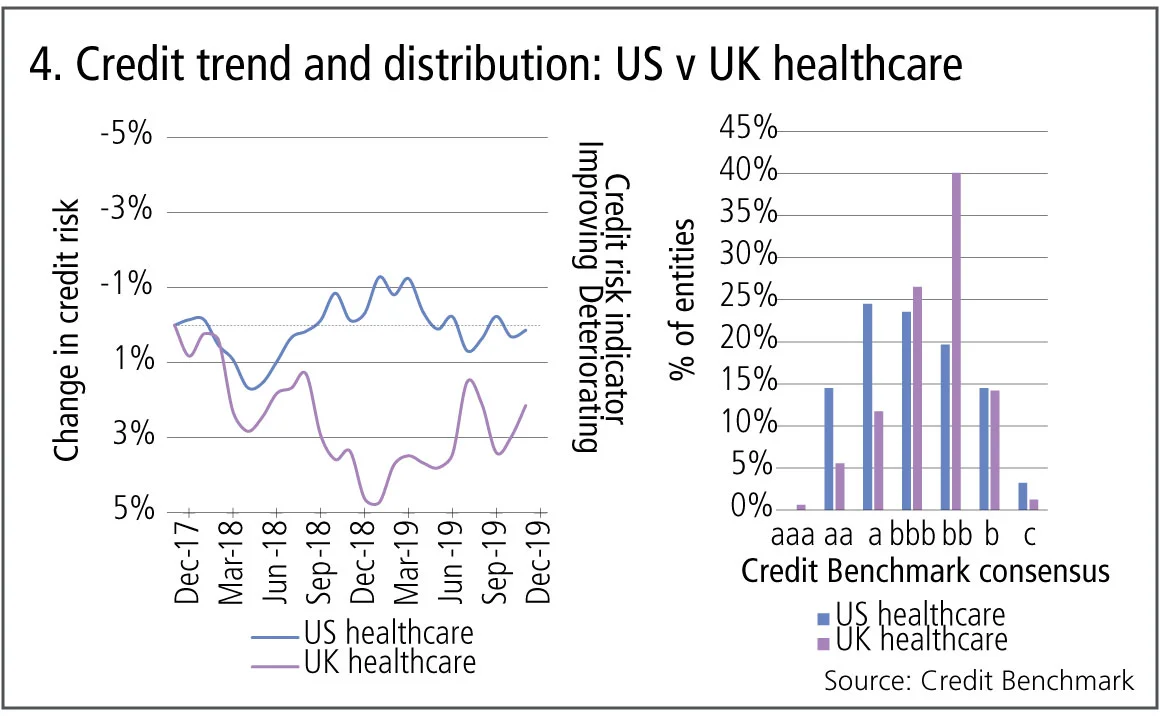
Figure 4 shows:
- Both US and UK healthcare show choppy credit risk trends within the last two years.
- UK healthcare had an overall deterioration throughout 2018, but saw recovery in 2019. US healthcare also saw an improvement in the second half of 2018, although this turned towards slight deterioration in the first half of 2019.
- The latest data shows an improvement in UK healthcare, while US healthcare is stable.
- Nearly two-thirds of US healthcare firms are investment grade, in comparison with 45% of UK firms; 40% of UK healthcare firms have a Credit Benchmark consensus of bb.
Global technology
Big tech has been an easy target for politicians in recent years, with criticisms based on anti-trust, tax avoidance and data abuse. The demand for new technology is exponentially growing, but individual businesses can quickly fall from grace if they make the wrong product decision or run into production delays. There is an increasing shift towards software as the main source of value add.
Figure 5 shows the credit trends and distributions for 615 global software and computer services companies and 250 global technology hardware and equipment companies.
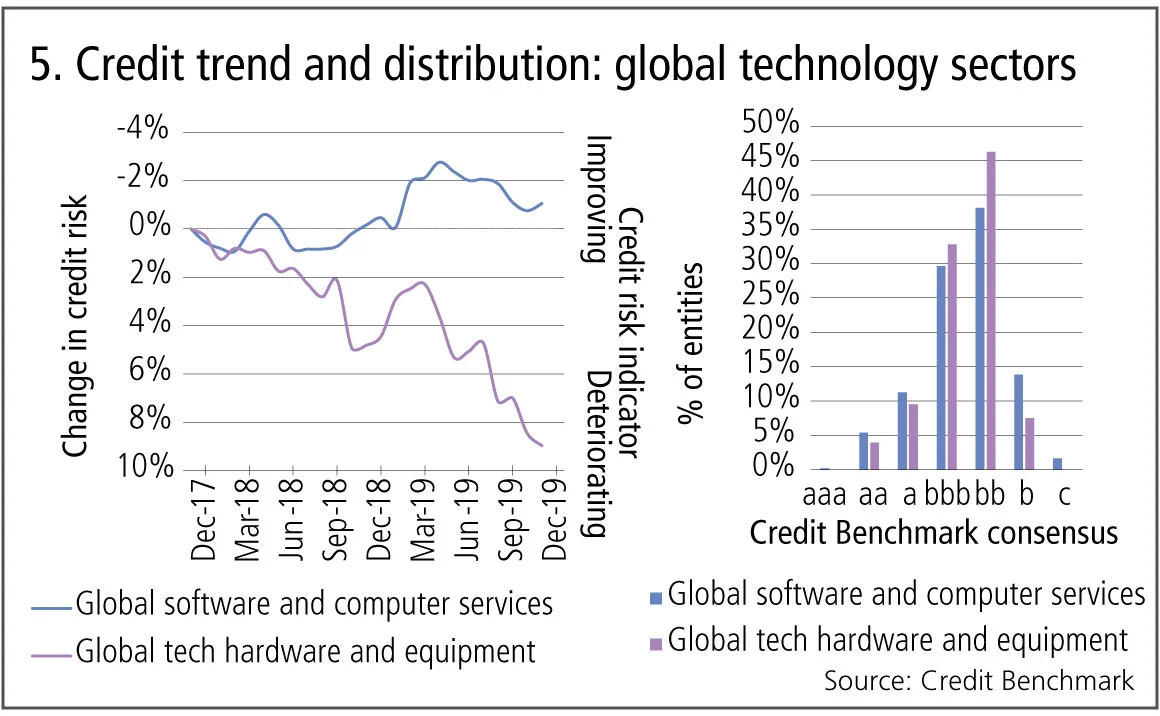
Figure 5 shows:
- Overall, global software and computer services companies show a slight credit improvement (1%) since November 2017. On the other hand, global technology hardware and equipment companies firms have seen a deterioration of nearly 10%.
- The two sectors have similar distributions; each has the same proportion (46%) of entities in investment grade. However, the distribution of software and computer services has a slightly greater spread.
About this data
Credit Benchmark collects monthly credit risk inputs from 40-plus of the world’s leading financial institutions, making it possible to follow credit trends across geographies and industries. In all, the dataset contains consensus ratings on about 50,000 rated and unrated entities globally.
David Carruthers is head of research at Credit Benchmark.
Only users who have a paid subscription or are part of a corporate subscription are able to print or copy content.
To access these options, along with all other subscription benefits, please contact info@risk.net or view our subscription options here: http://subscriptions.risk.net/subscribe
You are currently unable to print this content. Please contact info@risk.net to find out more.
You are currently unable to copy this content. Please contact info@risk.net to find out more.
Copyright Infopro Digital Limited. All rights reserved.
As outlined in our terms and conditions, https://www.infopro-digital.com/terms-and-conditions/subscriptions/ (point 2.4), printing is limited to a single copy.
If you would like to purchase additional rights please email info@risk.net
Copyright Infopro Digital Limited. All rights reserved.
You may share this content using our article tools. As outlined in our terms and conditions, https://www.infopro-digital.com/terms-and-conditions/subscriptions/ (clause 2.4), an Authorised User may only make one copy of the materials for their own personal use. You must also comply with the restrictions in clause 2.5.
If you would like to purchase additional rights please email info@risk.net
More on Comment
G-Sib capital surcharge: how indexing and averaging alter incentives
Capital risk strategist anticipates Basel III endgame impact on US big-bank behaviour

Podcast: Abi-Jaber and Li on a ‘sticky’ volatility problem
The pair discuss their model to jointly capture Vix, SPX and SSR

Markets perceive the future in very distorted ways
Discounting paradigms should adapt to be more realistic, says Jean-Philippe Bouchaud

Op risk data: Cyber hacks shake crypto protocols
Also: JP Morgan fined over investor losses; Symetra’s Methodist pensions mess. Data by ORX News

Prediction markets can be a canary in the coal mine
Prices of contracts on the likes of Polymarket can act as signals for risk management and hedging, says risk expert

How AI agents can join the dots for risk managers
Citi risk expert outlines agentic AI tool that would pull together structured and unstructured data on trading and lending approvals to create single, unified view of risk

Op risk data: Corporate spies spell trouble for BBVA
Also: BofA buttonholed for alleged Epstein links; minority shareholders take a bite of Brookfield. Data by ORX News

The rise of AI politics
AI should not be treated as just another technology, writes MAS adviser David Hardoon
