
Credit data: a new PD story for Brazil and Mexico?
One has been sliding, the other stable, but the stage appears to be set for a break from those trends

For the past two years, there has been a clear story about the credit risk of Brazil and Mexico – a story that may now be on the verge of a twist.
According to banks’ probability of default estimates, the former has been getting steadily riskier – slipping from bb+ to bb in early 2017 – while the latter earned an upgrade from bbb to bbb+ at around the same time and has since been stable.
But each country faces a very different set of challenges and opportunities. Economically, for Brazil, there may be greater upside under the regime of its new populist president Jair Bolsonaro. The government is tackling its infamously generous state pension schemes and has a clear ambition to become a key ally of the US in the region. Stock markets have, so far, responded positively, climbing 12.5% since October’s election.
For Mexico, in contrast, challenges seem to outweigh opportunities. The country is being squeezed by hardline US trade and border policies as well as its own immigration crisis because of the Venezuelan collapse. The Mexican government response so far is fiscal support for its border states and a major drive to attract foreign investment – but these are complex problems with no quick fix.
Recent months have seen a modest deterioration in Mexico’s consensus PDs, and signs of an upturn for Brazil.
Elsewhere this month, we compare credit trends for US, UK & EU (ex-UK) large corporates. We also look at the latest credit data for car manufacturers and update the outlook for South African banks.
Global credit industry trends
The latest bank-sourced credit data, based on 30 contributor banks, shows upgrade and downgrade activity is more frequent than usual, with 38 companies moving more than one notch, compared with 26 companies the previous month. Figure 1 shows detailed industry migration trends for the most recently published data, based on data adjusted for changes in contributor mix.
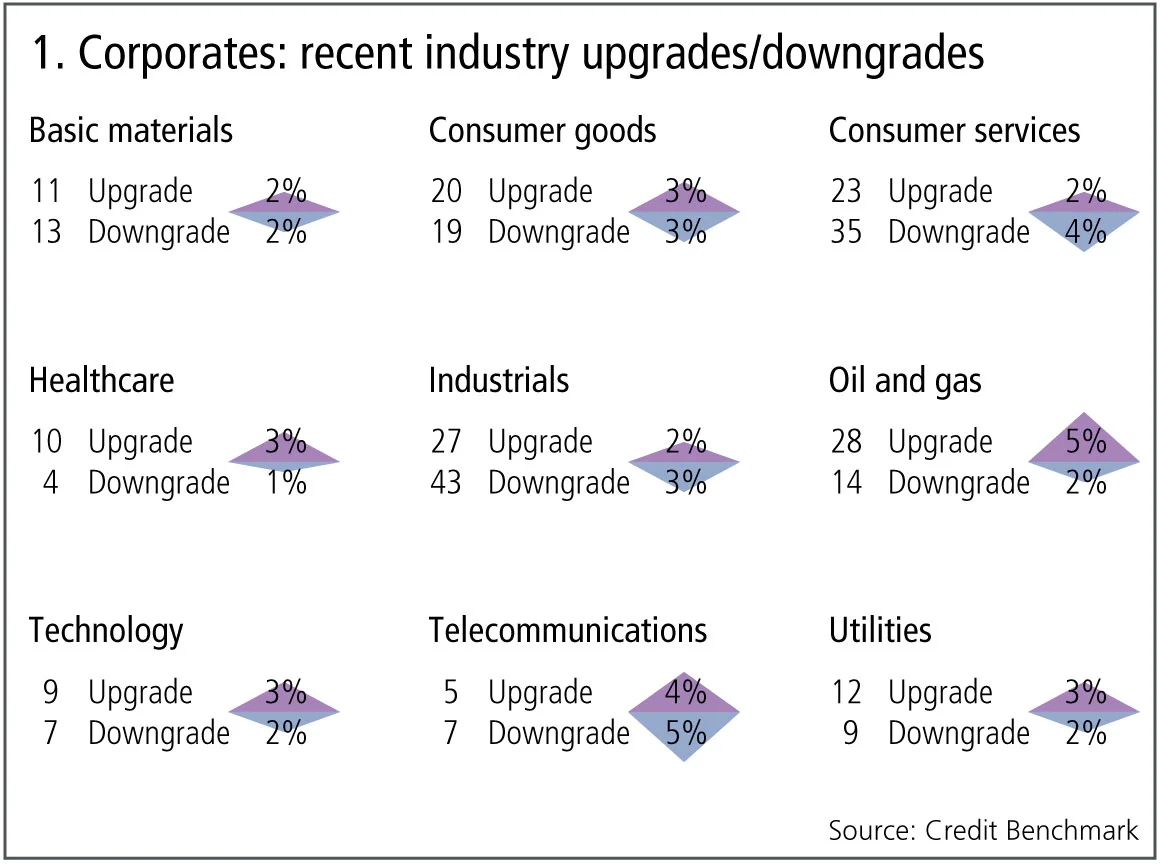
Figure 1 shows:
- Across global corporates, the number of upgrades and downgrades continues to be in balance.
- Upgrades dominate downgrades in four of the nine industries, three industries are biased towards downgrades and two industries are in balance.
- Oil and gas and technology favour upgrades for the second month.
- Utilities continue the four-month trend of upgrades outweighing downgrades.
- Consumer services see downgrades dominating upgrades for the second month.
- For the third consecutive month, telecommunications have more downgrades than upgrades.
- Industrials see downgrades outnumber upgrades after a period of balance, preceded by four months of upgrades dominating.
- Healthcare returns to favouring upgrades after a period of the reverse.
- Basic materials are in balance after seven months of upgrades dominating.
- Consumer goods continue to see balance between upgrades and downgrades.
Brazil v Mexico sovereign trends
The new leaders of Brazil and Mexico face major challenges this year, but financial markets have mainly shown cautious optimism. Stock markets in both countries have climbed and Brazilian bond yields have dropped; but Mexico’s cost of funding has seen a modest increase.
Figure 2 shows the Credit Benchmark consensus of the governments of Brazil and Mexico.
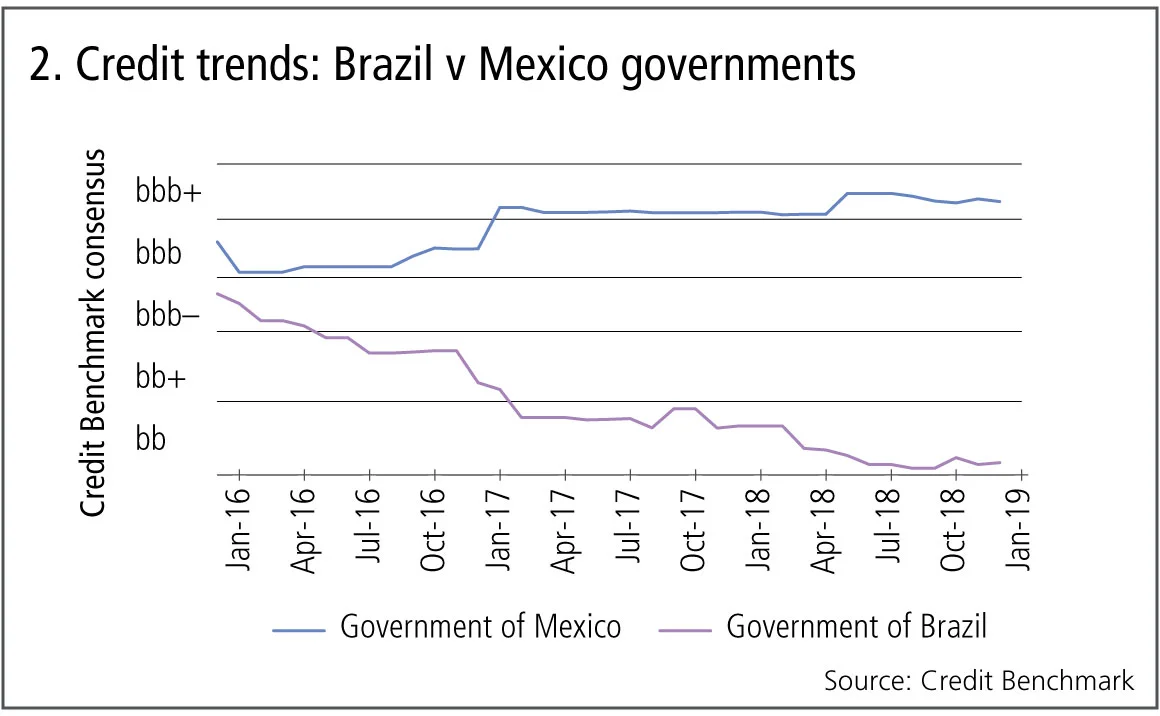
Figure 2 shows:
- Both countries were rated as investment grade in early 2016 – Mexico at bbb and Brazil at bbb-.
- Sovereign credit risk for Mexico shows a modest improvement in recent years, with an upgrade to bbb+ in 2017.
- Brazil shows a steady decline, moving to non-investment status a few months before the Mexican upgrade; Brazil is currently rated as bb.
- The ninth and fifteenth largest economies in the world are both heading in new political and social directions; but Brazil has scope for more immediate and high-impact economic changes and improved international standing. If the US administration continues with its current policies, Mexico faces a long and tough route to adapt. Against this new background, recent credit trends may be about to change.
US, UK and EU (ex-UK) large corporates
The long-run economic impact of Brexit on UK plc is still the subject of intense debate, but short-term uncertainty caused by political deadlock is a clear negative, with many companies deferring investment decisions and some seriously considering relocation. US corporates continue to benefit from the ‘Trump effect’ and the Fed seems to be moving to a more neutral stance. Economic figures from the EU suggest a recession, partly due to Brexit effects; but this seems to be sector-specific. If China and the US agree a deal to reduce the Chinese trade surplus, then the sustained increase in Chinese imports will be good news for EU export sectors.
Figure 3 below plots average credit trends for a very large sample (more than 7,000 companies) across the UK, US and EU ex-UK.
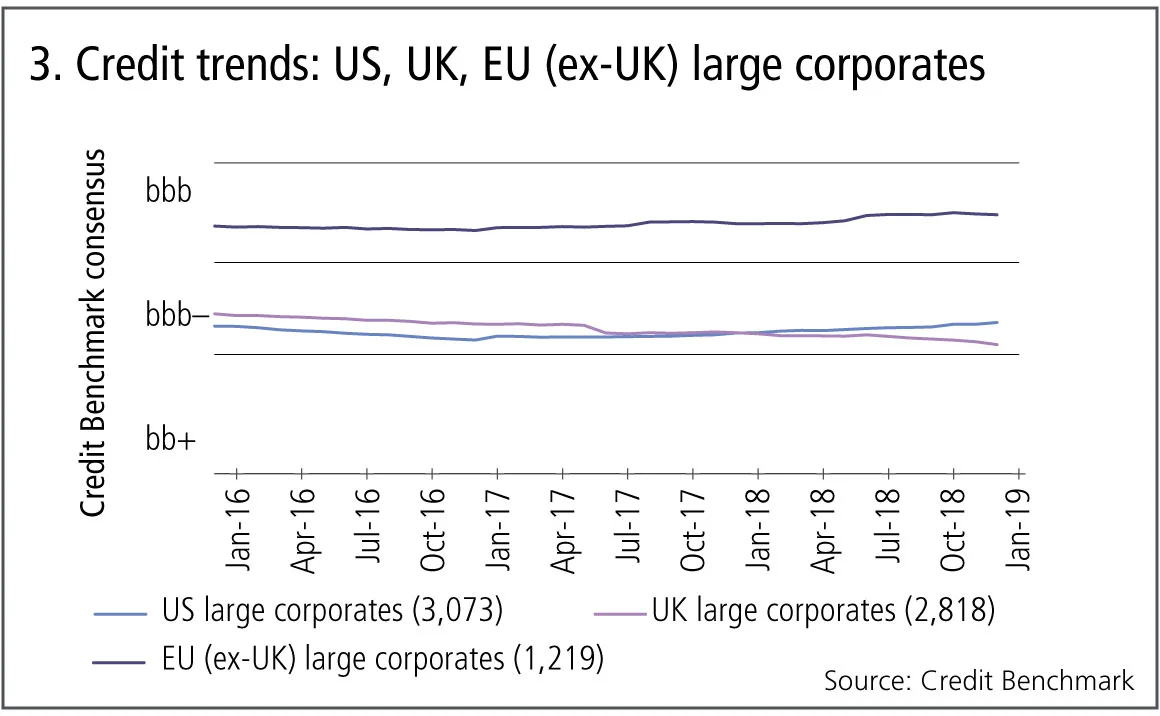
Figure 3 shows:
- The corporate credit risk picture appears to confirm that UK plc faces some challenges that are not affecting the wider world.
- There has been a steady improvement in the EU (ex-UK), although recent German growth concerns may cause this to stall.
- The US decline in 2016 reversed, in part because of the fiscal package.
- The UK shows a steady decline; average UK corporate credit risk is now close to breaching the investment-grade threshold.
Car manufacturers
The auto manufacturing industry is struggling with a series of problems and uncertainties. Trade tensions are particularly damaging for these firms – complex auto industry supply chains are especially vulnerable to disruption. Demand – fuelled by securitised credit – is stalling, and cars are the largest discretionary consumer item. Consumers are also delaying purchases because of uncertainty about technology: is 2019 the year of the self-charging hybrid or the all-electric car?
Figure 4 shows the credit distribution and credit activity for 40 auto manufacturing companies.
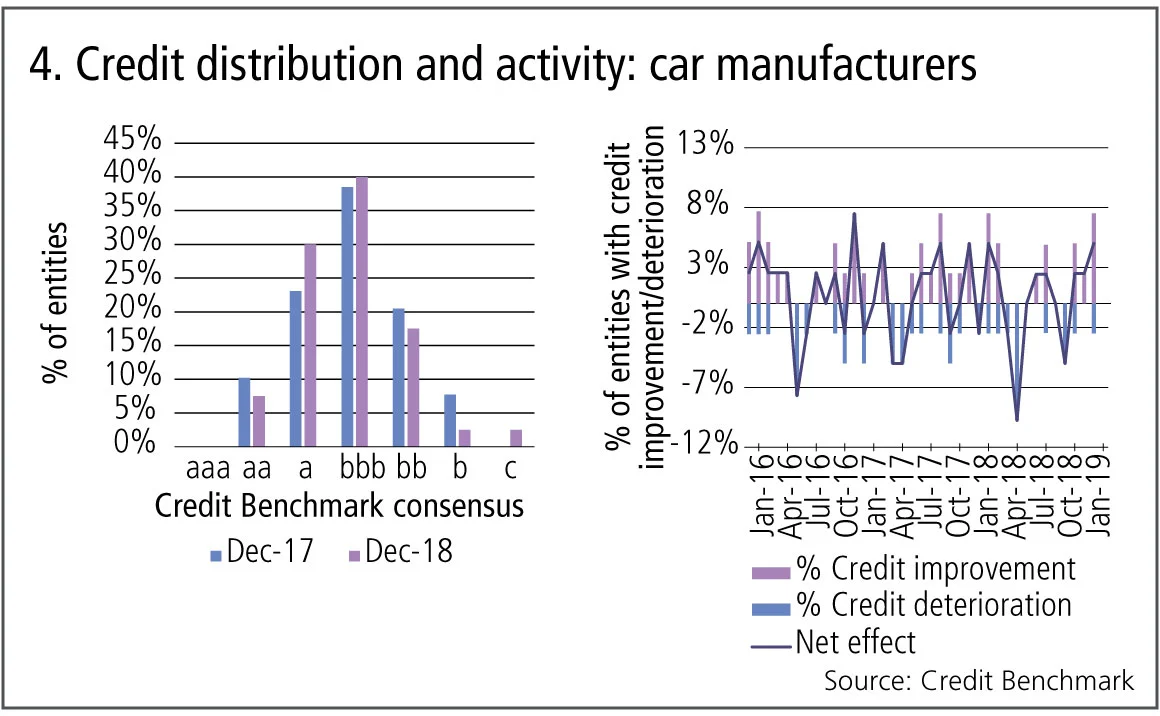
Figure 4 shows:
- The credit distribution suggests a two-way pull, but an overall deterioration.
- In the past year, there are fewer high-quality and more lower-quality companies in the distribution tails, but an increase in the proportion in the largest bbb category.
- The pattern of improvements and deteriorations is very volatile, with no clear trend. This may in part reflect the high level of uncertainty about the likely winners and losers in the new technological landscape.
South African banks update
In early 2018, the credit risk of South African financials was showing signs of possible stabilisation after deteriorating for more than a year. But despite Zuma’s departure, deteriorations continued to outnumber improvements throughout much of 2018.
However, the recent discovery of large gas deposits in the Outeniqua basin could prove to be a game-changer for the South African economy. It represents more than 1 billion of oil barrels equivalent – about $55 billion in assets compared with current GDP of $350 billion.
Figure 5 shows credit trends for 215 South African financials over the past three years.
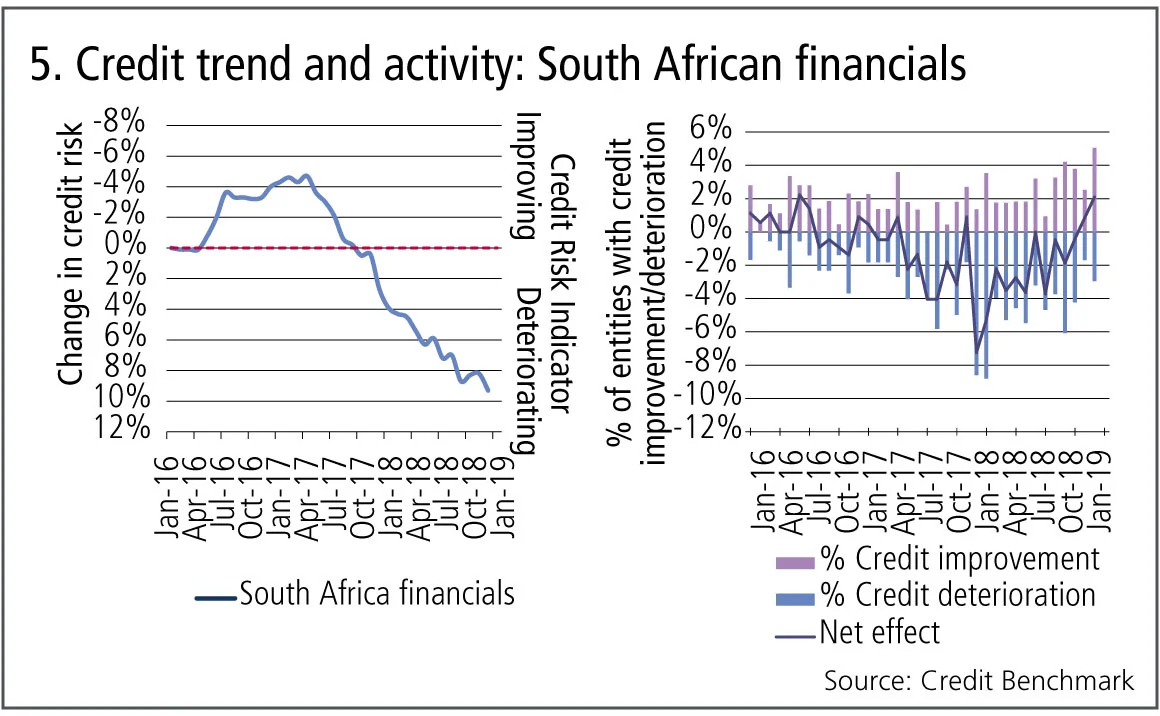
Figure 5 shows:
- Average credit risk in the left hand chart improved until early 2017, but has steadily declined since then.
- Credit activity in the right-hand chart shows that the balance of deteriorations and improvements has been volatile, but remained in the negative zone throughout 2018.
- The balance has been trending higher since the beginning of 2018 and crossed into positive territory at the end of last year.
- Even before the gas discovery was announced, credit activity had shifted in favour of improvements. This has not yet shown through in the average credit risk level, but positive changes in credit activity usually lead the credit risk average.
About this data
The Credit Benchmark dataset is based on internally modelled credit ratings from a pool of contributor banks. These are mapped into a standardised 21-bucket ratings scale, so downgrades and upgrades can be tracked on a monthly basis. Obligors are only included where ratings have been contributed by at least three different banks, yielding a total dataset of over 25,300 names.
David Carruthers is head of research at Credit Benchmark.
Only users who have a paid subscription or are part of a corporate subscription are able to print or copy content.
To access these options, along with all other subscription benefits, please contact info@risk.net or view our subscription options here: http://subscriptions.risk.net/subscribe
You are currently unable to print this content. Please contact info@risk.net to find out more.
You are currently unable to copy this content. Please contact info@risk.net to find out more.
Copyright Infopro Digital Limited. All rights reserved.
As outlined in our terms and conditions, https://www.infopro-digital.com/terms-and-conditions/subscriptions/ (point 2.4), printing is limited to a single copy.
If you would like to purchase additional rights please email info@risk.net
Copyright Infopro Digital Limited. All rights reserved.
You may share this content using our article tools. As outlined in our terms and conditions, https://www.infopro-digital.com/terms-and-conditions/subscriptions/ (clause 2.4), an Authorised User may only make one copy of the materials for their own personal use. You must also comply with the restrictions in clause 2.5.
If you would like to purchase additional rights please email info@risk.net
More on Comment
G-Sib capital surcharge: how indexing and averaging alter incentives
Capital risk strategist anticipates Basel III endgame impact on US big-bank behaviour

Podcast: Abi-Jaber and Li on a ‘sticky’ volatility problem
The pair discuss their model to jointly capture Vix, SPX and SSR

Markets perceive the future in very distorted ways
Discounting paradigms should adapt to be more realistic, says Jean-Philippe Bouchaud

Op risk data: Cyber hacks shake crypto protocols
Also: JP Morgan fined over investor losses; Symetra’s Methodist pensions mess. Data by ORX News

Prediction markets can be a canary in the coal mine
Prices of contracts on the likes of Polymarket can act as signals for risk management and hedging, says risk expert

How AI agents can join the dots for risk managers
Citi risk expert outlines agentic AI tool that would pull together structured and unstructured data on trading and lending approvals to create single, unified view of risk

Op risk data: Corporate spies spell trouble for BBVA
Also: BofA buttonholed for alleged Epstein links; minority shareholders take a bite of Brookfield. Data by ORX News

The rise of AI politics
AI should not be treated as just another technology, writes MAS adviser David Hardoon
