
Credit data: UK retail sector’s woes continue
High street fails to get over Christmas slump; elsewhere, global PDs remain in flux, writes David Carruthers of Credit Benchmark

If Britain is a nation of shopkeepers, it is not presently a happy one. The UK’s looming exit from the European Union has been widely blamed for damaging confidence among employers, which has had the knock on effect of damping wage growth and, in turn, eroding consumer confidence. The rise in import costs stemming from the collapse in sterling that followed the vote certainly hasn’t helped.
The effects on the high street have been calamitous (see figure 2): the surprise 1.4% drop in UK retail sales data in the key month of December was followed by a flat January, with sales growing just 0.1%. Overall, sales volume growth in 2017 was the lowest since 2013. Rising costs and weak demand, coupled with the impact of the inexorable shift towards online shopping among consumers, has led some British mainstays to consider closing stores (clothes retailers such as Debenhams and New Look) while others have recently fallen into administration (children’s store Toys R Us and electrical goods retailer Maplin).
Elsewhere, the credit outlook for global corporates across a range of sectors finds itself in an odd state of equilibrium: upgrades dominate downgrades in three out of nine reported industries; three industries are dominated by downgrades; and three are balanced. The global steel sector – currently wrestling with US president Donald Trump’s imposition of protectionist tariffs – is a case in point (see figure 3). Probabilities of default (PDs) for US steelmakers continue to steadily improve, while that of non-US steelmakers continues to decline – though the former are coming off a much lower base, and are yet to match the latter in terms of average credit quality.
Global credit industry trends
Figure 1 shows industry migration trends for the most recent published data.
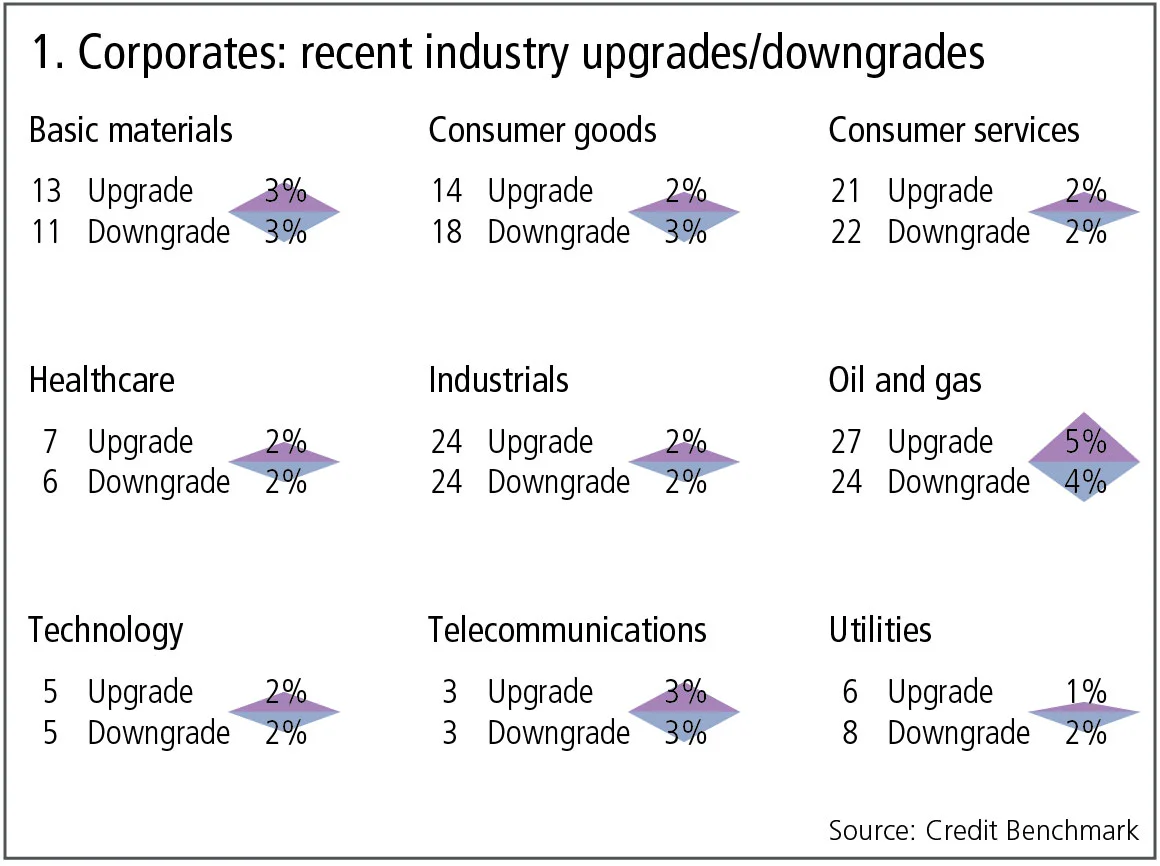
Figure 1 shows:
- Overall, 3% of the global corporates obligors have improved and 3% show a deterioration. Compared with the previous month, the imbalance between upgrades and downgrades has decreased.
- Basic materials and oil and gas continue to show a balance in favour of upgrades, continuing their recent patterns.
- In healthcare, upgrades continue to outweigh downgrades after a period where downgrades dominated.
- Consumer goods have returned to their recent pattern of downgrades outnumbering upgrades.
- After favouring upgrades for a number of months, utilities now show a balance of downgrades.
- Consumer services, industrials, technology and telecommunications are balanced or close to balanced.
UK retail
Figure 2 shows credit risk trends and the credit distribution for 370 large UK companies in the general retail sector.
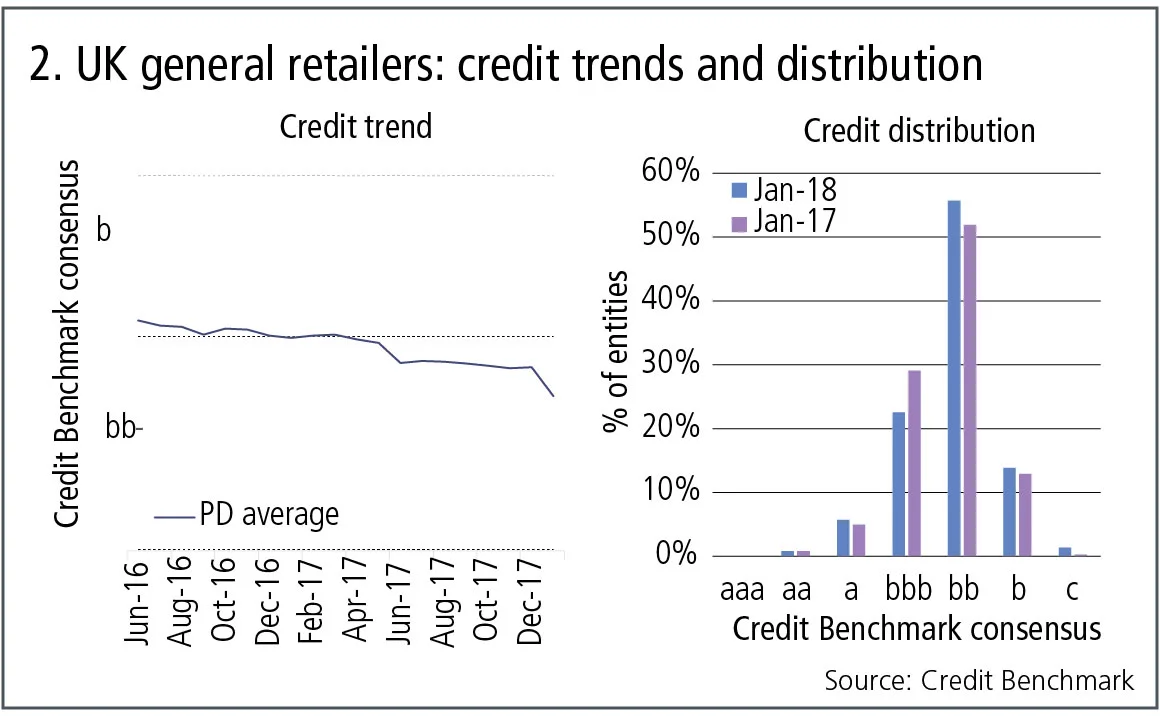
Figure 2 shows:
- The left-hand chart shows that the credit risk of UK general retailers has been increasing over the past 20 months.
- The sector was downgraded from bb to bb– in April 2017. The average probability of default (PD) increased by 20% between January 2017 and January 2018.
- The right-hand chart shows that more than 70% of the UK general retailers are now viewed as non-investment grade, an increase from 65% in January 2017.
US steel
Donald Trump’s presidential campaign promised to protect the US steel industry and boost employment in the Rust Belt; the industry currently employs around 80,000, down from its peak of 700,000 in the 1950s. The latest executive order imposes 25% tariffs on all steel imports, and some mothballed mills are already coming back on stream as a result. Various countries are lobbying for exemptions but the main target is China, which now produces half of the world’s steel.
Figure 3 shows the contrasting credit trends for US and ex-US steel companies since September 2016. This sample officially covers iron and steel companies.
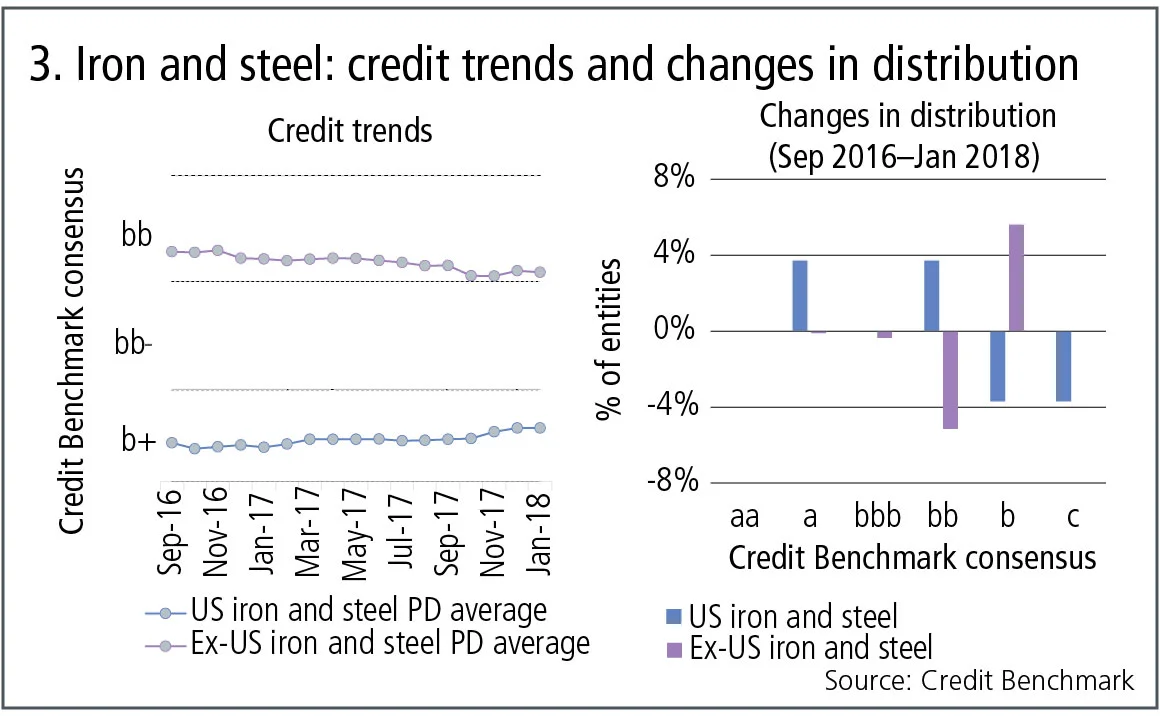
Figure 3 shows:
- Credit risk in US iron and steel has been steadily improving, while credit risk for ex-US iron and steel has deteriorated. If these trends continue, the typical credit rating of ex-US iron and steel companies could drop from bb to bb–.
- US iron and steel has a lower level of credit quality over this period; but based on recent trends the US and ex-US indexes are slowly converging.
- Over the past 15 months, US iron and steel has seen an improvement in its lower-quality names while ex-US iron and steel has seen deterioration in the a, bbb and bb categories.
Global mining
The past few years have been volatile for the global mining industry. Yields are declining as existing ore bodies are worked out, which is constraining supply. At the same time, battery-driven demand for “tech metals” – nickel, lithium, vanadium, cobalt, graphite and a range of rare earths – is set to accelerate. This is mainly due to the wider global adoption of electric vehicles, solar cells and mobile phones; as well as the broader need to store electricity from renewable sources. Figure 4 plots the 2017 credit trends for 184 international companies in the gold and general mining sectors.
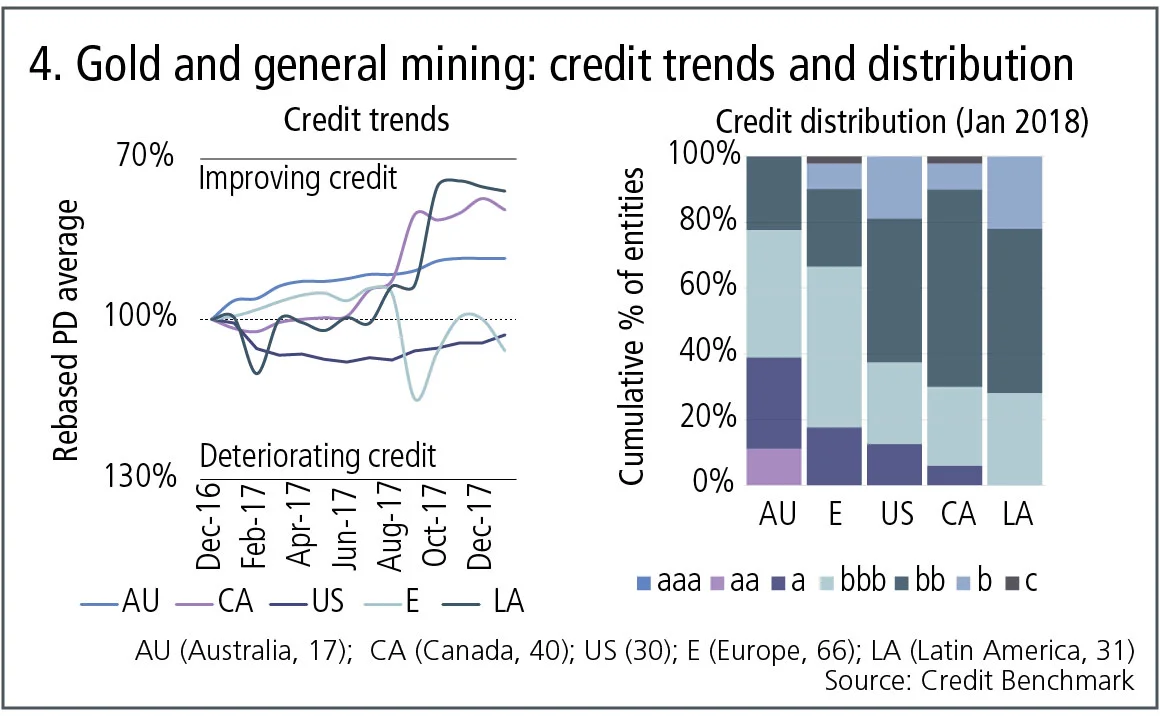
Figure 4 shows:
- The left-hand chart shows that credit quality of Canadian and Latin American mining companies has improved in 2017, especially in the final quarter of the year.
- Australian mining companies show a steady upward trend.
- Europe has been very volatile – partly a reflection of the large but diverse sample of companies in the index.
- The US is showing a slight recovery after a decline in the first half of the year.
- The right-hand chart shows that 78% of Australian mining companies are investment grade; for Canada, Latin America and the US, the figure is closer to 40%.
Global media
The global media industry faces some major challenges. Sluggish consumer spending has pushed various companies to cut back on advertising spend in order to restore margins. Procter & Gamble, for example, reduced its digital marketing spending by $100 million in Q2 of 2017. This is one example of a growing trend that questions the value of online advertising in particular – a previously lucrative area for advertising companies. Traditional media companies are suffering from online competition; companies such as Netflix have overturned the traditional business model for film and TV content.
Figure 5 shows the credit trends for the media industry over the past 15 months.
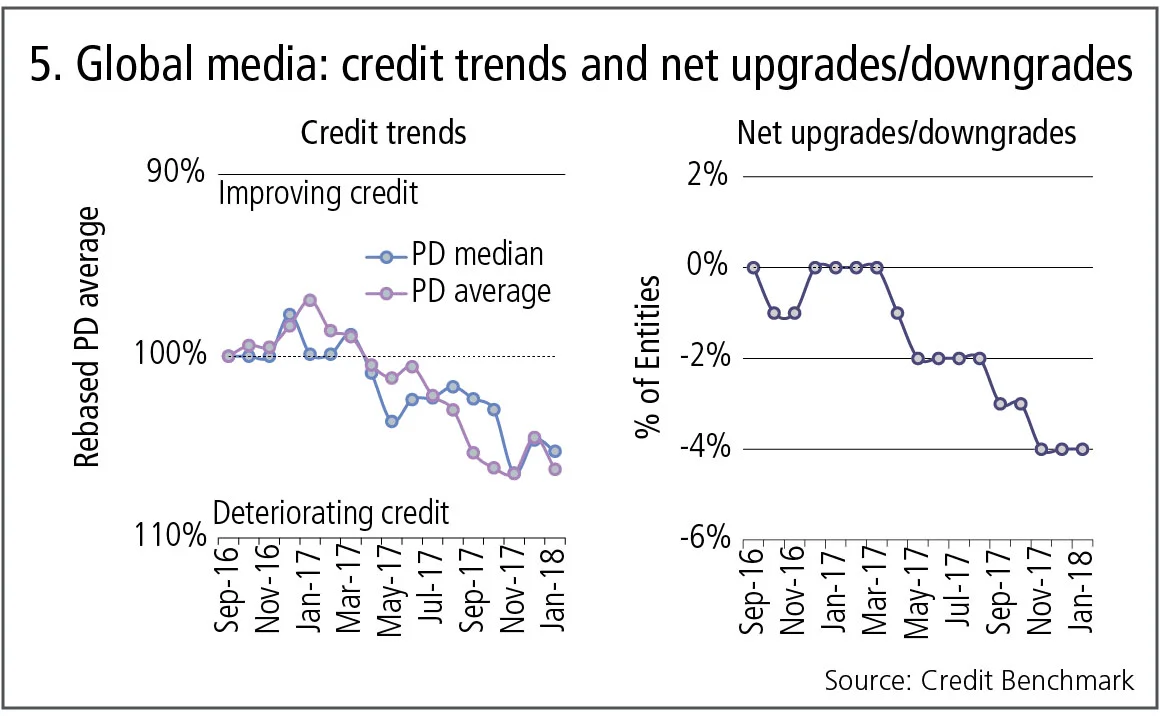
Figure 5 shows:
- The left-hand chart shows that from March 2017, there has been an overall deterioration in both the PD median and PD average of the global media industry.
- Over time, the number of downgrades has outweighed upgrades, with a net 4% of entities being downgraded across the 15-month time period.
About this data
The Credit Benchmark dataset is based on internally modelled credit ratings from a pool of contributor banks. These are mapped into a standardised 21-bucket ratings scale, so downgrades and upgrades can be tracked on a monthly basis. Obligors are only included where ratings have been contributed by at least three different banks, yielding a total dataset of roughly 14,500 names, which is growing by 5% per month.
David Carruthers is head of research at Credit Benchmark, a credit risk data provider.
Editing by Tom Osborn
Only users who have a paid subscription or are part of a corporate subscription are able to print or copy content.
To access these options, along with all other subscription benefits, please contact info@risk.net or view our subscription options here: http://subscriptions.risk.net/subscribe
You are currently unable to print this content. Please contact info@risk.net to find out more.
You are currently unable to copy this content. Please contact info@risk.net to find out more.
Copyright Infopro Digital Limited. All rights reserved.
As outlined in our terms and conditions, https://www.infopro-digital.com/terms-and-conditions/subscriptions/ (point 2.4), printing is limited to a single copy.
If you would like to purchase additional rights please email info@risk.net
Copyright Infopro Digital Limited. All rights reserved.
You may share this content using our article tools. As outlined in our terms and conditions, https://www.infopro-digital.com/terms-and-conditions/subscriptions/ (clause 2.4), an Authorised User may only make one copy of the materials for their own personal use. You must also comply with the restrictions in clause 2.5.
If you would like to purchase additional rights please email info@risk.net
More on Comment
Why do prices jump?
After years of investigation, we still aren’t sure, says Jean-Philippe Bouchaud

Don’t mind the gap risk: regulatory treatment of credit repacks
Gap risk in repackaging is not a credit valuation adjustment for Basel III capital purposes, argues senior quant Andrey Chirikhin

Op risk data: HSBC hit with $400m external fraud loss
Also: China’s unlicensed trading clampdown; SocGen’s insurance mis-selling woes. Data by ORX News

Vinicius fortune: quantifying luck in the World Cup draw
Julien Guyon explains how bias, variance and luck affect teams in this summer’s tournament – and explores wider relevance for portfolio managers

G-Sib capital surcharge: how indexing and averaging alter incentives
Capital risk strategist anticipates Basel III endgame impact on US big-bank behaviour

Podcast: Abi-Jaber and Li on a ‘sticky’ volatility problem
The pair discuss their model to jointly capture Vix, SPX and SSR

Markets perceive the future in very distorted ways
Discounting paradigms should adapt to be more realistic, says Jean-Philippe Bouchaud

Op risk data: Cyber hacks shake crypto protocols
Also: JP Morgan fined over investor losses; Symetra’s Methodist pensions mess. Data by ORX News
