
Credit data: reasons to like Europe and G-Sibs
Bank estimates offer alternative view on probability of default risk

Bank estimates of credit exposure can be a useful corrective to a popular narrative. Look at sovereign default risk in Europe, for example: the past year has produced a steady stream of bad news stories, with the threat of a no-deal Brexit growing, Spain in constitutional turmoil, and far-right sentiment evident in Austria, Germany and Poland.
In contrast to this backdrop, probabilities of default (PDs) for many countries have tightened significantly. For Cyprus, Greece and Ireland, risk has fallen by more than 30% over the past 12 months; Bulgaria, Hungary, Portugal and Spain have all seen PDs drop by more than 20% in the same period. For the Czech Republic, Denmark, Germany, Netherlands and Romania, PDs are down by more than 10%.
For some of these countries – notably Cyprus – the picture is less rosy when considered over a three-month span, but it is still, broadly, good news.
Another surprise can be found in banks’ views on other banks. Analysing a population of 30 global systemically important banks (G-Sibs) reveals default risk is lower than for many other groups and also more stable. The annualised volatility of the median PD for the group is just 4%, while the median PD itself is 11 basis points – only central counterparties have a comparable median of 12bp, but the annualised volatility for CCPs is 12%.
Low G-Sib PDs ought to reflect the enhanced prudential standards the group is now subject to – as such, their low volatility should also be preserved when credit conditions for bank borrowers worsen. It will be interesting to see if that holds true.
Global credit industry trends
Figure 1 shows industry migration trends for the most recent published data.
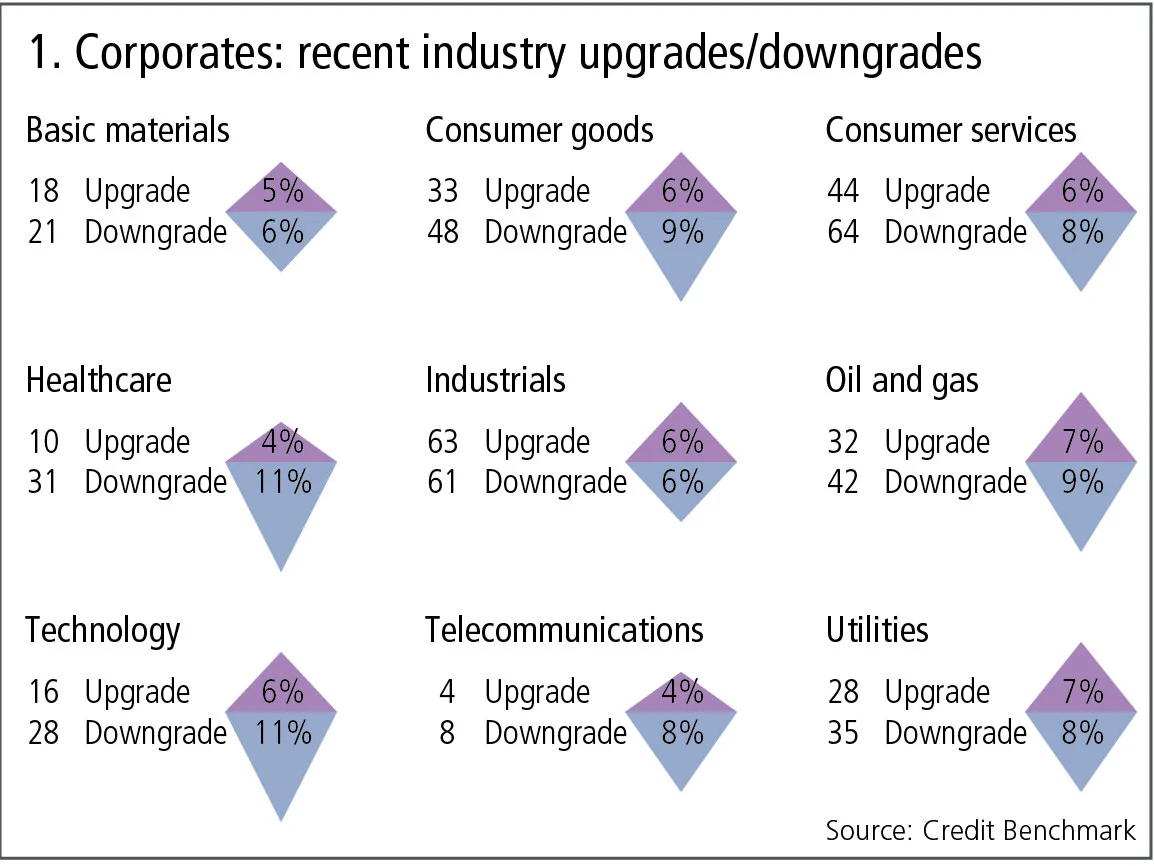
Figure 1 shows:
- Global corporate downgrades have surged again, with downgrades outnumbering upgrades by 1.5 to 1. This is a resumption of the trend seen throughout much of this year and reverses the position from last month.
- Downgrades outnumber upgrades in nearly all industries this month, but telecommunications and healthcare show the largest imbalance.
- Basic materials, utilities, consumer industries and oil and gas show the smallest imbalances.
- Industrials continue to show a marginal balance in favour of upgrades.
EU: sovereign risk trends
Brexit negotiations and the Catalan crisis have eclipsed some of the more encouraging economic news from Europe, with growth in 2018 likely to be at its fastest rate for years. At the same time, sovereign credit risks are generally improving across the EU and show some dramatic changes over the past 12 months.
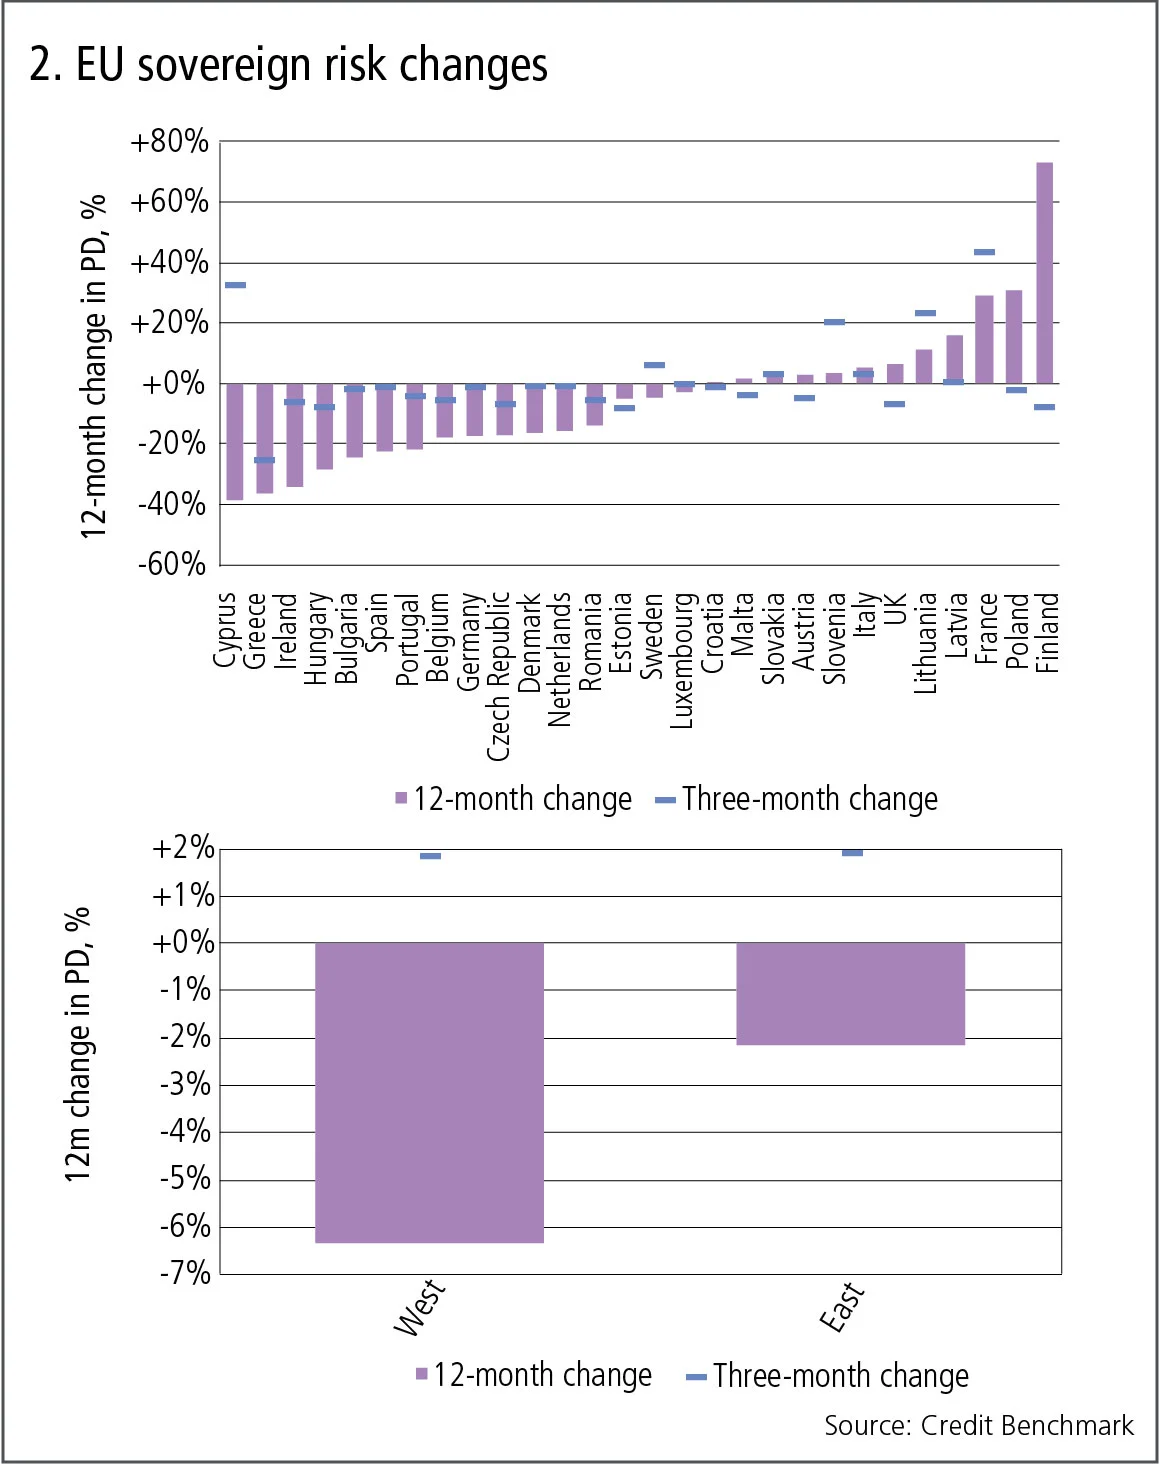
Figure 2 shows:
- Based on PD changes in the past 12 months, there have been significant improvements in sovereign credit risk in Bulgaria, Cyprus, Greece, Hungary, Ireland, Portugal and Spain.
- The three-month changes for these countries show similar trends, but Cyprus shows a major deterioration.
- Finland has had a major 12-month credit deterioration, reflecting its recent economic problems. Its dependence on cyclical industries, its links with Russia and its concentrated economic base have left it slowly recovering from a protracted recession. The three-month change looks more encouraging.
- France and Poland also show a significant deterioration, mainly a reflection of politics. But recent economic news on Poland has been very encouraging and FTSE Russell is expecting to upgrade it to a developed market next year. The three-month credit change for Poland is more positive.
- Latvia and Lithuania have both suffered from economic links to Russia, and Russian connections are a common theme in a number of these changes. But as we have reported previously, Russia’s credit position is improving. If that translates into economic performance, there could be some major reversals in the EU sovereign risk chart.
- The lower chart shows the east-west divide. The major 12-month improvement is in the western European sovereigns, although there has been a modest improvement in the eastern sovereigns over the same period. Both show a modest deterioration over the past three months.
This data predates the recent events in Catalonia, which have pushed up Spanish credit default swap prices, so the improvement shown here may be undermined if the political situation in Spain deteriorates.
US oil and gas index
Oil and gas has been a recurring credit theme over the past year. The industry has pulled out of a steep credit nosedive and the upgrade/downgrade ratio has been on a generally improving trend in recent months. This trend can be quantified and tracked with baskets of credit data.
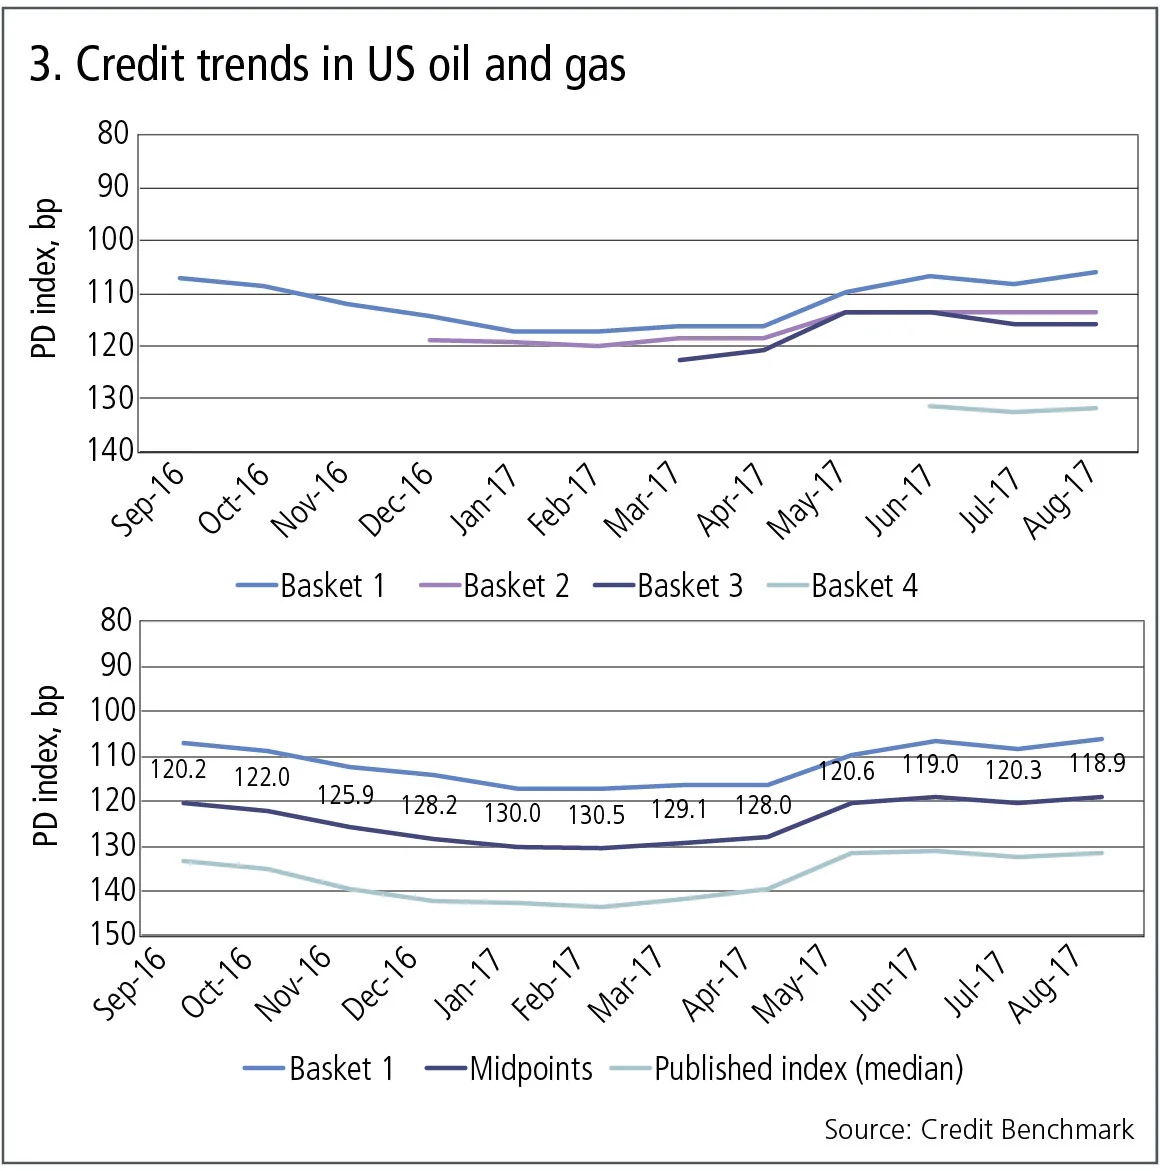
Figure 3 shows:
- The upper chart (with the y-axis reversed) shows the trend in median PD for four baskets of US oil and gas obligors (borrowers) over the past 12 months. The blue line tracks the initial basket, and the basket is reset every quarter to reflect the current set of active borrowers.
- Each series shows similar patterns, but the PD level varies from about 105 basis points to over 130bp for the most recent basket. The higher value (the lower, pale blue line) is likely to reflect a bank focus on higher-risk credits in the industry. This ‘selection’ effect often appears in bank-sourced credit data; it suggests banks make major adjustments to their credit portfolios according to the phases of the credit cycle in each industry.
- The lower chart shows upper and lower bounds for the oil index. The top line is the lower PD bound derived from the first basket of fixed constituents; the bottom line is a chain-linked composite, derived from the PD changes in the four baskets in the upper chart. This latter is rebased to the most recent and highest PD, so it represents the conservative view. The middle line shows the midpoints between the two bounds. This provides a more complete picture of trends in the industry, with the upper and lower bounds representing the margin for estimation error.
- This suggests the typical oil industry credit portfolio has moved from a median PD of around 120bp to a high of over 130bp, and has now returned to just below 120bp. This time series has a margin of error of around +/–10%, represented by the boundaries. So the full range over the past year, allowing for selection effects, could be from about 108bp to a high of more than 140bp.
Credit volatility indexes
As the oil and gas index shows, bank-sourced credit estimates can show significant variation over short periods. Using the basket approach described in the last section, it is now possible to construct indexes to track not just risk levels, but also risk volatility for an increasing number of geographies and industries.
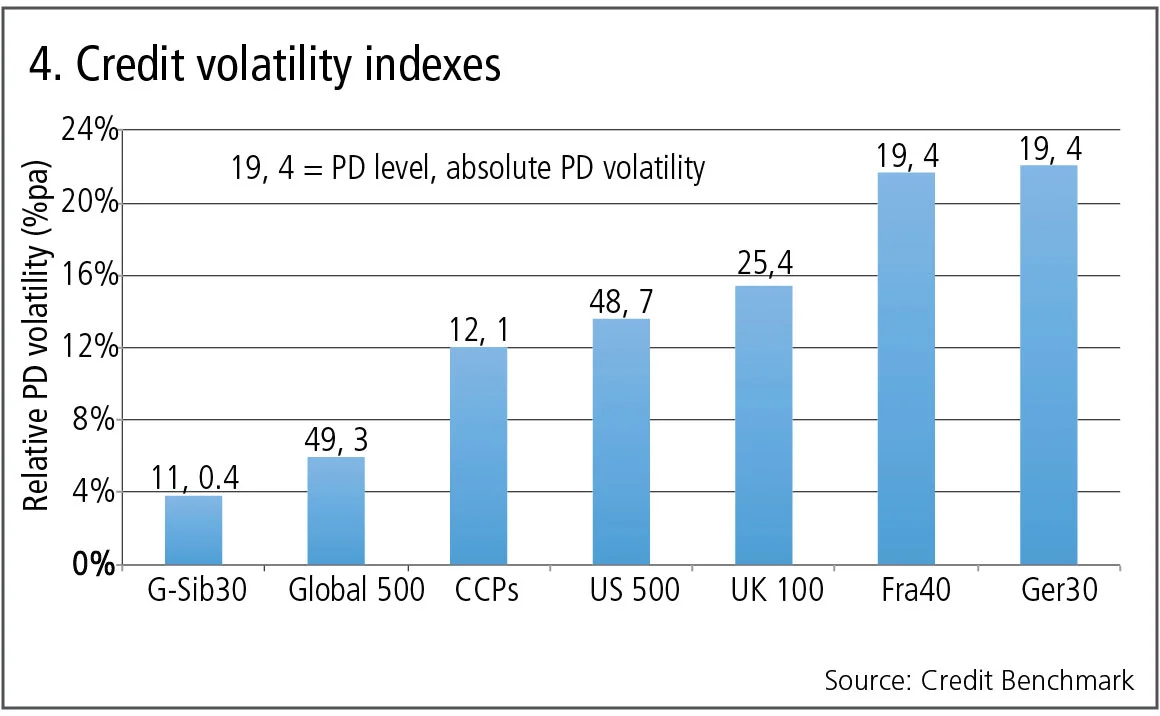
Figure 4 shows:
- The annualised % volatility in median PD for a variety of corporate and financial groups varies from 4% to more than 20%.
- The figures above each bar are the median one-year PD and the annualised standard deviation (absolute basis points) of the PD.
- The CCP index shows a PD level of 12bp, close to that of the G-Sibs index, with a value of 11bp. However, the absolute CCP volatility is more than twice as high.
- Some of these indexes show high PD levels and low absolute PD volatility; others show low PD levels and moderate absolute PD volatility. This is partly due to the number of obligors in the index but some of the narrowest indexes – such as G-sibs – have the lowest percentage volatility.
- The US and UK indexes have the highest PD level but are proportionately less volatile, because they are significantly more diversified.
These measures of PD volatility can be compared with the volatility of credit spreads or the equity Vix. They may help bridge the gap between through-the-cycle risk estimates and point-in-time risk estimates where there is no equity or bond volatility measure available.
Airlines update
Airlines have made headlines recently with the demise of the UK’s Monarch and Ryanair’s decision to cut multiple flights. Bank-sourced data covers more than 60 airline companies, and the following charts show data for 41 of these where a 12-month history is available.
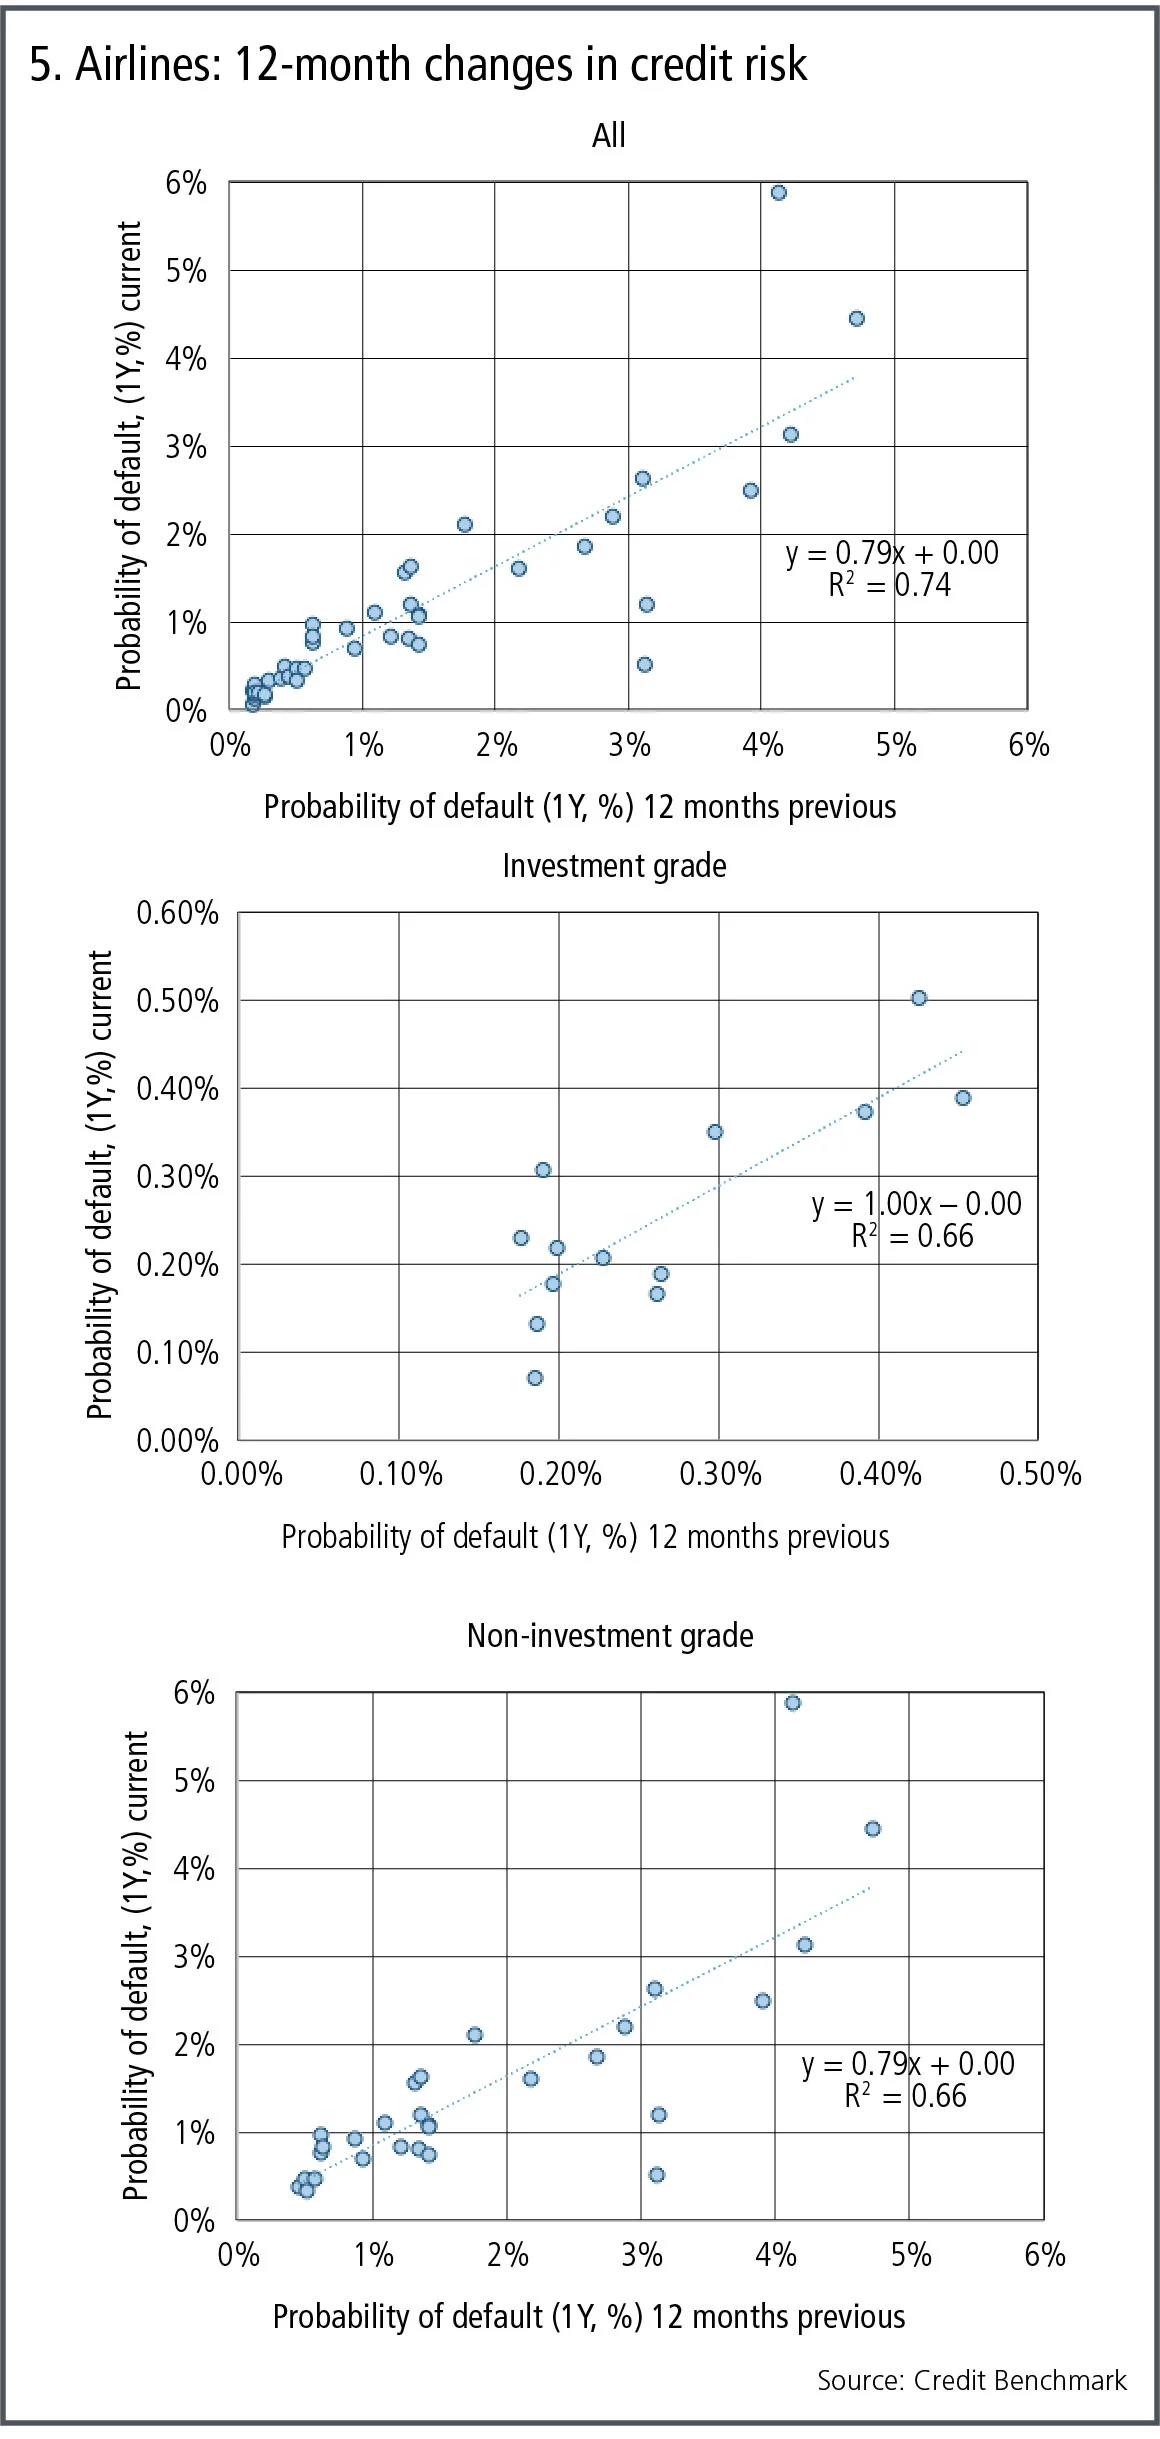
Figure 5 shows:
- The credit position of airlines has improved in the past year. The fitted line has an intercept of zero and a slope of 0.79, showing that a typical airline PD has dropped by 20% in the past year.
- Investment-grade airlines show some individual changes, but the fitted line slope of 1.0 suggests no overall change in credit risk for these obligors.
- Non-investment grade airlines dominate the sector, and the slope of the fitted line is the same as for the group as a whole.
About this data
The Credit Benchmark dataset is based on internally modelled credit ratings from a pool of contributor banks. These are mapped into a standardised 21-bucket ratings scale, so downgrades and upgrades can be tracked on a monthly basis. Obligors are only included where ratings have been contributed by at least three different banks, yielding a total dataset of more than 12,000 names, which is growing by 5% per month.
David Carruthers is the head of research at Credit Benchmark, a credit risk data provider.
Only users who have a paid subscription or are part of a corporate subscription are able to print or copy content.
To access these options, along with all other subscription benefits, please contact info@risk.net or view our subscription options here: http://subscriptions.risk.net/subscribe
You are currently unable to print this content. Please contact info@risk.net to find out more.
You are currently unable to copy this content. Please contact info@risk.net to find out more.
Copyright Infopro Digital Limited. All rights reserved.
As outlined in our terms and conditions, https://www.infopro-digital.com/terms-and-conditions/subscriptions/ (point 2.4), printing is limited to a single copy.
If you would like to purchase additional rights please email info@risk.net
Copyright Infopro Digital Limited. All rights reserved.
You may share this content using our article tools. As outlined in our terms and conditions, https://www.infopro-digital.com/terms-and-conditions/subscriptions/ (clause 2.4), an Authorised User may only make one copy of the materials for their own personal use. You must also comply with the restrictions in clause 2.5.
If you would like to purchase additional rights please email info@risk.net
More on Comment
Why do prices jump?
After years of investigation, we still aren’t sure, says Jean-Philippe Bouchaud

Don’t mind the gap risk: regulatory treatment of credit repacks
Gap risk in repackaging is not a credit valuation adjustment for Basel III capital purposes, argues senior quant Andrey Chirikhin

Op risk data: HSBC hit with $400m external fraud loss
Also: China’s unlicensed trading clampdown; SocGen’s insurance mis-selling woes. Data by ORX News

Vinicius fortune: quantifying luck in the World Cup draw
Julien Guyon explains how bias, variance and luck affect teams in this summer’s tournament – and explores wider relevance for portfolio managers

G-Sib capital surcharge: how indexing and averaging alter incentives
Capital risk strategist anticipates Basel III endgame impact on US big-bank behaviour

Podcast: Abi-Jaber and Li on a ‘sticky’ volatility problem
The pair discuss their model to jointly capture Vix, SPX and SSR

Markets perceive the future in very distorted ways
Discounting paradigms should adapt to be more realistic, says Jean-Philippe Bouchaud

Op risk data: Cyber hacks shake crypto protocols
Also: JP Morgan fined over investor losses; Symetra’s Methodist pensions mess. Data by ORX News
