
This article was paid for by a contributing third party.More Information.
Holistic liquidity measures during Covid-19: Supply, demand, and market conditions

Authors and Contributors
Mohandas Ayikara
Jesy Beeson
James Boudreault, CFA
Daniel Grombacher
Jonathan Kronstein
Bobby Timberlake
John Wiesner
In late February and early March 2020, global markets experienced an unprecedented health crisis which increased both economic uncertainty and market volatility
Leading up to the crisis, quarterly economic growth forecasts for the remainder of the year were between 1% to 4%. Now we are seeing forecasts of -20% to -34% in the second quarter alone. The crisis and the rapid change in expectations has created the highest level of economic uncertainty in decades. This situation caused the largest spike in volatility since the financial crisis of 2008-9. Implied volatility on the E-mini S&P 500, shown below, which can be viewed as a proxy for broader market volatility, surged to the highest level in more than 13 years in early March amid the spread of Covid-19.

Increased volatility should, all other things being equal, cause wider bid/offer spreads and lower book depth in all markets as market participants wisely reduce risk-taking due to the increased value at risk from higher volatility. Given the capital and risk limits of a typical participant, resting order book liquidity declines because of both the higher velocity of price changes and the wider breadth of price ranges across which the resting order book is stretched. As this occurs, resting order book liquidity tends to be replaced, at least partially, by refreshed liquidity. Therefore, facilitation of risk transfer at a trading platform as measured by volume becomes one of the core liquidity metrics during the periods of increased volatility. When volatility spikes, it is typical to see CME Group futures volumes surge with it.
When analyzing this situation, rather than focus on any one metric individually (such as top of book depth), analysis into market liquidity should consider three interconnected metrics: market conditions, demand, and supply.
How are these three fundamental factors linked? As risk increases (a market condition), market participants must reduce order sizes (supply) to maintain proper risk controls; at the same time, there is more demand from other participants for hedging, so volume (demand) increases. These three fundamental factors of liquidity are intrinsically linked and will adjust to remain in balance. Analyzing these three factors together provides a holistic perspective versus analyzing any one of the factors without the context of the other two. As with all analysis, the conclusions must be handicapped, but this analysis does tell a somewhat different story than purely looking at bid/offer spreads and depth of book in isolation.
In fact, it appears, from our analysis, that given the increase in volatility, liquidity has held up remarkably well, and far better than one might have expected, all other things being equal.
Understanding the balance of these three measures for cost-to-trade analysis
To appropriately represent the interplay of how these three crucial measures impact liquidity, CME Group has introduced new holistic liquidity metrics to represent the environment facing traders as they seek to execute trades in highly volatile markets. These measures, which represent some traditional liquidity measures in relation to true market conditions, provide a more comprehensive view of liquidity than some of the more commonly used statistics.
Holistic liquidity metrics
The holistic liquidity metrics are used to provide more context to market conditions than traditional liquidity metrics. These figures, taken together, demonstrate how liquidity and the cost-to-trade (CTT) are impacted by changing market dynamics and increased demand as measured by volume throughput of the order book. Using basic economic tenets, this analysis considers:
- Market conditions (daily true range)
- Supply (cost-to-trade in the contract)
- Demand (volume in the contract)
Cost-to-trade is calculated on a sizeable-lot size for each benchmark product.1 Rather than focus on only a single data point, our analysis shows the ratio of cost-to-trade over the daily true range, showing how far markets move during these volatile periods relative to cost-to-trade.
While the cost to trade (liquidity) did increase, the increase was less than the increase in daily true ranges (volatility), leading to a reduced cost-to-trade vs daily true range (liquidity/volatility).
To analyze the extreme volatility experienced during late February and into March 2020, CME Group considered these holistic data points for the period of initial stress, February 24 – March 13, presented in more detail below. During this volatile period, cost-to-trade did increase on an absolute basis, as is expected given the speed and severity of the market changes. However, in every instance, this increase was smaller than the dramatic increase observed in the daily trading range and average daily volumes; so on a relative basis, cost-to-trade declined in relation to the increase in the daily trading ranges. This illustrates the strength and resiliency of CME Group’s markets during times of crisis, allowing traders to execute significant-lot sizes with moderate increases in cost, in the face of far more dramatic swings across other market variables.
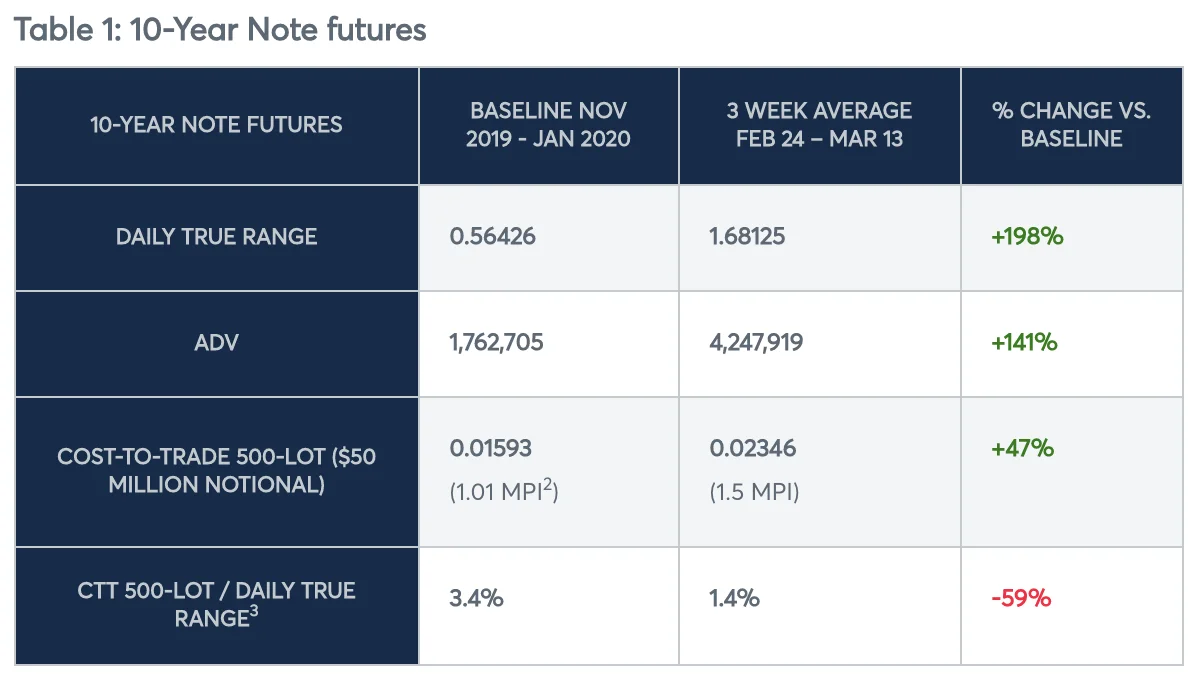
Treasury futures holistic liquidity metrics
The 10-Year US Treasury is the traditional destination for “flight to quality” during times of economic distress and uncertainty, with CBOT 10-Year Note futures as one of the most liquid instruments available for exposure to high-quality fixed income. As such, while the 10Y contract does experience increased price movement alongside other financial products, its depth of market remains robust even in choppy trade. The table below shows that while the daily true range for the three weeks of extreme volatility (February 24 – March 13) increased by nearly 200%, cost-to-trade on a 500-lot trade ($50 million notional value) increased by less than a quarter of that, growing by 47% for the baseline period of November 2019 – January 2020.
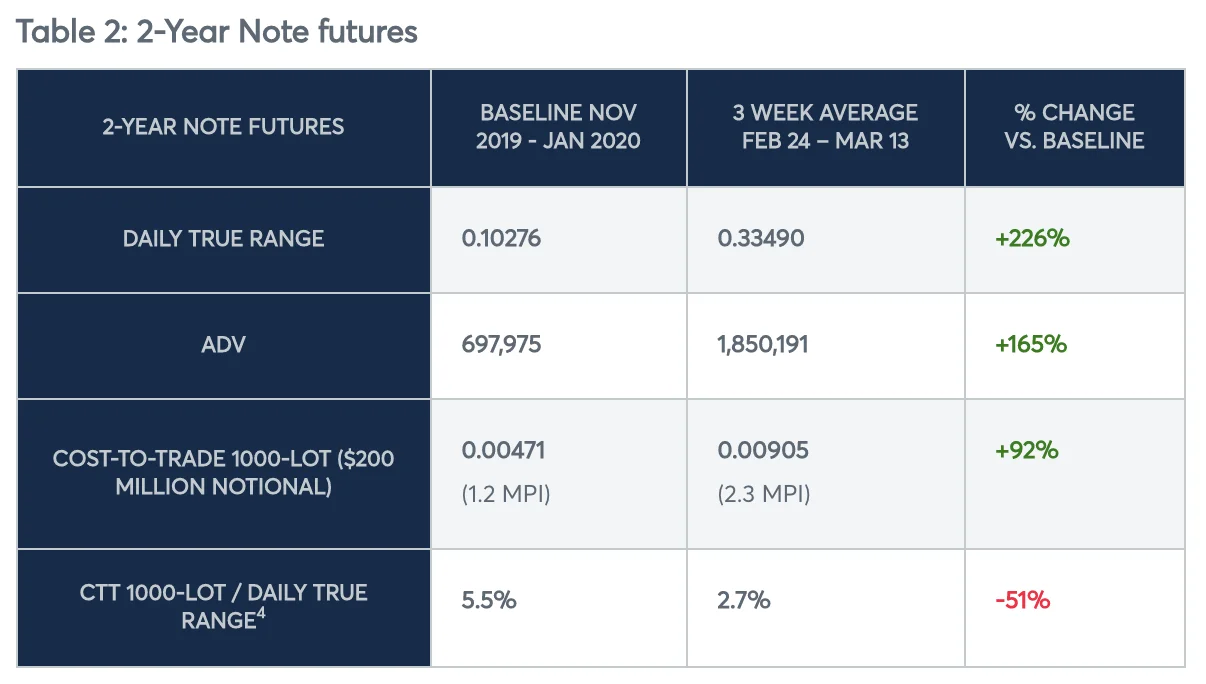
The 2-Year Note futures occupy a similar anchor point at the front end of the yield curve, offering shorter duration exposure. Its tick reduction in 2019 (to one-eighth of one thirty-second) saw more competitive pricing and liquidity build up, leaving it well situated for this March’s volatile conditions. Similar to the 10-Year, the daily true range increased by 226% from the baseline period, while cost-to-trade on a 1,000-lot ($200 million notional value) grew by 92%, demonstrating the resilience of these markets.
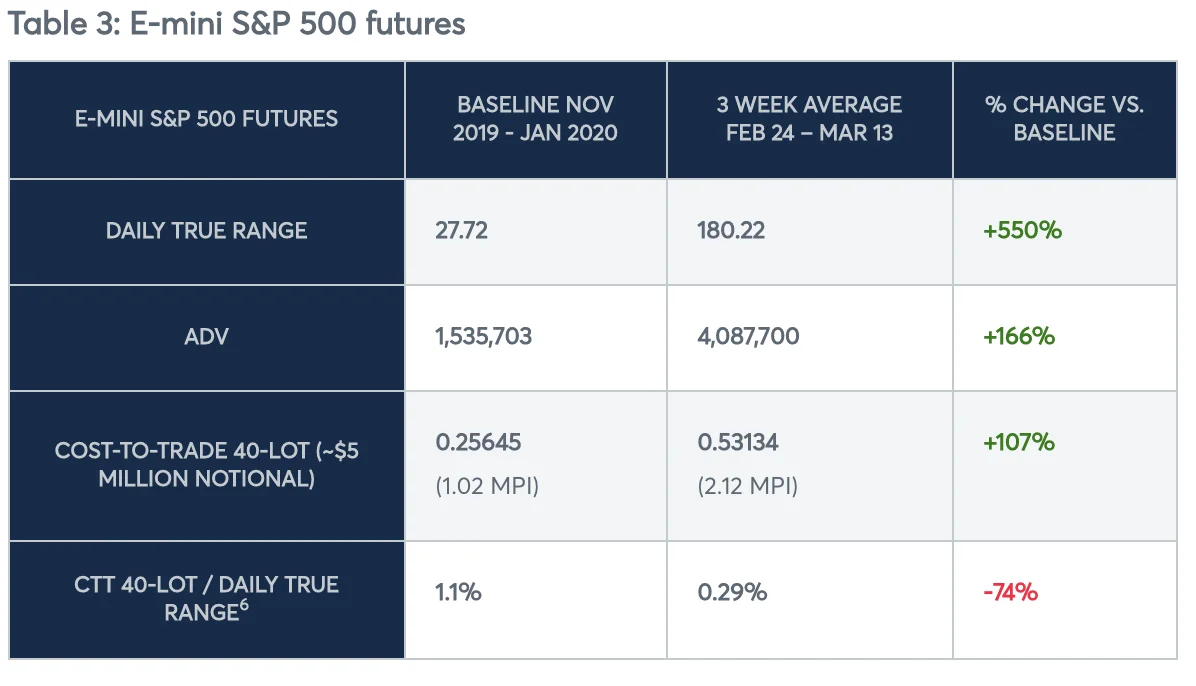
Equity futures holistic liquidity metrics
E-mini S&P 500 Index futures (ES futures) are globally recognized as being representative of the broad equity markets, even outside of the United States. It is these futures that are commonly traded as proxies for many equity portfolios even if those portfolios do not exactly match the constituents of the index, especially during times of market distress. The recent period of market turmoil is no exception as the trading community turned to these futures contracts for equity exposure risk mitigation.
Stay in the know
The S&P 500 index is a capitalization-weighted index across long-standing industries. There was considerable volatility in the equity markets as the whole world attempted to quantify the cost of the disruption, with realized volatility nearing levels most recently associated with the financial crisis of 2008. Throughout this period, the ES remained the most active medium of risk transfer, as observed by trading volumes 6 times higher than comparable ETFs and 1.4 times higher than the cash market.5 While we observed large increases in the daily true range for the E-mini S&P 500, the cost-to-trade for significant-lot sizes increased by much less, demonstrating the resilience of CME’s market quality.
The equity futures markets, especially the ES futures, showed once again that they, as proxies for the broader market, provided a common venue for the transfer of equity related risks without the need to transact hundreds of individual equity names.
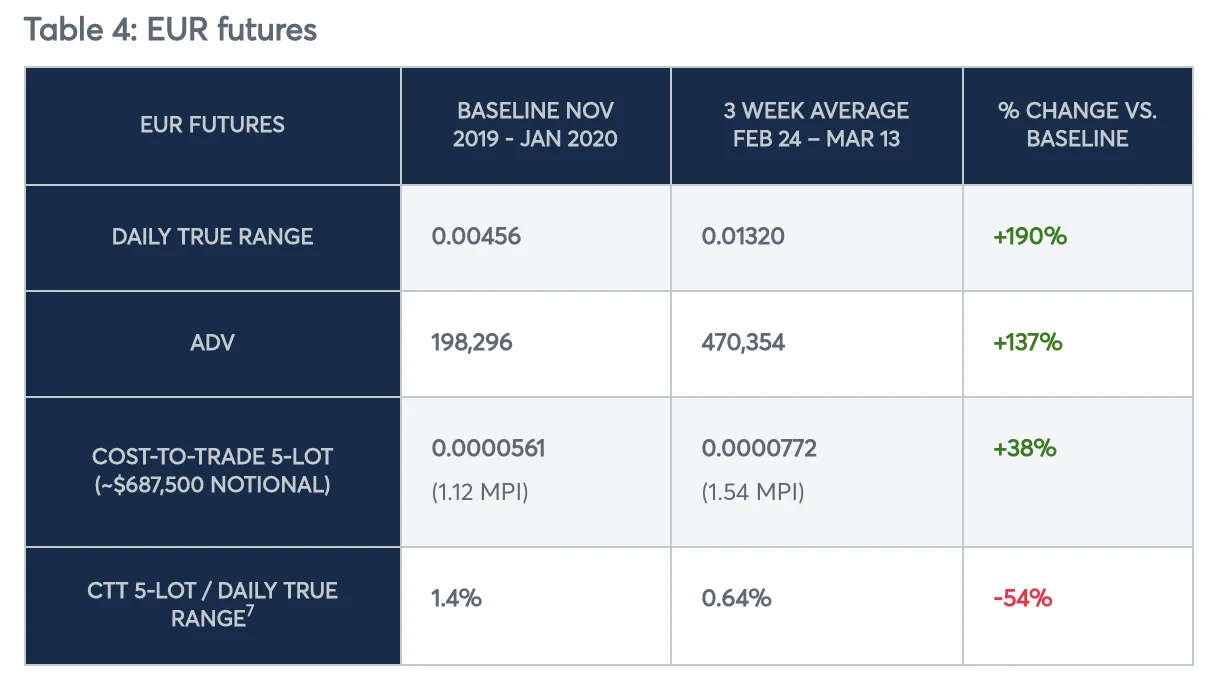
Foreign Exchange futures holistic liquidity metrics
CME’s Euro/US Dollar (EUR) and Japanese Yen/US Dollar (JPY) futures contracts are among the most actively traded listed foreign exchange futures contracts in the world. EUR and JPY futures are globally recognized benchmarks for euro and Japanese yen price discovery and for the risk management of euro- and yen exposures. EUR and JPY futures feature significant volumes and open interest, core central limit order book liquidity and market depth, along with a diverse user base evidenced by the number of large open interest participants. EUR and JPY futures can be traded as complements to the over-the-counter (OTC) foreign exchange markets.
Stay in the know
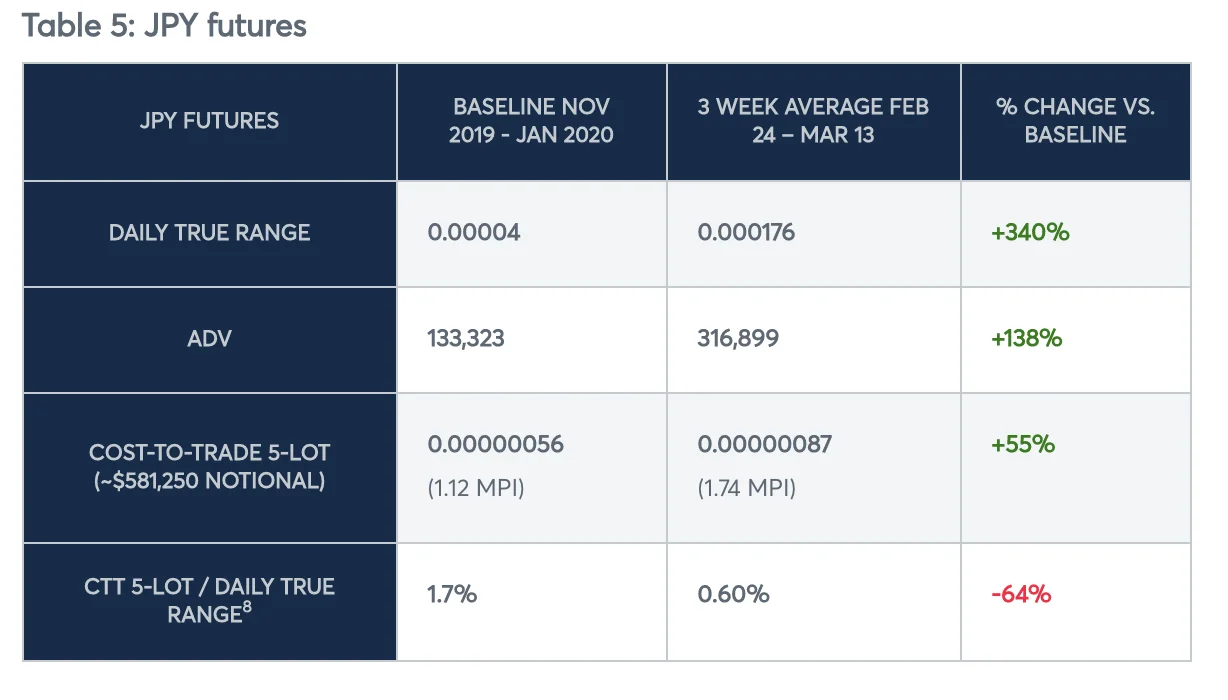
After setting a 27-year low in January, FX volatility was reintroduced, rising from below 6% to over 15% in March 2020. This unprecedented market volatility was observed across numerous asset classes at similar levels to the 2008 credit and financial crisis. During this recent period of market turmoil, market participants successfully utilized EUR and JPY futures to manage their currency risk exposures. While EUR and JPY futures experienced increased price volatility like other financial market instruments during this turbulent period, both futures maintained orderly and robust central limit order books while facilitating “flight to quality” into US dollars and US dollar-denominated assets. Further, the true potential of the minimum price increments reductions, introduced in 2019, demonstrated a more efficient means of price discovery and increased roll activity in light of increased volatility.
Similar to the other financial products, EUR and JPY contracts saw a large expansion of their daily true ranges during increased market volatility. While these ranges increased by 190% and 340%, respectively, compared to the period of higher volatility, cost-to-trade on the 5-lot (~$675,000 notional) increased by only 38% and 55%, respectively. The percentage increase in the daily true range was 5 and 6 times that of the cost-to-trade.
Conclusion
Liquidity is crucial to ensure the proper functioning of markets, especially during periods of extreme volatility. While traditional measures of liquidity can be useful indications of market conditions, they are ill-equipped to tell the whole story experienced by market participants during the volatility of late winter 2020. Using these holistic liquidity metrics, which show the cost-to-trade relative to the daily true range and volume, users can more accurately measure the environment traders faced and the resilience of CME Group’s markets.
Stay in the know
1. All cost-to-trade statistics are from 7a.m. – 4p.m. CT for futures. All other figures reflect the entire trading day.
2. Minimum price increment (MPI)
3. Calculated as a time-weighted average.
4. Calculated as a time-weighted average.
5. Source: Bloomberg March 2020. ETF Symbols: SPY, IVV, and VOO. Cash figures include underlying cash components of the S&P 500 index.
6. Calculated as a time-weighted average
7. Calculated as a time-weighted average.
8. Calculated as a time-weighted average.
Sponsored content
Copyright Infopro Digital Limited. All rights reserved.
As outlined in our terms and conditions, https://www.infopro-digital.com/terms-and-conditions/subscriptions/ (point 2.4), printing is limited to a single copy.
If you would like to purchase additional rights please email info@risk.net
Copyright Infopro Digital Limited. All rights reserved.
You may share this content using our article tools. As outlined in our terms and conditions, https://www.infopro-digital.com/terms-and-conditions/subscriptions/ (clause 2.4), an Authorised User may only make one copy of the materials for their own personal use. You must also comply with the restrictions in clause 2.5.
If you would like to purchase additional rights please email info@risk.net