Cat risk: why forecasting climate change is a disaster

Forecasters are poles apart on climate-driven catastrophes; insurers fear there’s worse ahead
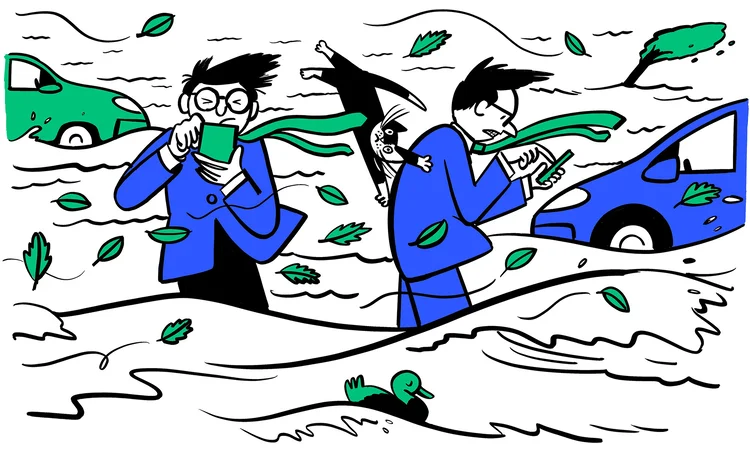
Risk 1119 In depth Mark Long nbillustration.co.uk
Mark Long, nbillustration.co.uk

  • Anthropogenic climate change is accelerating – its effects on the earth are catastrophic, and the fallout for insurers is proving disastrous.
  • Insurers and reinsurers depend on forecasters – and their models – to estimate losses in climate-driven catastrophes.
  • Forecasters’ cat models have in the past relied on historic data that cannot predict worse scenarios than they contain.
  • More dynamic models – GCMs – are on the rise, utilising scenarios that anticipate climate change trajectories.
  • So far, their use has not improved loss forecasts enough for insurers’ tastes.
  • Can forecasters find a sweet spot between cat models and GCMs, or are industry losses set to continue?

The year is 1987. The worst storm in centuries is about to sideswipe the UK with hurricane-strength winds. Notoriously – folklorically – BBC meteorologist Michael Fish addresses a viewer’s concerns: “Earlier on today, apparently, a woman rang the BBC and said she heard there was a hurricane on the way. Well, if you’re watching: don’t worry, there isn’t.”

The storm cost the insurance industry an estimated £2 billion ($2.5 billion). Although Fish claimed his comment was taken out of context, neither the storm itself nor the scale of losses it provoked was forecast by industry models. And the difficulty of modelling catastrophic events – cat risk – is getting more extreme with the march of climate change.

“We can’t quantify the impact of glaciers melting. As soon as you start modelling, you make assumptions. And some of those assumptions are fairly heroic,” says Swiss Re chief risk officer (CRO) Patrick Raaflaub. “That’s what reinsurance companies have to do for a living, but that doesn’t make us necessarily better at predicting outcomes.”

To help them with estimating the costs of cat risk to their business, the insurance industry relies on the expertise of cat modelling firms, the two most prominent of which are AIR Worldwide and RMS. They have the unenviable task of quantifying those loss estimates.

“There’s so much uncertainty in present-day risk,” says a leading climate scientist at one of the largest Lloyd’s of London reinsurers, addressing the difficulty of pinpointing those numbers. He points to the initial model-assisted loss estimates for Typhoon Jebi – which struck Japan and Taiwan in 2018 – of just “a few billion”. In September, AIR raised its current loss estimate to $13 billion – but others suggest these figures will continue to rise with time and analysis – a phenomenon insurers call ‘loss creep’.

“Every month, they’re getting higher and higher,” says the climate scientist. “And they’re all wrong.”

Regularly estimating loss levels significantly below actual loss values and disparities between the two firms’ estimates have worrying implications for insurers: that event impact is changing too rapidly to keep up; that event signals are too open to interpretation; or that the best-in-business firms are seriously diverging on their approaches.

Whatever the reason for the differences, the industry is in search of a solution to deliver more consistent and accurate ways of capturing potential losses arising from cat risk, and may turn to synthesised techniques as a way forward. It implies a lot more work for an insurer that historically consults both – and then decides on a middle way.

At a loss

2017 and 2018 were the costliest back-to-back years for insurers, with losses totalling $237 billion, according to data compiled by Aon. Last year, insured catastrophe losses totalled $90 billion, the fourth-highest on record. Weather disasters, among them hurricanes Michael and Florence and Typhoon Jebi, accounted for $89 billion of the total. In all cases, model predictions were significantly below actual losses (for more on historic losses in Japan, see box: A (very) brief history of cat modelling).


Looking across five major cat events of 2018, each of the two firms’ average estimated loss was well below the actual loss – at $12.75 billion in the case of RMS and $15.75 billion for AIR – an average of $14.25 billion – roughly 65% below the true loss figure of $40.3 billion.


In the case of Typhoon Jebi, losses estimated by RMS were between $3 billion and $5.5 billion, while AIR’s estimate was between $2.3 billion and $4.5 billion, which brings an average of AIR and RMS estimates to $3.825 billion. According to Aon, insured actual losses were $8.5 billion. So the two firms’ average estimates for Jebi were off by over $4.675 billion – more than 100%.

The least stark differential in the sample was for Hurricane Michael, in which actual loss amounted to $10 billion versus average estimates of $8.4 billion and $8 billion from RMS and AIR respectively. In the Woolsey Fire, they respectively estimated losses of $2.25 billion and $2.5 billion* on a $4.5 billion actual loss.

The research is saying that we might not expect more individual storms – but we may expect, globally, more intense storms
Pete Dailey, RMS

The disparity between the two firms’ estimates is also cause for concern – and central to the problem of effectively estimating cat risk. It suggests that the loss estimates being made in this field are in something of a state of disarray.

And as climate change advances, the gap isn’t getting any narrower. “Even Hurricane Dorian in the Bahamas this year, there’s no overlap in the loss estimates between RMS and AIR,” says the climate scientist. “So there’s this level of uncertainty.” AIR’s estimate is between $1.5 billion and $3 billion, while RMS puts it between $3.5 billion and $6.5 billion. He believes that future incidents are likely to be “an order of magnitude” greater.

Peter Sousounis, a meteorologist and the director of climate change research at AIR, says that modelling firms don’t always look at the same criteria. Two significant factors that AIR did not include in its Dorian estimates, he points out, are damage to infrastructure and ‘demand surge’ – the latter a phenomenon wherein repair and replacement costs are higher following large-scale disasters than they would be normally. A damaged roof, for example, might cost $X to replace on a normal day, but when there are 500 roofs with the same sort of damage in one geographic area, prices increase.

He says: “Given the devastation to Abaco, these factors could amplify losses significantly, and are probably largely responsible for significantly higher loss ranges.”

“The research is saying that we might not expect more individual storms – but we may expect, globally, more intense storms,” says Pete Dailey, a vice-president at RMS. The atmospheric scientist and meteorologist, who supervises RMS’s flood modelling, points out that hurricane-prone regions should begin to expect “fewer category ones and twos, but more threes, fours and fives – and those are the category of storms that produce much more loss”.

Asked whether AIR and RMS are responding to climate change differently, Sousounis says: “Our catastrophe models are founded on historical data, like most others. But we do not arbitrarily or indiscriminately incorporate all available data – at least, not with equal weight, and especially if those data show a long-term trend that can be attributed to climate change.”

The firm that merges decadal climate models into traditional stochastic natural catastrophe models the most quickly and credibly will be the winner
Alison Martin, Zurich

In AIR’s view, a 40-year window is the ideal in most circumstances, Sousounis argues, because climate change happens slowly: interannual variability, he says, can “easily” have an impact greater than climate change in “any given year”. As such, 40 years is enough to include variability without capturing “obsolete” climate data from the more distant past. “There are exceptions in either direction, of course,” he adds. “For example, our tropical cyclone models tend to include longer periods of data – but only because analyses have shown there is no detectable long-term trend in landfall activity.”

RMS did not respond directly to questions on the difference between the two firms’ estimates.

Cat model crisis?

There’s no doubt that anthropogenic climate change is making the jobs of the cat modellers significantly harder. Global warming produces a demonstrable increase in the incidence of extreme weather events. In light of such singular ecological disruption, the historical approach to cat modelling can seem dangerously optimistic or narrow. The technique certainly helps insurers evaluate the probability of the reoccurrence of events for which there is some precedent, but isn’t so useful when it comes to predicting the extraordinary.

Insurers use cat models to estimate losses from natural disasters such as hurricanes and earthquakes, and set premiums accordingly. The models are fed with data from historical records, which means they don’t account for the effects of climate change, which is resulting in more severe weather events.

Cat models often use stochastic methods as a starting point. Before losses can be estimated, stochastic processes are used to generate a large distribution of plausible catastrophe events and associated physical phenomena. These event distributions are based on expertise and whatever historical data is available for a given event type. Next, modellers simulate the impact of these hypothetical disasters on their known exposures. Exposure data might include geographic location, typical repair costs and the reliability of local infrastructure. In the last stage, models produce damage estimates based on the information they have been fed by their operators.

But Greg Shepherd, CRO at Markel, another of the largest underwriters at Lloyd’s of London, points out that cat models are less useful for forecasting severe natural catastrophes that are “far more extreme than we’ve seen before, or in a location where we never expected one to occur” because, at the outer limits of the tail, there’s no historical data to feed the model. A cat model would be unable to spit out an accurate dollar value for a hurricane caused by changing weather patterns striking London, for instance, because not enough losses of a similar type would have been inflicted on insured properties in the past.

That leaves reinsurers having to price business whose exposure could alter fundamentally over the coming decades, says Shepherd’s opposite number at a large European reinsurer. Claims could come due in 30 years or more – but in terms of realised losses, says the CRO of a large European reinsurer, “we only know when it happens”.

“Look at wildfires: we can say, with a very high degree of certainty, that climate change is having an impact on the frequency and severity of losses there. But there’s also a suspicion that climate change will have an impact on large hurricanes, for example. That is an area where we know exposures are increasing: there is more being built in exposed areas, and rising ocean levels mean even more areas exposed. But if you look at the actual frequency and severity of losses, so far, it’s a plausible suspicion, but no more than that. Where the risk is materialising very, very slowly and we have very few data points, it’s really hard to track whether your prediction is successful or not. That’s when you need more margin around your predictions: you can’t take aggressive bets.”

It’s basically a set of synthetic events – events that haven’t happened – that we can create over thousands of years
Tina Thomson, Willis Re

Alison Martin, CRO at Zurich, agrees stochastic modelling techniques are limited in usefulness for now. Every firm, she says, is working on merging decadal forecasting – estimating climate variations over a decade – with orthodox stochastic models. Anthropogenic natural disasters are now more visible than ever, and this burgeoning historical record may soon be more readily operational.

“The firm that merges decadal climate models into traditional stochastic natural catastrophe models the most quickly and credibly will be the winner,” she says. “They will be able to say: ‘We can attribute X storm, X flood, X wind event to climate change’ – and the modelling would support it: ‘Here is the economic cost of climate change.’ No-one has done that yet, successfully. It’s a trillion-dollar question.”

A (very) brief history of cat modelling

The emergence of catastrophe modelling in the late 1980s was a cause for cheer among insurance companies. Weather-related losses – such as those caused by the storm of ’87 – that had plagued businesses, in some cases leading to major insolvencies, seemed as if they would soon become a thing of the past. Through leveraging cutting-edge science and mathematics, the portfolio impact of natural disasters could be simulated, assessed and understood. Premiums could be adjusted accordingly. Physical risk could be given dollar figures with new confidence.

But, given that event catalogues are generally based on the recorded characteristics of pertinent incidents throughout history, the most disastrous event a history-fed cat model can simulate will only be as severe as the severest event in that record.

For this reason, cat models did not prepare insurance companies for the 2011 Tōhoku Earthquake, which produced losses far exceeding the projected probable maximum losses of most of the industry. While Japan is a notoriously earthquake-prone country, experiencing over 1,000 tremors of varying intensity every year, an event such as Tōhoku – a nine on the moment magnitude scale – was wholly unprecedented. It was the most powerful earthquake ever recorded in that part of the globe and the fourth-largest earthquake ever in recorded history. Thousands died as resultant tidal waves battered Japan’s islands, and aftershocks were felt as far as Russia.

“Nobody had considered a magnitude nine,” says Adam Podlaha, head of impact forecasting at Aon. “By definition, it could not be in the catalogues.” Munich Re, a large reinsurance company, estimated the insured losses caused by Tōhoku as $40 billion, while the World Bank said the total economic cost could reach over $200 billion. Swiss Re, another global reinsurer, stated that while the tremors themselves were within worst-case-scenario projections, the tidal behaviour and aftershocks following the quake constituted “blind spots” in the existing vendor models.

Tōhoku and events like it were dismissed as black swans – unanticipated super-outliers with extreme results – which, by definition, occur only rarely.

What is certain about climate change, scientists say, is that it will lead to climatic conditions where these black swans cease to look like such outliers.

Another world, another planet

New techniques could introduce more accuracy to estimating climate change-related losses.

“Standard actuarial techniques are simply not sufficient for natural hazards,” says Tina Thomson, a geomatic engineer and head of catastrophe analytics for Europe, the Middle East and Africa west-south at Willis Re, the specialist reinsurance division of Willis Towers Watson. There are, she says, simply not enough Tōhoku or Katrina-level events recorded for actuarial techniques alone to be applicable. As such, the insights created by a stochastic catalogue are seen as incredibly valuable.

Insurers are being spurred by regulators and think-tanks to start applying so-called ensemble techniques to their exposures – an umbrella term for model-based quantification methods that employ multiple models at once. The two cornerstones of this approach are the familiar cat models and general circulation models, or GCMs – vast, planet-scale climate simulations that are maintained by academic institutions and governments.

You get your weather distribution. But how do you know it’s the right distribution?
Maryam Golnaraghi, Geneva Association

A GCM, also known as an ‘earth system model’, is essentially a replica earth with a realistic meteorology of its own that responds to programmable stimuli. By adjusting various parameters, modellers can create any number of ‘what-if’ planets, each with their own climatic, oceanic and atmospheric conditions. The inherent differences between the fake earths and the original can be as large or small as the modeller wants. A researcher might decide they want to see what would happen to world weather if sea surface temperatures suddenly rose by 3%, for example, or if pressure began changing by tiny increments in the troposphere.

In most circumstances, the simulated disasters occur in step with scenarios set out by the Intergovernmental Panel on Climate Change (IPCC) – a set of potential warming outcomes in which the world has become a degree or two hotter than it is today. Using authentic parameters taken from recorded history, modellers watch to see whether the simulated earth produces consistent and believable outcomes – appropriately sized hurricanes, accurate tidal behaviour, regular temperatures, and so on – that are faithful to those that have been successfully documented on our real planet.

“It’s basically a set of synthetic events – events that haven’t happened – that we can create over thousands of years,” says Thomson. “Tens of thousands, hundreds of thousands [of] simulations of potential events. Then we can quantify the impact.”

“The utility of that is that it allows events that have not occurred in the historical record to actually ‘occur’,” says AIR’s Sousounis. “And that’s an important consideration when it comes to climate change.”

Even the most sophisticated modelling, however, can’t do much to diminish the uncertainty inherent in anthropogenic climate change. The nature of global warming and the lack of obvious collective action plans mean that financial firms have a near-endless quantity of competing voices to choose from on the topic.

“[The] IPCC has counted four basic scenarios,” says Sousounis. “And I’m guessing there are probably 10 times that number of general circulation models, and they do different kinds of experiments.” There are even more cat models than that, he continues: “Let’s take 40 models and four climate change scenarios – that gives us quite a number of output possibilities.”

Maryam Golnaraghi, director of climate change and emerging environmental topics at The Geneva Association, says a GCM generating consistent distributions is not proof alone that the model is feasible for use in constructing projections. A given GCM’s behaviour may be regular, but the simple production of a trend does not guarantee its accuracy to the real earth. It has to produce the correct trend. Proving that worthiness, she adds, is no small task: to demonstrate a model’s ultimate accuracy, a GCM will be tested against observable data.

“You get your weather distribution. But how do you know it’s the right distribution?” asks Golnaraghi. “You run it over and over – maybe 200 or 400 times – and you start to determine whether the model is giving you distributions that fall towards the same pattern.”

AIR and RMS both attest to using GCMs in various instances. AIR currently uses GCMs in modelling for hazards including flood and extra-tropical cyclones for the US, Europe and Japan. The firm uses GCM information to guide outputs from high-resolution numerical weather prediction models, which produce realistic simulations of precipitation systems.

The sweet spot is to find a period of record where we can capture a good representation of the current climate, as well as having a sufficient amount of historical record to represent the variability
Peter Sousounis, AIR

RMS uses GCMs extensively in its modelling work, according to a spokesperson. The events in the firm’s models for North American winter storms and European windstorms were generated by GCMs run in-house, and some elements in its Japanese typhoon and North Atlantic hurricane models are based on similar in-house simulations. It also uses simulations from the climate science community. Its medium-term hurricane rates are based on sea surface temperature projections created by the Coupled Model Intercomparison Project framework – one family of models used in informing the climate change reports issued by the IPCC.

RMS says that its work on future surge risk is based on sea levels taken from CMIP5, the fifth phase of the CMIP experiments. The firm says it uses hurricane rates from the same source when looking into future hurricane loss. GCM outputs are becoming more realistic, says RMS, and will play a larger role in catastrophe modelling in future.

The Goldilocks configuration

Outputs from GCMs are not taken at face value, however – before a given GCM’s projections can be established as trustworthy, they are subjected to a model validation. “The model is put through an extensive verification process against the past,” says Golnaraghi. “They try to replicate the past with the model to make sure that those numerous times they run it are actually going in the right direction. It’s extremely time-consuming and resource-intensive.”

A combined GCM and cat model approach could prove highly useful. GCMs measuring present-day climate risk can be compared with another set of models running climate change scenarios, and the differences between the outputs of the two groups can be evaluated.

“By comparing a climate change-conditioned model to a baseline model – a model that’s measuring the risk of climate change today – you’re given the sort of marginal effect of climate change,” says RMS’s Dailey. “That would be a test of the sensitivity of that risk to climate change, which can be measured for the industry as a whole – let’s say, all insured properties across the entire UK – or it could be run for a portfolio.”

So, despite the criticisms, the humble cat model is not set to be retired just yet. While it lacks predictive potential of its own, it can be used to make sensible estimates about the unknown with a little help. By using more than one type of model concurrently, insurance firms can plan for a range of potential climate change impacts – that is, plan for the realistic consequences of events that have not yet occurred in recorded history.

Historical catalogues, meanwhile, improve every year as record-keeping becomes more and more sophisticated. Modellers themselves are also largely in agreement with regard to how records-based cat modelling should be practised.

“The sweet spot is to find a period of record where we can capture a good representation of the current climate, as well as having a sufficient amount of historical record to represent the variability,” says Sousounis. “[For] most of the models we’ve built, we use the last 30 to 40 years of record.”

For AIR, this is the Goldilocks range, says Sousounis: timescales that are too short risk the misinterpretation of quasi-periodic and naturally existing climate cycles such as the El Niño-Southern Oscillation and the Atlantic Multi-decadal Oscillation, which are large enough to cause measurable changes in global temperatures and hurricane activity; and selection of timescales that are too long will start to include data that is of relatively poor quality.

Dailey says this topic in particular is extremely hot among RMS clients: “There’s absolutely been a pickup in the interest level. In 2017, we saw hurricanes Harvey, Irma and Maria, all in a row. In 2018, hurricanes Florence and Michael, and then just this year, Hurricane Dorian. We’ve had three years in a row where major hurricanes have produced major losses in highly insured areas. We’re engaged with our clients every day on climate perils, but outside of our traditional market – and even beyond capital markets – individual corporates are very much interested.”

Corporate interest and action, says The Geneva Association’s Golnaraghi, are of crucial importance if the problem is to be tackled in time. She argues that the financial industry at large must engage productively with climate and cat modelling, enhance its understanding of the work being conducted and devote significant resources to upskilling its leaders. Without mobilising in this way, she says, the decisions made will remain based on poor understanding of a complex topic.

But if the industry manages to sufficiently focus on the issue, perhaps it would help modellers find a solution with more precise results. One that is just right.

Regulatory guidance on the way?

Although the Bank of England (BoE) has not yet taken decisive steps to regulate climate-related financial risk, it is encouraging banks to start thinking about the issue. The most significant action to date was the Prudential Regulation Authority’s supervisory statement in April – a formal set of rules and policy expectations. But the 16-page document is light on practical detail. It encourages financial firms to “consider” climate risk and “embed” it into existing financial risk management practices without prescribing how. The statement sets out the importance of stress-testing, scenario analysis and disclosure procedures with some clarity, but does not provide a firm set of standards, principles or directions for implementation.

The PRA has also said that firms must assign individual responsibility for climate risk management under its flagship Senior Managers and Certification Regime – but with climate risk management nebulously defined, responsible individuals will have to await further instruction. The same is true for insurers.

“A lot of vendors have responded to the PRA, but where we’re going, exactly – the road map – is up to them,” says a senior climate scientist with one of the largest Lloyd’s of London reinsurers. He goes on to discuss the BoE’s stress-test scenarios: “They described the scenarios they would like submitted. Our understanding is that it’s not something that is compulsory ... to be used to measure capital resilience.” He confirms that his firm wants to make progress on climate risk, and will be taking part in the tests.

Many insurers that Risk.net spoke to for this article echo these sentiments, agreeing that the PRA’s attention to climate risk – while positive and a clear signal to other regulators – has not yet resulted in granular requirements. But it’s a start, they agree.

“It will drive changes in behaviour,” says Tina Thomson, a geomatic engineer and head of catastrophe analytics for Europe, the Middle East and Africa west-south at Willis Re, the specialist reinsurance division of Willis Towers Watson, of the current regulatory stance. “The PRA has collaborated with a number of industry experts to define these initial scenarios, and they’re in line with UK climate projections. However, insurers still need to look at how they apply the PRA stress tests to their portfolios, and that is where we have been assisting our clients with the application of the scenarios.”

Additional reporting by Tom Osborn


Editing by Louise Marshall

Only users who have a paid subscription or are part of a corporate subscription are able to print or copy content.

To access these options, along with all other subscription benefits, please contact info@risk.net or view our subscription options here: http://subscriptions.risk.net/subscribe

You are currently unable to copy this content. Please contact info@risk.net to find out more.

Most read articles loading...

You need to sign in to use this feature. If you don’t have a Risk.net account, please register for a trial.

Sign in
You are currently on corporate access.

To use this feature you will need an individual account. If you have one already please sign in.

Sign in.

Alternatively you can request an individual account here