
This article was paid for by a contributing third party.More Information.
CME SOFR Futures – Year One

CME One-Month SOFR (“SR1”) futures and Three-Month SOFR (“SR3”) futures debuted a year ago. The following reflects upon developments since then in the underlying Secured Overnight Financing Rate (“SOFR”) benchmark, in the futures liquidity pool, and in adjacent derivative and asset markets, and it concludes with an overview of key next steps to promote adoption of SOFR as the alternative US reference rate.1
SOFR Puts Down Stakes
Since its arrival in April 2018, SOFR’s calculation is based on over $800 billion per day in overnight Treasury repo transactions,2 more trade volume than in any other interest rate benchmark. It’s big and getting bigger: SOFR’s underlying repo traffic flows ran $960 bln/day for Jan-Apr 2019 (April YTD), a 19 percent gain over the $806 bln/day average pace for Apr-Dec 2018 (Exhibit 1).
Exhibit 1
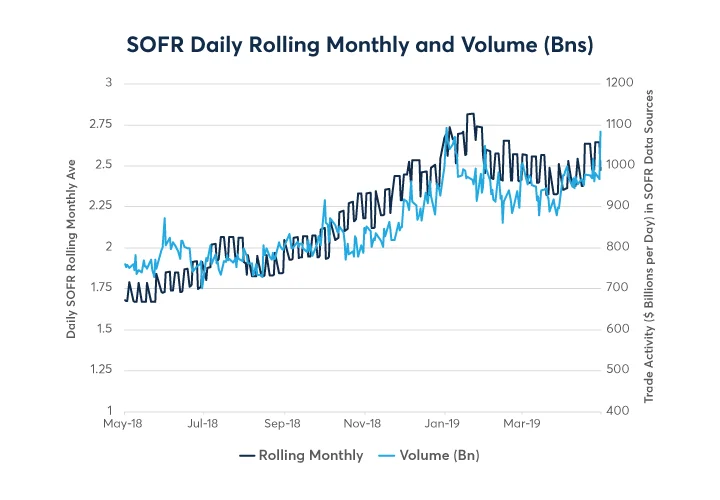
Meantime, the spread between SOFR and the daily effective federal funds rate (“EFFR”) has fluctuated within a stable range of 10 basis points per annum. Among other things, this indicates that CME One-Month SOFR futures and 30-Day Federal Funds futures enjoy a complementary relationship, opportune for relative value spread trading.
SOFR Futures Flourish
CME SR1 and SR3 futures rank among the fastest-growing new products in the exchange’s history. Since a year ago, participation in the greater SOFR futures liquidity pool has risen and broadened steadily, now comprising more than 140 firms, reflecting a balanced mix of bank, buyside, and prop trading firms.
Intermarket spreads – for instance, between 30-Day Federal Funds futures and SR1 futures, or between Three-Month Eurodollar futures and SR3 futures — are increasingly popular, contributing significantly to trading volumes and augmenting the SOFR liquidity pool. And block trading in both SR1 and SR3 (in each case, both outright and in spreads) evidences that the products are earning acceptance as tools for industrial-strength risk control and risk acquisition.
During Jan-Apr 2019, SOFR futures changed hands at the rate of 28,000 contracts/day, or about $775,000 per day in terms of the dollar value of one basis point (“DV01”) of SOFR exposure. Open interest at the end of April was around 125,000 contracts, roughly $4.2 mln in DV01 terms. Among the remarkable features of the SOFR liquidity pool is the persistent near-equality of open interest in SR1 futures and SR3 futures (Exhibit 2), evidencing that the two products perform complementary roles despite being based upon the same underlying SOFR benchmark.
Exhibit 2

SOFR FRN Issuance Blossoms
As of 8 May 2019, 22 institutions have issued more than $100 bln face value in floating rate securities tied to SOFR, with $62 bln having been issued in 2019 alone.
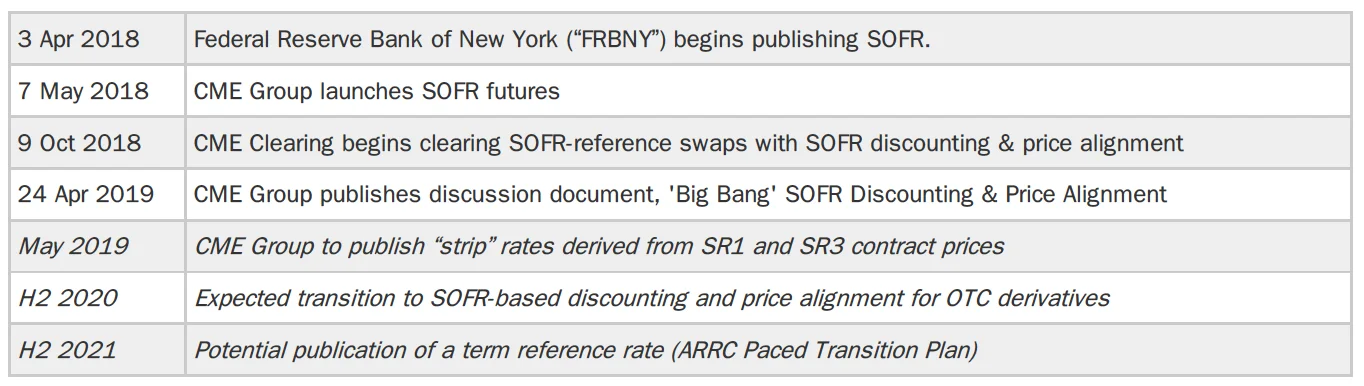
Market Adoption of Alternative Reference Rates – Key Dates
Milestones in the SOFR saga, past and future, are as follows:
References
1. SOFR is a broad measure of the cost of borrowing cash overnight collateralized by U.S. Treasury securities in the repurchase agreement (repo) market. For more information, please see CME, What Is SOFR? , March 2018.
2. Its massive supporting transaction data flow, among other features, is a reminder that SOFR was developed in alignment with international best practices, as exemplified by the IOSCO Principles for Financial Benchmarks. For more information, see ARRC, SOF R: A Y ear in Review , April 2019.
Sponsored content
Copyright Infopro Digital Limited. All rights reserved.
As outlined in our terms and conditions, https://www.infopro-digital.com/terms-and-conditions/subscriptions/ (point 2.4), printing is limited to a single copy.
If you would like to purchase additional rights please email info@risk.net
Copyright Infopro Digital Limited. All rights reserved.
You may share this content using our article tools. As outlined in our terms and conditions, https://www.infopro-digital.com/terms-and-conditions/subscriptions/ (clause 2.4), an Authorised User may only make one copy of the materials for their own personal use. You must also comply with the restrictions in clause 2.5.
If you would like to purchase additional rights please email info@risk.net