
This article was paid for by a contributing third party.More Information.
Boosting the ESG exposure of a low‑risk portfolio

Nikolay Radev, senior quantitative researcher at FactSet, discusses the limitations of previous environmental, social and governance (ESG) measurement, and proposes a new approach to optimising ESG exposure in minimum tail-risk (MTR) portfolio construction
During the past decade, companies’ ESG characteristics have become an important consideration for many investment professionals. The emergence and development of this trend have seen a variety of ways investors seek to improve the ESG properties of their portfolios. The earliest and most common approach to achieving this is to exclude companies that score below a specific ESG threshold. While simple, this approach can be limiting when other investment objectives are also pursued. As a result, more flexible reweighting‑based methods have been adopted.
Another important investment approach that gathered momentum in the aftermath of the global financial crisis that began in 2007–08, and has again become relevant in recent periods of market volatility, is low-risk strategies. The most well-known strategy is based around minimising portfolio variance, often referred to as minimum volatility. This framework is straightforward to implement and has been used in different forms for decades. However, the minimum volatility approach struggles to account for several well-established properties of asset returns, such as fat-tailed and asymmetric distributions and the likelihood of extreme negative events occurring together. To address these shortcomings, the MTR methodology has been developed, allowing adequate modelling of these properties by utilising a simulation-based risk model that can capture the skewness and kurtosis of return distributions, as well as the tail dependence. Another key aspect of the methodology is expected tail loss (ETL) – also known as conditional value-at-risk – which is a risk measure used for optimisation. In contrast to minimum volatility, minimising ETL – which is a downside risk measure – does not directly impact the upside potential of the portfolio.
This article demonstrates a seamless way of introducing an ESG target to the MTR portfolio construction process, resulting in the combined benefits of a low-risk strategy and an enhanced ESG exposure. It also analyses how additional ESG targets impact the portfolio characteristics.
This analysis employs the Truvalue (TVL) adjusted insight score as the ESG measure. TVL provides metrics that capture positive ESG behaviour and controversies alike for more than 187,000 public and private companies. TVL’s adjusted insight score measures a company’s long-term ESG track record. For low- and no-volume companies, the adjusted insight score uses a blend of the company’s insight score and the industry median insight score. For medium- or high-volume companies, the adjusted insight score is equivalent to the insight score.
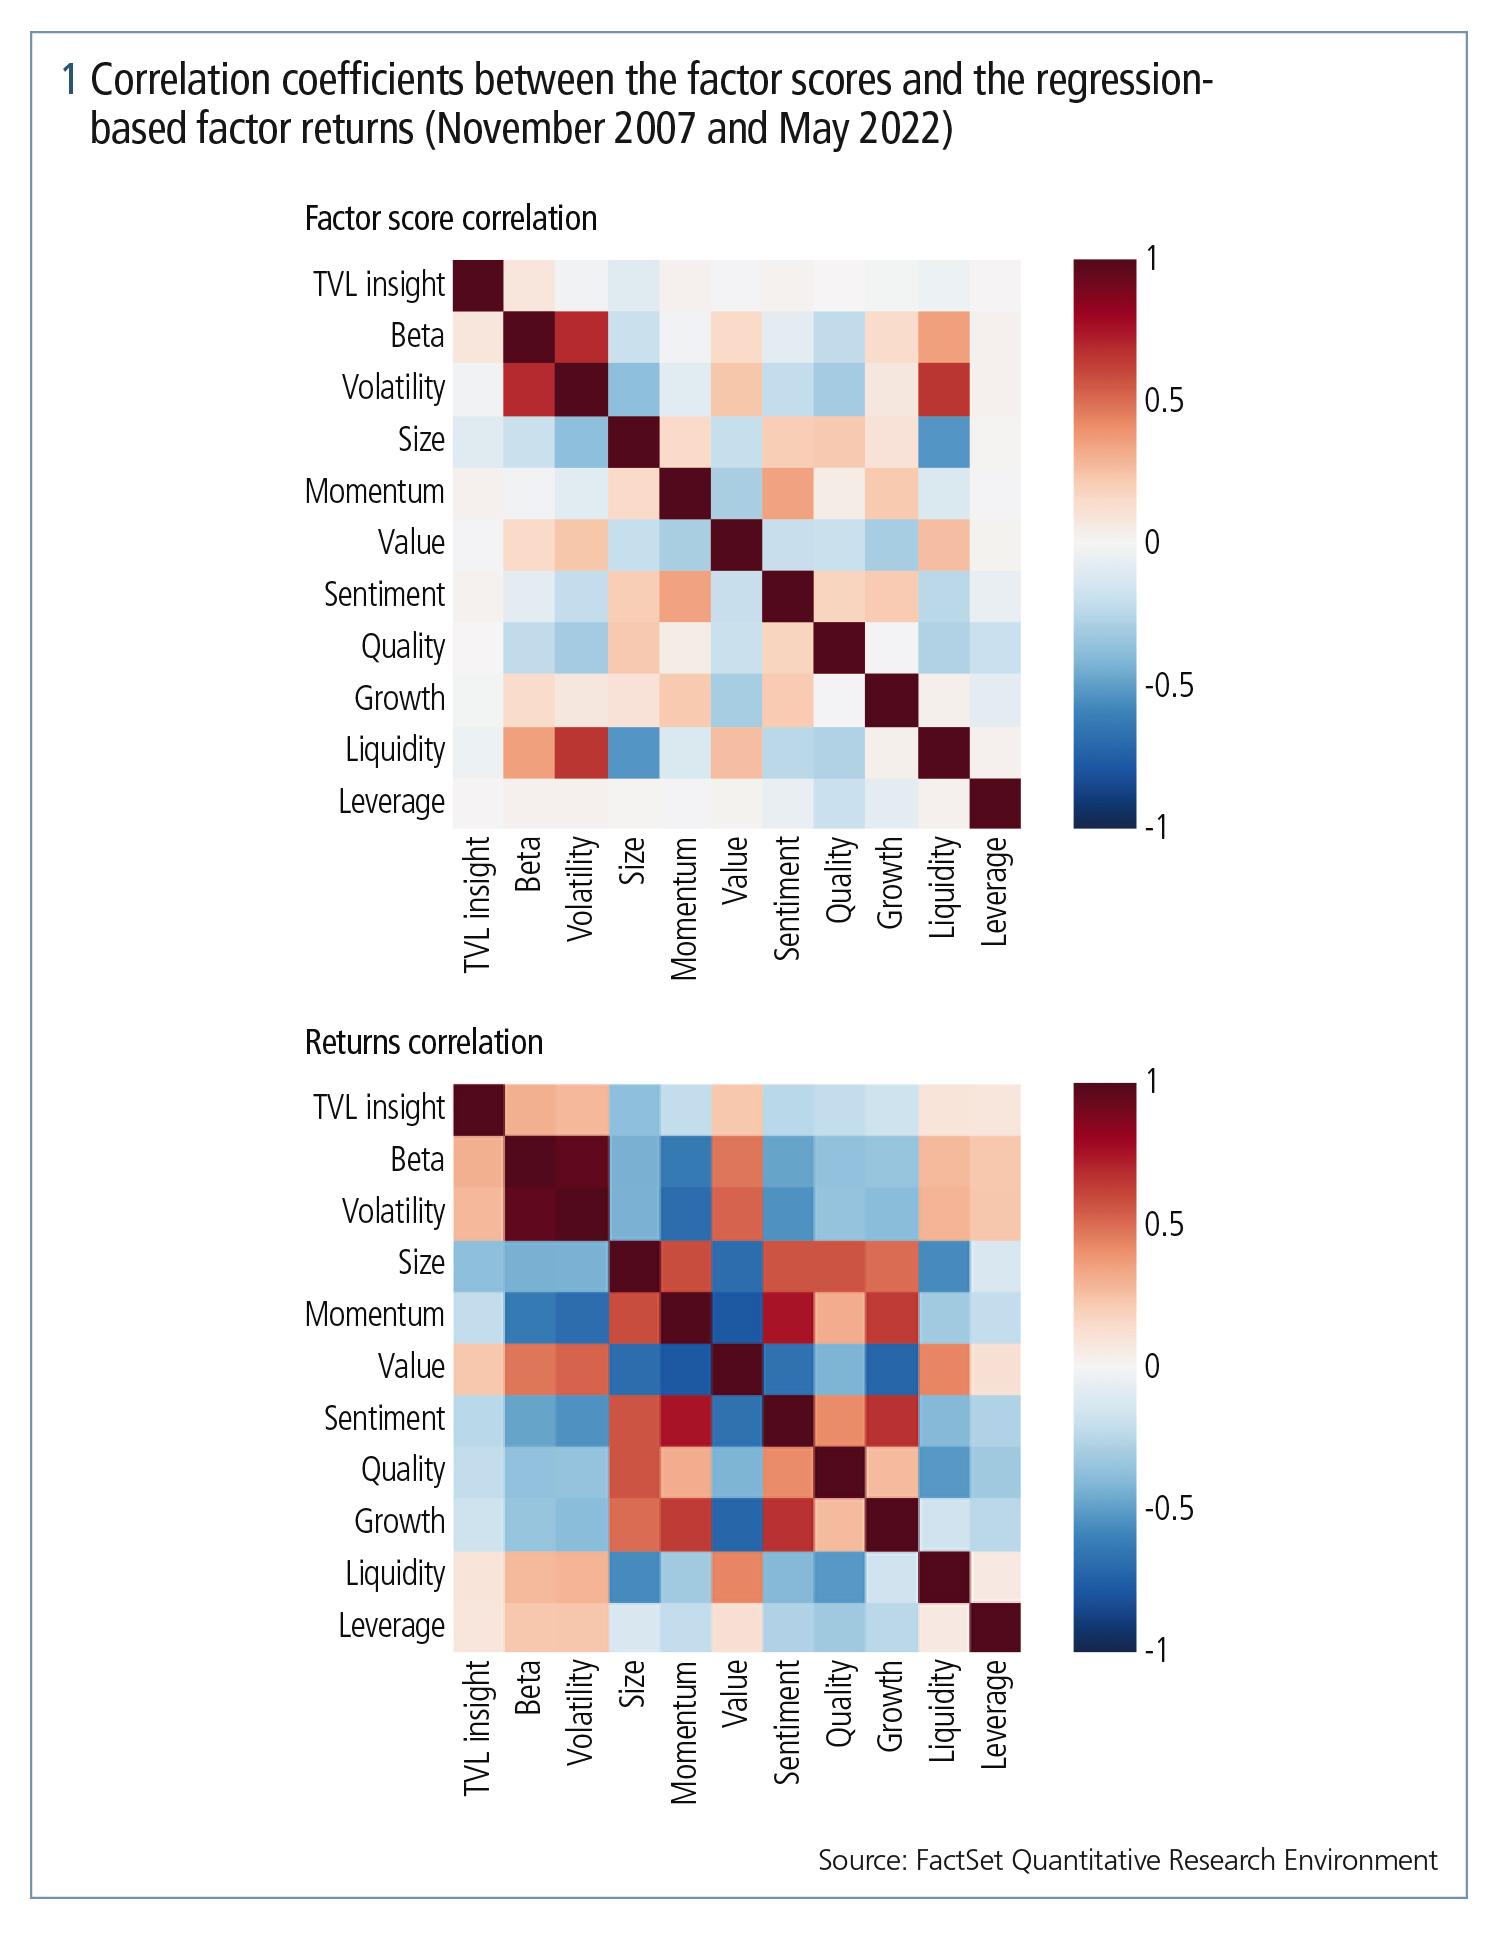
To demonstrate the unique nature of the TVL data and ensure that increasing the ESG exposure will not tilt the portfolio towards a particular factor, this analysis looks at how the adjusted insight score correlates with 10 well-known equity factors. Figure 1 presents the correlation coefficients between the scores and returns of those factors between November 2007 and May 2022. The correlation coefficient of the TVL-adjusted insight score to the remaining factor scores varies between -0.088 and 0.087, while the correlation between the other factors is significantly more pronounced, between -0.527 and 0.695. In the correlation between the regression-based returns, a similar tendency is visible: the correlation of TVL-adjusted insight to other factors is much weaker compared with the correlations between many of the remaining factors. Based on these results, it can be concluded that, by targeting a higher ESG exposure, pressure will not unknowingly be exerted towards a particular equity factor.
The next step of this analysis is to backtest the MTR portfolio and the MTR portfolio with an ESG target in the period between November 2007 and May 2022. Both are constructed by following the MTR methodology, using a universe of large-cap US stocks, and are rebalanced semi-annually. Meeting the ESG score target for the latter portfolio is ensured by introducing an additional constraint to the portfolio optimisation setup that restricts the optimal portfolio to a weighted average ESG score higher than a target level. This target level is set at each rebalancing date to be equal to the market cap-weighted average ESG score of the top half of assets in the universe by ESG score. This way, a significantly higher ESG score than that of the market cap portfolio is ensured, without the hard restriction on investing in companies with worse than average ESG characteristics. However, investment in such companies must be offset with higher weight in high-scoring stocks.
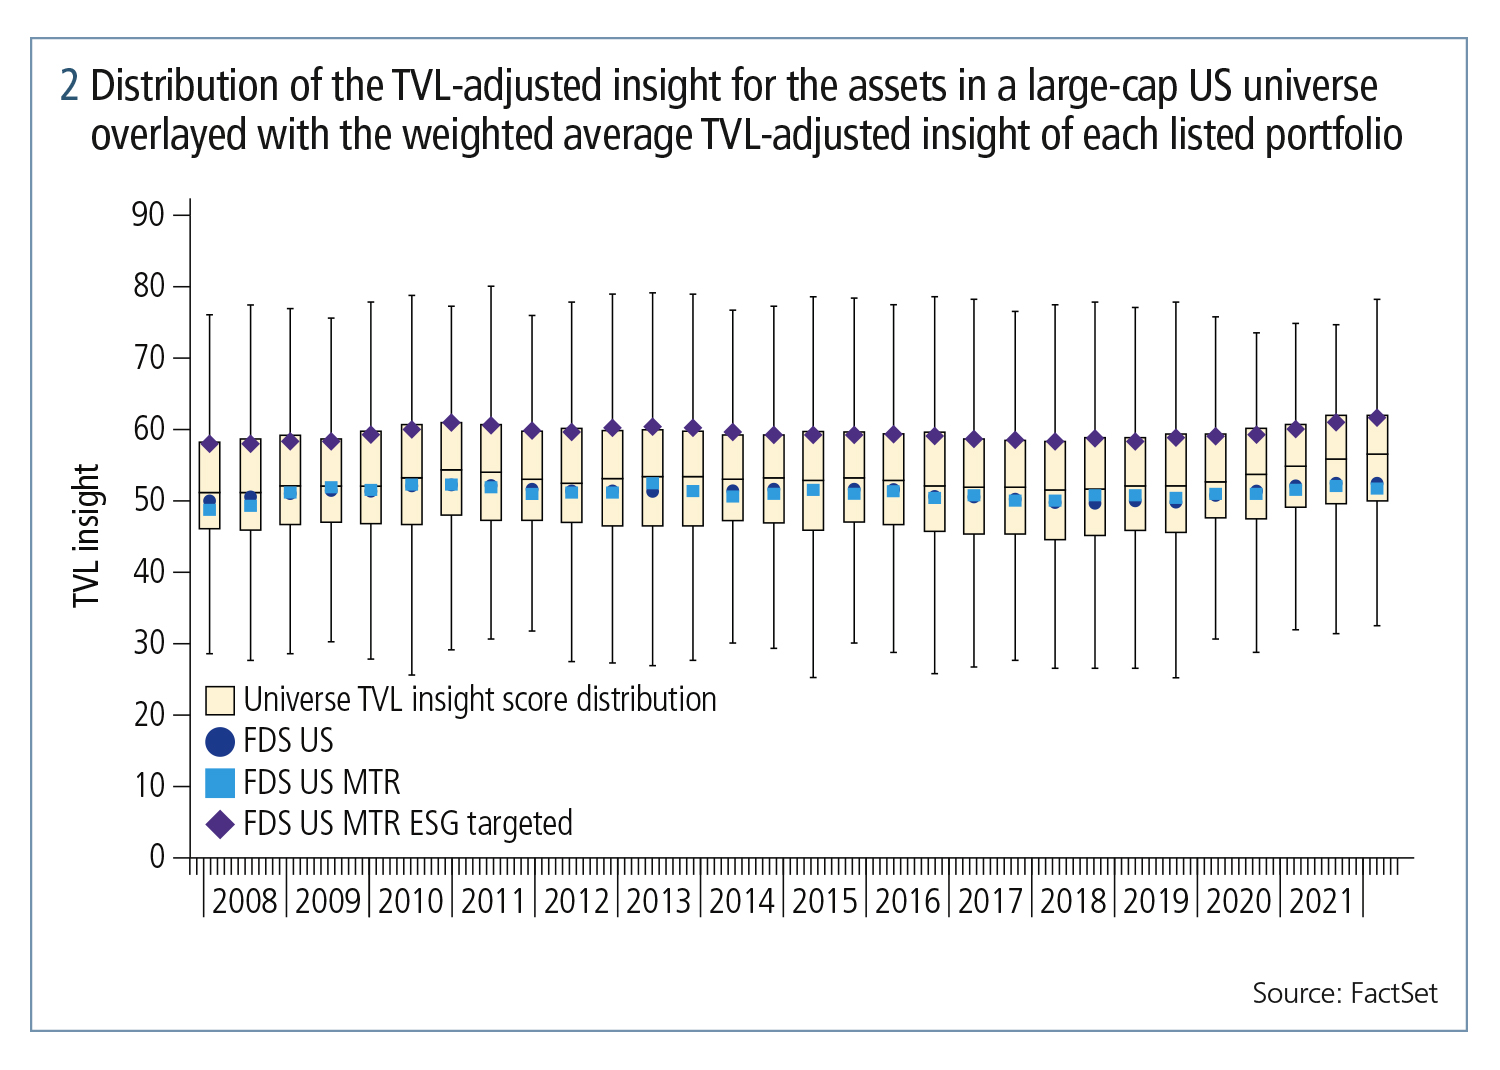
The effect of the ESG target over time is clearly visible in figure 2. The weighted TVL-adjusted insight score of the market cap portfolio (FDS US) and the MTR portfolio (FDS US MTR) vary near the median of the score distribution for each date, while the MTR portfolio with an ESG target (FDS US MTR ESG targeted) consistently has a weighted average score close to the top quartile of the distribution.
The summarising statistics for the backtest presented in the table (figure 3) evaluate the effect of the increase in ESG score on the risk-return profile of the portfolio. Since the objective of optimising both portfolios is ETL, its ex-post counterpart should be examined first – the 99% realised tail loss (in effect, the average portfolio loss during the worst 1% of days in the backtest).
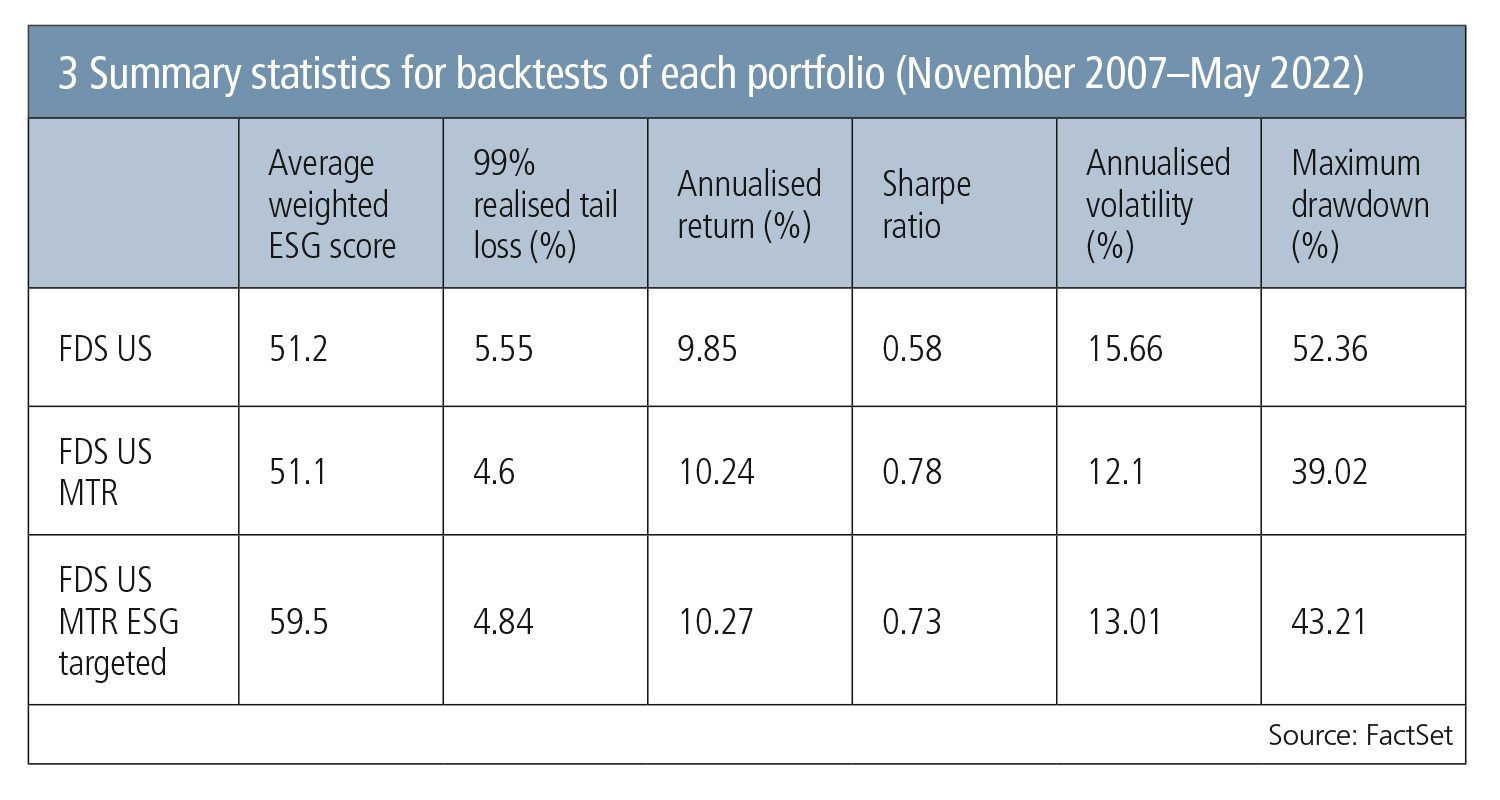
As expected, a significant improvement can be seen for the MTR portfolio compared with the market cap portfolio – a decrease from 5.55% to 4.60%. With the introduction of the ESG score constraint, the ability of the optimiser to minimise the portfolio risk is restricted, but that only results in an increase of realised tail loss of 0.24% to 4.84% – still substantially below the 5.55% of the initial market cap universe. Analogous observations can be made about the annualised volatility and the maximum drawdown – strong improvement for the MTR portfolio compared to the market cap portfolio with a modest increase when the ESG score target is added. In terms of annualised return, the two optimised portfolios outperform the market cap universe by about 40 basis points, with the ESG targeted one having a 3bp edge over the ordinary MTR portfolio. This slight outperformance doesn’t fully compensate for the higher risk, resulting in a Sharpe ratio of 0.73 for the ESG-targeted portfolio versus 0.78 for the MTR one, both significantly higher than the Sharpe ratio of 0.58 for the market cap portfolio.
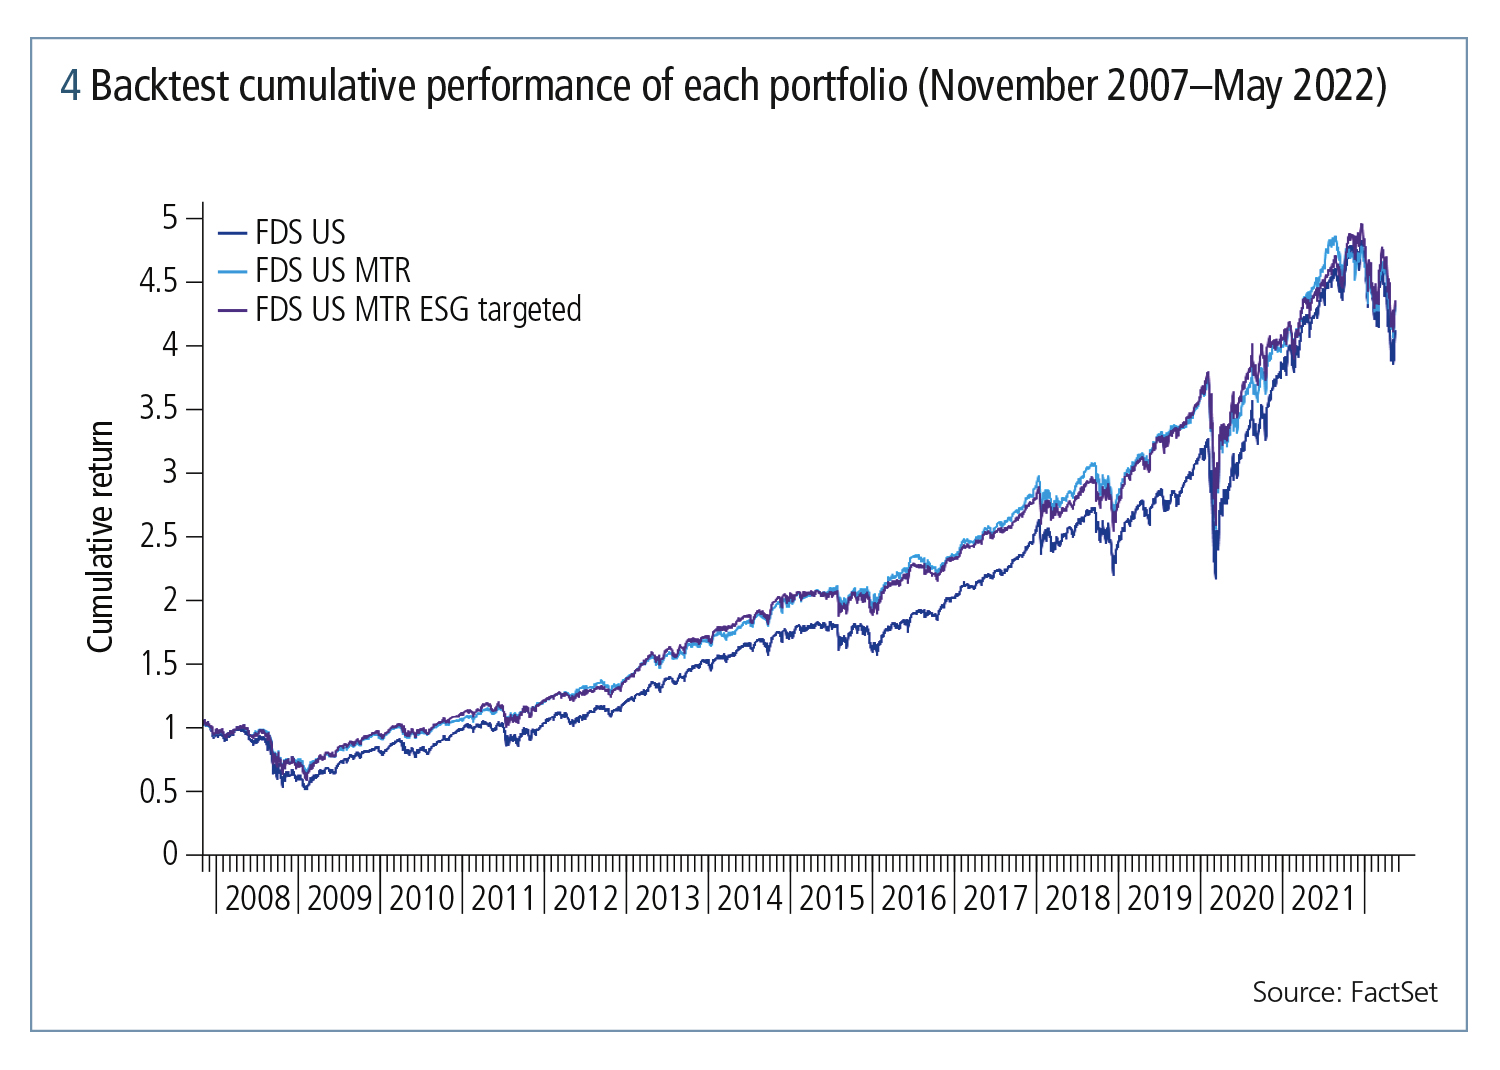
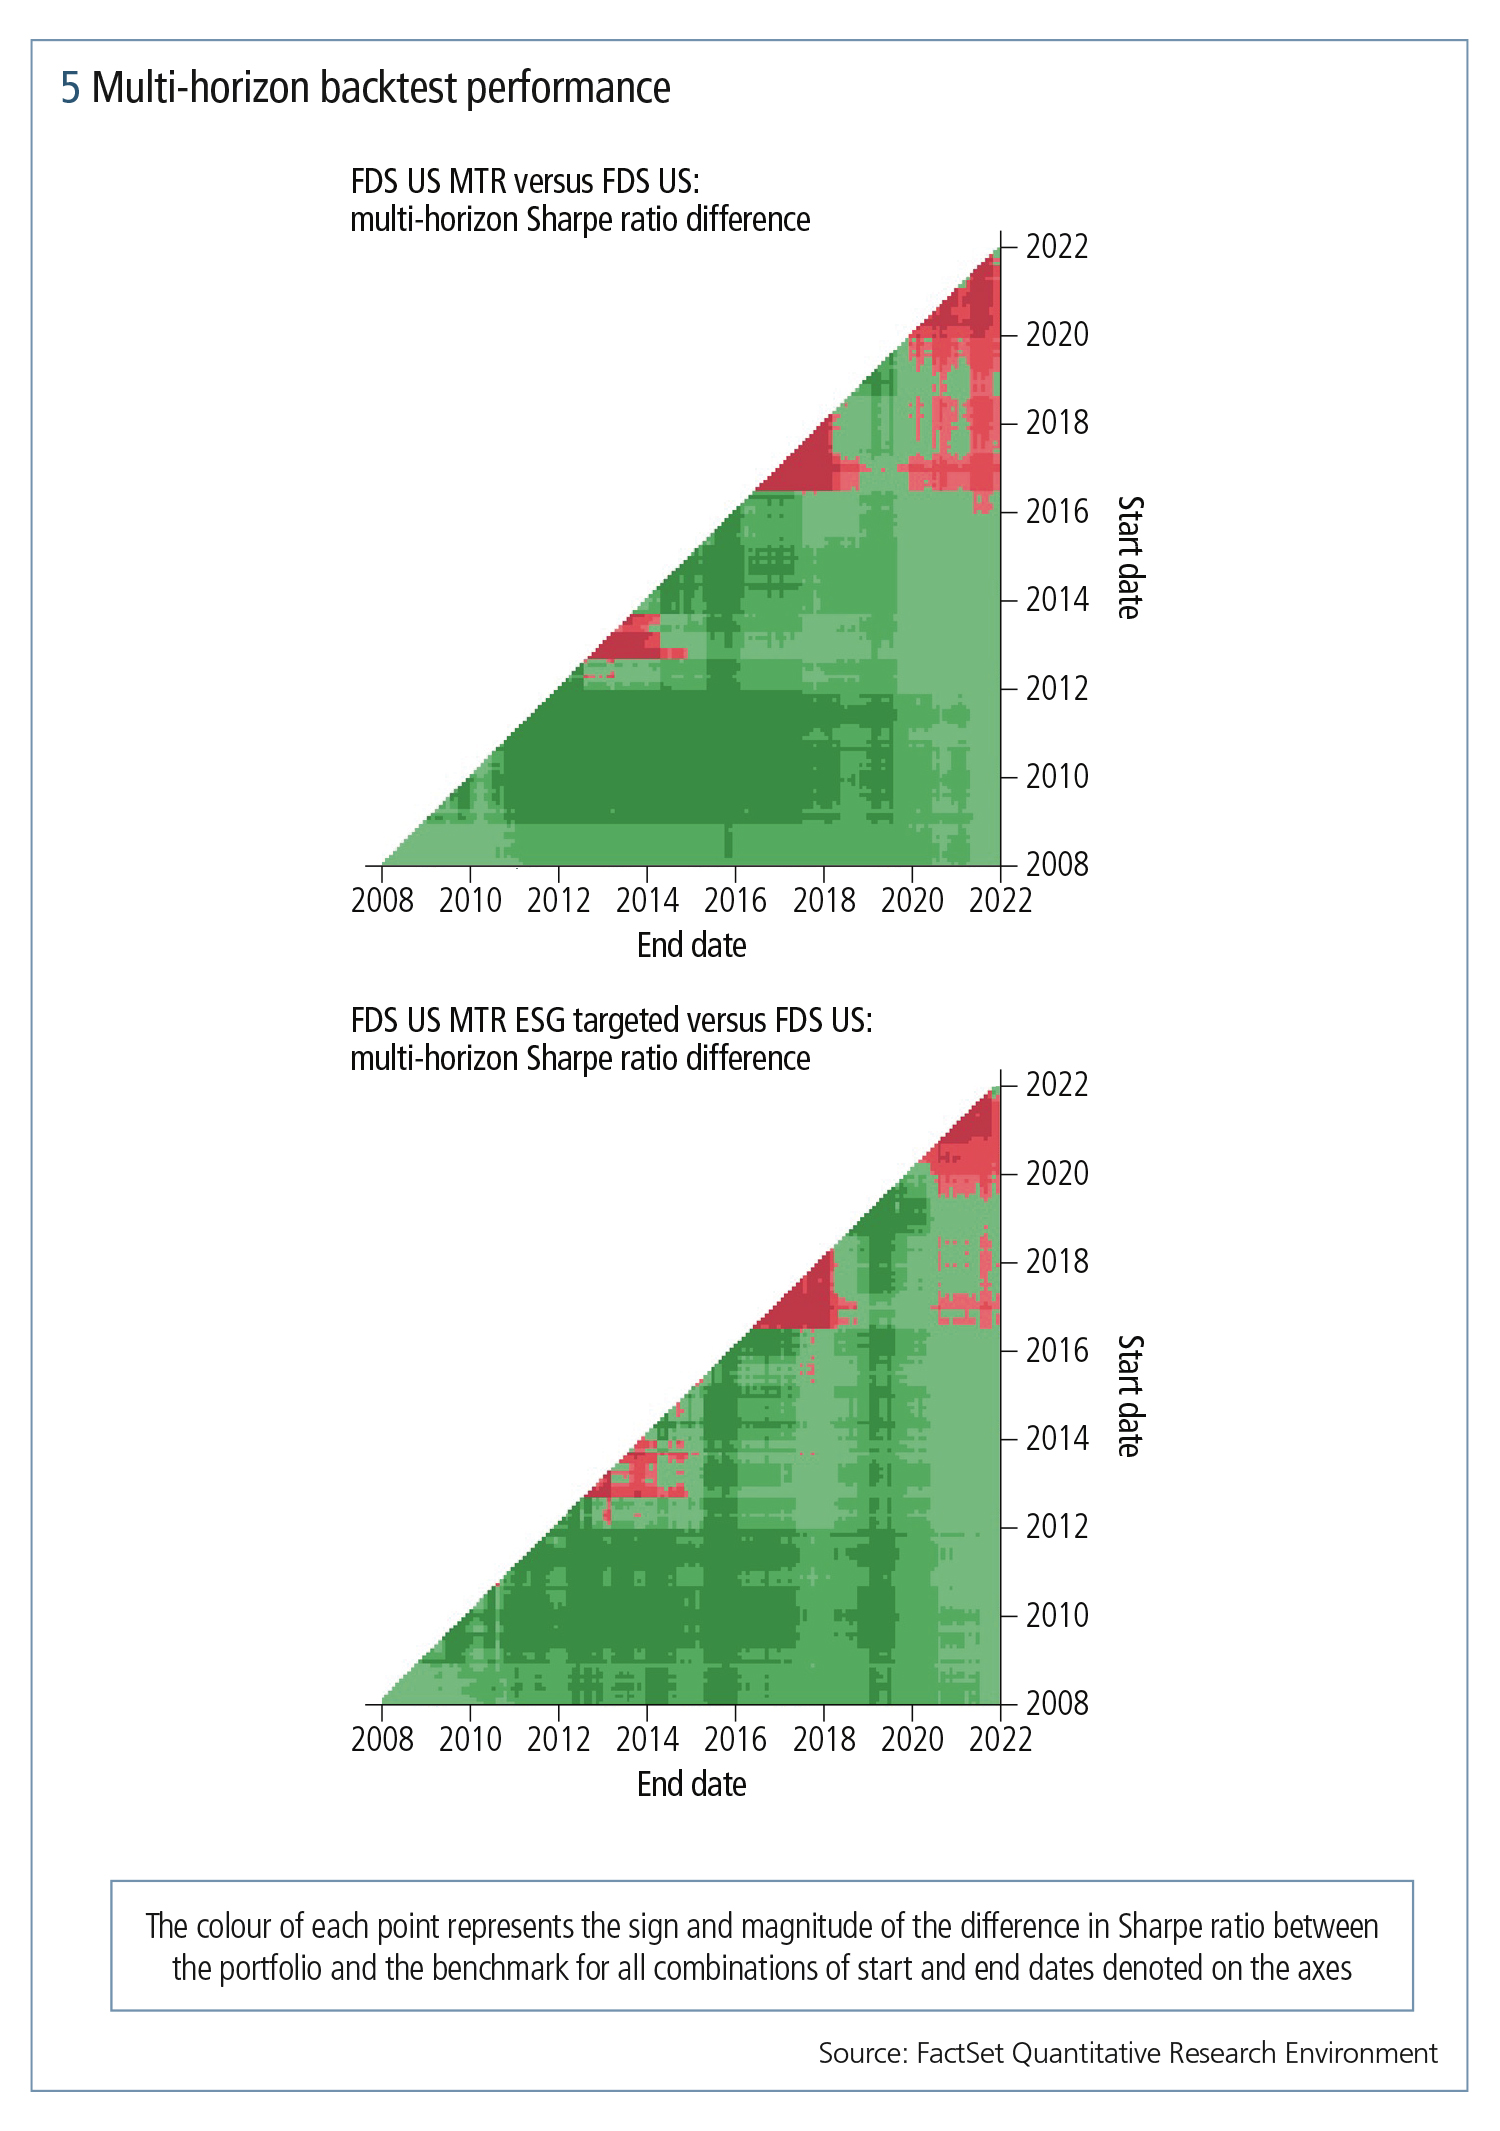
To investigate the risk-adjusted performance in more detail, figure 5 presents two plots showing the relative risk-adjusted performance of the two MTR portfolios to the market cap universe for all possible backtests with start and end dates between November 2007 and May 2022. The green points in the plots represent a higher Sharpe ratio for the optimised portfolio over a backtest with start and end dates denoted by the axes of the plot, while the red point represents a Sharpe ratio lower than that of the market cap universe. The MTR portfolios with and without ESG targets have performed similarly through most periods. Additionally, in about 90% of all possible sub-backtests, the two optimised portfolios have realised a better risk-adjusted return than the market cap universe.
Based on the observations made in this article, it can be concluded that introducing an ESG target that brings the weighted average ESG score of an MTR portfolio to the top quartile level results in a small but significant increase in portfolio risk and preserves a largely similar return profile. The described method of incorporating ESG preferences in the portfolio optimisation process allows investors to achieve an even higher ESG score or risk reduction depending on their particular investment needs.
Download the Forbes Risk Research eBook, How the Covid-19 pandemic altered the future of risk
Sponsored content
Copyright Infopro Digital Limited. All rights reserved.
As outlined in our terms and conditions, https://www.infopro-digital.com/terms-and-conditions/subscriptions/ (point 2.4), printing is limited to a single copy.
If you would like to purchase additional rights please email info@risk.net
Copyright Infopro Digital Limited. All rights reserved.
You may share this content using our article tools. As outlined in our terms and conditions, https://www.infopro-digital.com/terms-and-conditions/subscriptions/ (clause 2.4), an Authorised User may only make one copy of the materials for their own personal use. You must also comply with the restrictions in clause 2.5.
If you would like to purchase additional rights please email info@risk.net