
This article was paid for by a contributing third party.More Information.
Climate transition and bonds: risk or opportunity?

Measuring climate risk on bonds is a nascent discipline. Andy Sparks, fixed income and multi-asset product research at MSCI, looks at how to apply climate analytics to fixed income portfolios

Averting catastrophic climate change by transitioning to a low-carbon economy will cost tens of trillions of dollars. The capital markets have a vital role to play by allocating capital towards greener companies and clean technologies.
With climate investing set to soar in the coming years, many fixed income portfolio managers want to understand what the impact will be on their portfolios and what they should do to adjust and manage portfolio risk to account for climate risks and opportunities. There is a lot to learn, and most investors are only at the beginning of their journey. In a poll of delegates at Buy-side Risk Global in September, only 17% said their institution currently uses bond-level analytics in portfolio management.
Research by MSCI bears this out, suggesting climate investing has not yet had a major impact on valuations in the broader corporate bond market. However, this could change soon. When respondents were asked whether they foresee their institution using bond-level climate analytics as part of the portfolio management process in the next two to three years, 100% said yes.
This article illustrates some of the ways a bond portfolio manager could use climate analytics to gain much-needed insight into the impact of climate risk on a fixed income portfolio.
MSCI’s climate model
MSCI models three types of climate risk:
1. Physical risk – The incremental cost to a company of extreme weather events caused by carbon emissions
2. Policy or transition risk – The risk of increased costs as firms comply with more stringent carbon rules
3. Technological improvement – More an opportunity than a risk, this looks at which companies are positioned to emerge as future innovators and take advantage of growth opportunities in low-carbon technologies.
Of the vast number of inputs to MSCI’s model, the most important include carbon prices, policy-led reductions in emissions that occur over time, green revenues and patents, and geographic location. For each component of our climate model, we calculate the present value at the enterprise level. We then use the Merton model (common in credit risk management) to allocate the value to bonds and the value to equities.
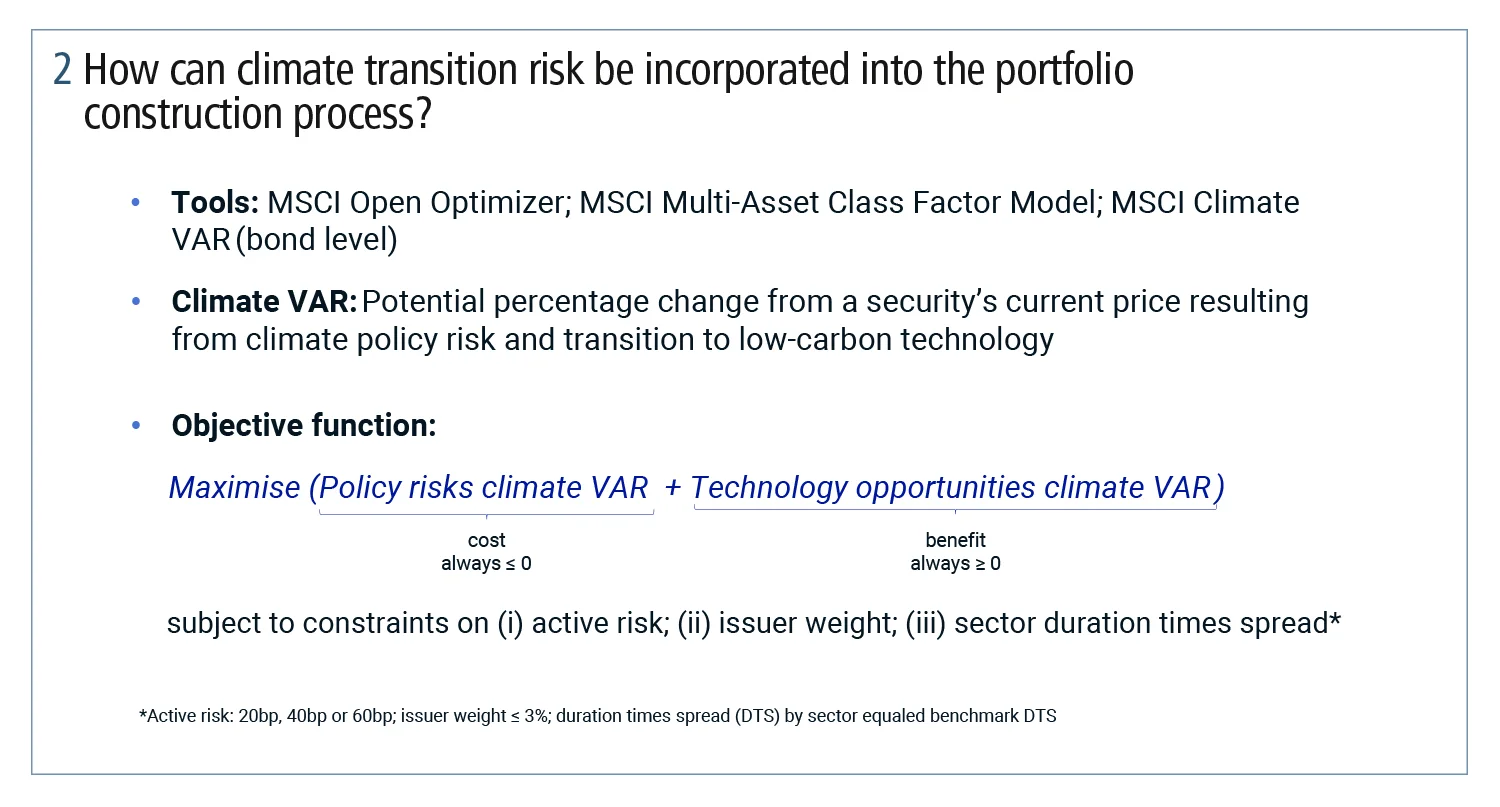
For each type of climate risk, we compute a climate value-at-risk (VAR) number. So, for a particular company, we will produce a climate VAR for climate policy risk and a different climate VAR for technological improvements. This number should be interpreted as the potential percentage change in the price of a security.
Climate VARs will also vary by climate scenario. For example, we calculate climate VAR for a policy scenario designed to limit global warming to a temperature rise of 1.5° Celsius by 2100, and we will calculate another climate VAR for a policy limiting the temperature increase to 2°C, and so on.
The following example sets physical risk aside and concentrates on the combined impact of policy risk and technological improvements. The climate scenario here is designed to limit warming to 1.5°C.
First, we wanted to examine the ways in which stocks and bonds may have different exposures to climate risk, so we created a sample of companies that have both bonds and listed equity. For each company, we compared the climate exposure of the equity with the exposure of the debt.
For the median company, we found the equity had about 15 times the exposure to climate risk as bonds. This result did not surprise us. An issuer’s equity is first exposed to downside risk, and bonds suffer cashflow losses only after the equity has been depleted. This is why we generally expect equities to carry much more climate risk than bonds.
We then compared potential changes in valuation for three different benchmarks: the MSCI USA equity index, the MSCI corporate bond index for the investment-grade sector and the same index for the high-yield sector. We found all of these indexes had significant potential downside market risk resulting from changes in climate policies. Contrary to expectations, however, we found the high-yield index had significantly greater exposure to climate risk than the equity index, while the investment-grade corporate index had less exposure than the equity index.
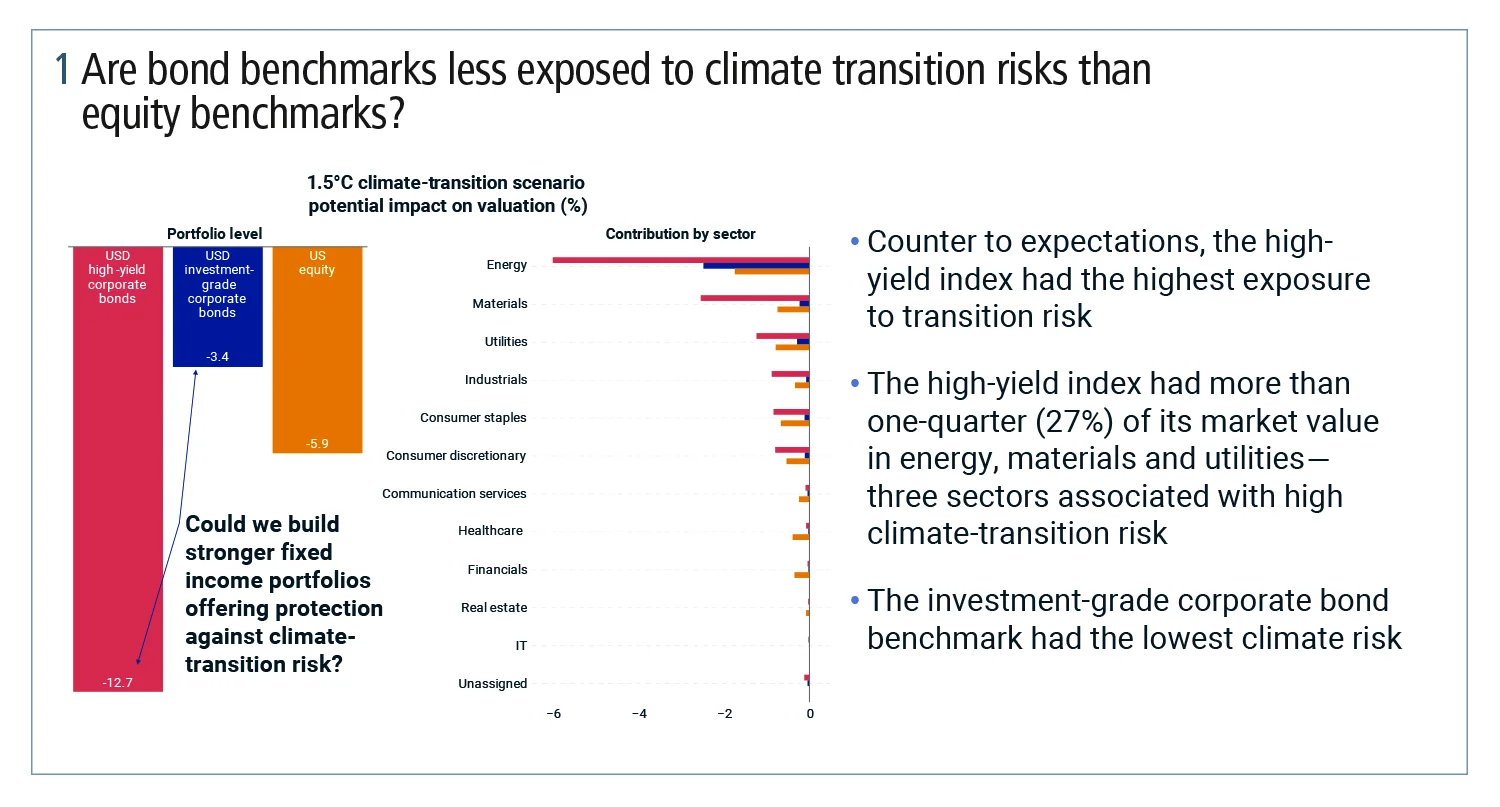
Given our previous discussion on the role of capital structure, how could high yield have such high exposure to climate risk? The answer is that the high-yield sector’s concentration in energy, materials and utilities is much higher than in the equity or investment-grade corporate indexes – and these three sectors all have relatively high exposures to climate risk.
I will now explore an investment problem facing a hypothetical portfolio manager who wants to integrate climate scenario analysis into the investment process. The manager’s goal is to create portfolios offering protection against the transition risk of a 1.5°C climate policy scenario – which is fairly aggressive – while also tilting on issuers that may benefit from advances in green technology.
We used the MSCI Multi-Asset Factor Model and MSCI climate analytics to construct hypothetical portfolios targeted at differing levels of portfolio tracking error risk relative to the market-weighted benchmark. We imposed several practical constraints, including a limit on issuer concentration and requiring that the sector duration times spread exposure in the portfolio matched that of the benchmark.
The first use case was US dollar investment-grade corporates (see figure 3). It considers potential valuation effects from four different levels of tracking error risk of the portfolio versus the benchmark. The benchmark itself is where the tracking error risk is zero so, in this example, the benchmark has a potential loss and value of -3.4% in the 1.5°C warming scenario.
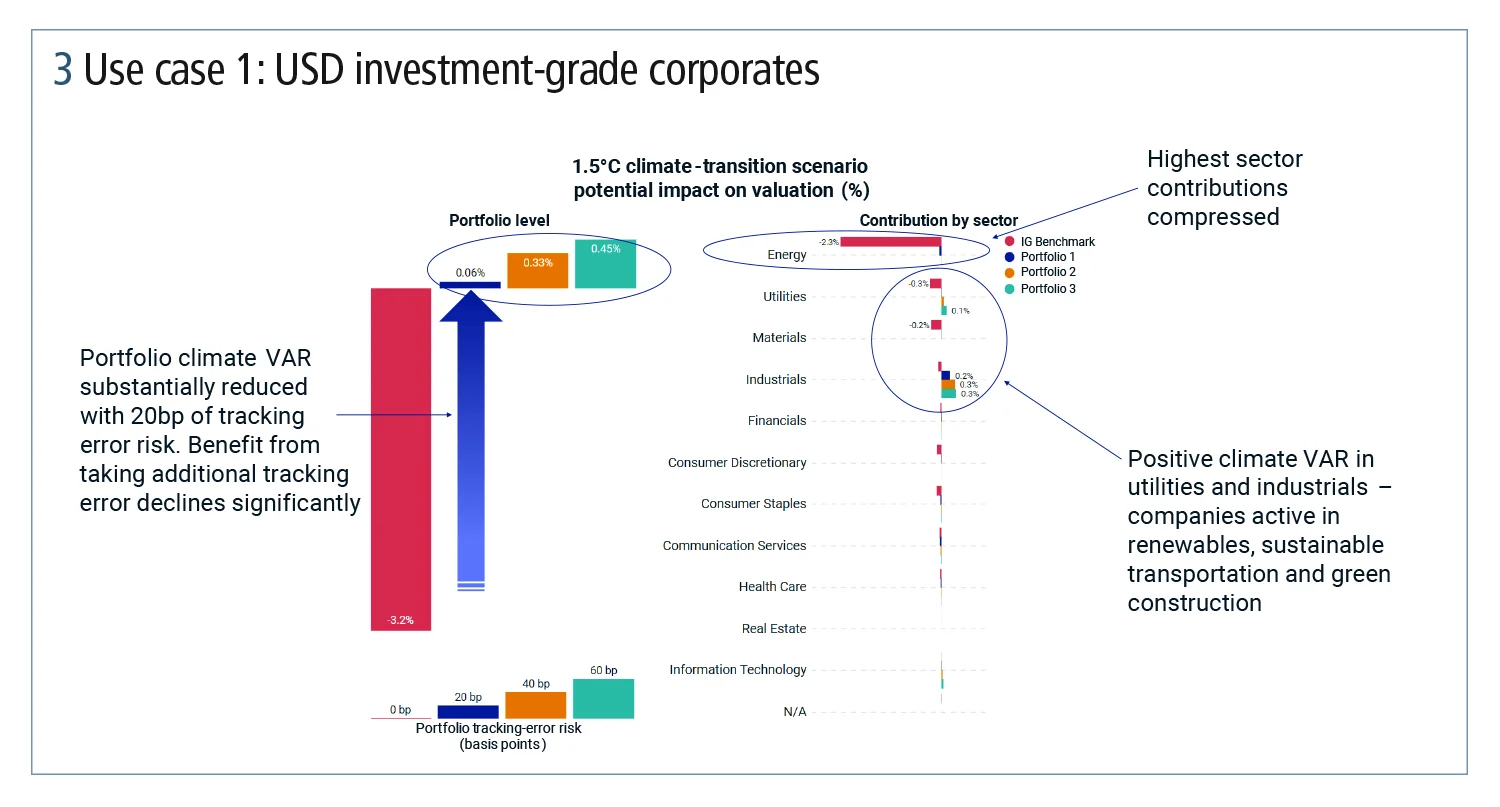
Figure 3 presents the hypothetical optimised portfolios that deviate from the benchmark’s weights. It can be seen that the 20 basis point tracking error portfolio has a very significantly improved climate profile compared with the benchmark. It is surprising that taking on a relatively small amount of tracking error risk resulted in such improvements in exposure to climate risk. The 40 and 60bp tracking error portfolios offered relatively small additional potential valuation upside, but at a ‘cost’ of greater tracking error risk versus the benchmark.
Additionally, the portfolios actually benefit from our climate scenario. This is because they are tilted on issuer names that will benefit from technological opportunities. This is a very important result, demonstrating that climate change poses not just financial market risk, but opportunity.
The optimised portfolios have considerably different sector risk contributions when compared with the benchmark. In particular, the portfolios all have substantially reduced risk contributions from the energy, materials and utilities sectors, and the portfolios are generating positive climate valuation effects from exposure to companies in utilities and industrials. Within these sectors, the portfolios are tilted on companies active in renewables, sustainable transportation and green construction.
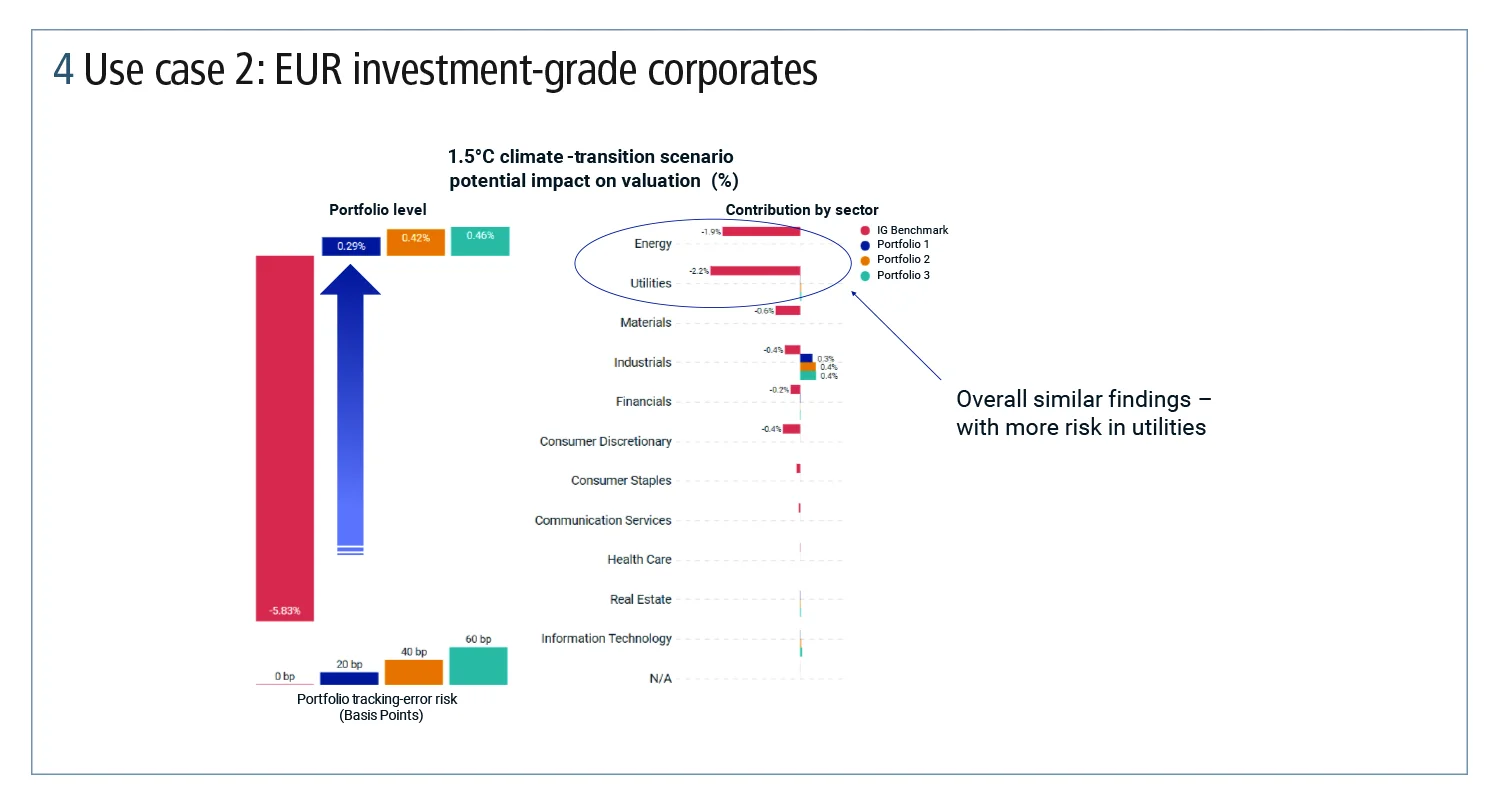
The second use case looks at euro-denominated investment-grade corporates (see figure 4). The findings are generally the same. One difference is that the euro benchmark has a more negative valuation effect than the US dollar benchmark. This could be explained by the differences in sector contribution. The euro benchmark has a larger contribution from the utilities sector than the US dollar benchmark.
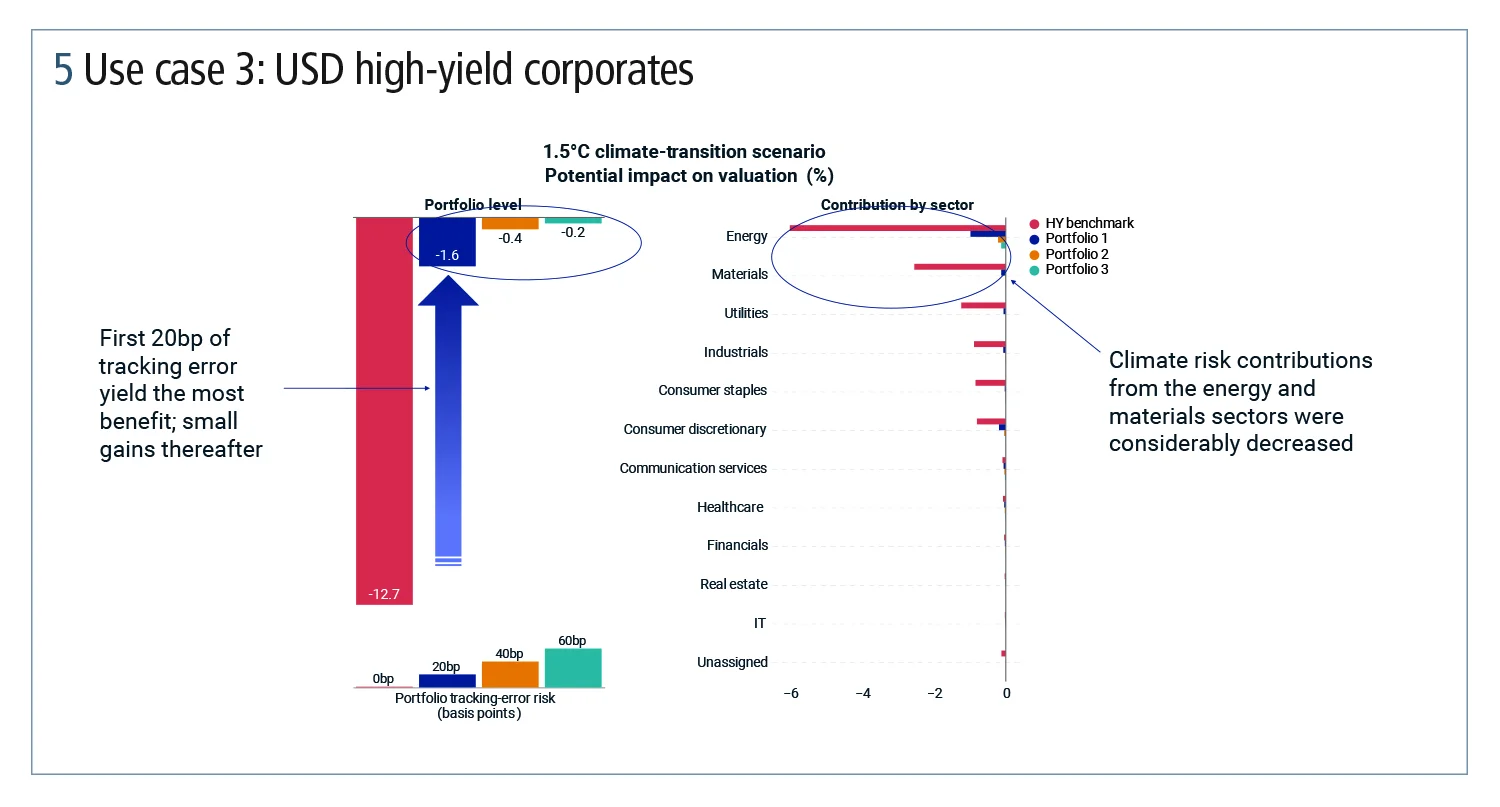
The third case takes US dollar high-yield corporates, a sector with very high exposure to aggressive policies designed to limit warming to 1.5°C (see figure 5). The findings are similar to those in the investment-grade portfolio. Introducing the first 20 basis points of tracking error risk results in a very significant reduction in exposure to climate risk, but higher tracking errors result in relatively modest improvements in climate exposure. This, again, was largely the result of diminished exposure to the energy, materials and utilities sectors.
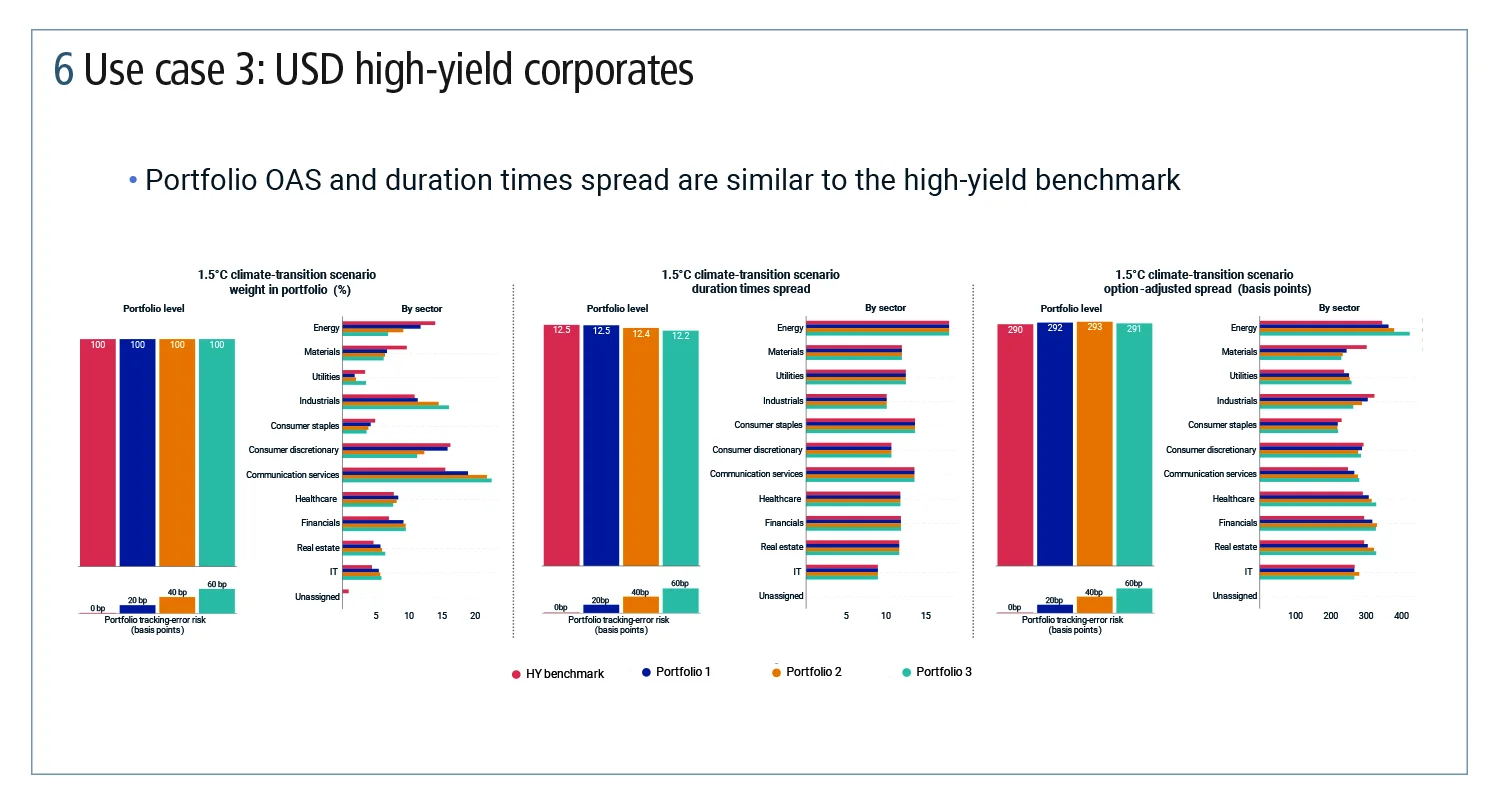
But there was one notable difference on the high-yield portfolio. The use cases looked at market value weights, duration times spread and option-adjusted spreads (OAS) for the benchmark versus the optimised portfolios. One of the most surprising results is that the OAS on the optimised portfolios are almost the same as on the high-yield benchmark.
In the portfolio with 20bp of tracking error, for example, the OAS was 292bp, while the benchmark has an OAS of 290bp. In other words, it was possible to create a high-yield corporate bond portfolio with a substantial reduction in climate risk without sacrificing spread, and while maintaining a similar overall risk profile to the benchmark.
This finding is consistent with our earlier research that suggests climate investing may not yet have had a major impact on valuations in the broader corporate bond market. Given the likelihood of new government climate policies, now may be a good time for investors to re-evaluate their bond portfolios. Furthermore, our results show it might be possible to build greener corporate bond portfolios without deviating too far from the benchmark’s risk characteristics.
This could be viewed as an opportunity – add climate protection to your portfolio now, before it becomes expensive later. Alternatively, maybe the market believes that very aggressive policy action is unlikely to occur any time soon. If financial market performance is the sole goal, would it be better to wait and see rather than rushing to buy climate protection now?
The risk to that option is that global warming may accelerate, and policy-makers, albeit with a delay, may then have to dramatically increase regulation. This could impose even greater cost on the economy and companies compared with a scenario in which aggressive policies were adopted earlier. Going forward, relative value questions such as this will increasingly be important considerations to bond market investors.
This article is adapted from a presentation by Andy Sparks, given at Buy-side Risk Global in September 2021. Register to watch the presentation.
Sponsored content
Copyright Infopro Digital Limited. All rights reserved.
As outlined in our terms and conditions, https://www.infopro-digital.com/terms-and-conditions/subscriptions/ (point 2.4), printing is limited to a single copy.
If you would like to purchase additional rights please email info@risk.net
Copyright Infopro Digital Limited. All rights reserved.
You may share this content using our article tools. As outlined in our terms and conditions, https://www.infopro-digital.com/terms-and-conditions/subscriptions/ (clause 2.4), an Authorised User may only make one copy of the materials for their own personal use. You must also comply with the restrictions in clause 2.5.
If you would like to purchase additional rights please email info@risk.net