
This article was paid for by a contributing third party.More Information.
Applying scenario analysis to climate risk

Matthew Lightwood, director, risk solutions at Conning, discusses the application of stochastic modelling with scenario analysis to quantify climate risk in a portfolio

Assessing the level of climate risk in a portfolio is now a top priority at a wide variety of businesses – from asset managers and banks to insurers, energy firms and the industrial sector. The question is clear: what impact does climate change and possible governmental policy action have on a firm’s asset risk? Arriving at the answer, however, is a challenge with which risk management is still grappling.
Climate risk is unlike many other types of financial risk. There is little to no useful historical data, and many future developments in the world’s response to climate change are both unknown and unknowable. Additionally, climate impacts on financial markets are likely to manifest as subtle changes over long periods of time. This point is not lost on regulators, and the idea of a term structure of risks is already a feature of the next generation of climate stress tests.
In cases where it is difficult to assign a probability to outcomes, scenario analysis is the tool of choice and has been adopted by many organisations for analysing climate risk. However, having a scenario to consider and actually assessing its impact on a portfolio are two different things. This feature considers the use of a stochastic model overlaid with a scenario analysis algorithm to quantify the possible risk impacts of one climate risk scenario.
Applying stochastic modelling
This study uses an economic scenario generator to model two portfolios. Portfolio 1 consists of 70% global fixed income investments and 30% risk assets. Portfolio 2 is split 50/50 between fixed income and risk assets. A stochastic projection of the risk distribution is produced and analysed using the power of the cloud. A climate scenario, representing an orderly transition to a low-carbon economy over a 30-year future time horizon, is overlaid using an algorithm that allows the impact to be considered through time as well as on the whole risk distribution. Also considered is the impact from both transition risk and physical risk.
This scenario is a global scenario taken from the definition given by the UK Prudential Regulatory Authority in its 2019 exploratory exercise and represents the impact that might be expected if governments took policy actions that broadly align with the Paris Agreement on climate change at the end of the 30-year period. This involves a maximum temperature increase of below 2 degrees Celsius relative to pre-industrial levels and full greenhouse-gas neutrality beyond the 30-year horizon of the scenario. The assumptions of this scenario are based on the scenarios described in the Intergovernmental Panel on Climate Change’s (IPCC’s) special report, Global warming of 1.5°C.
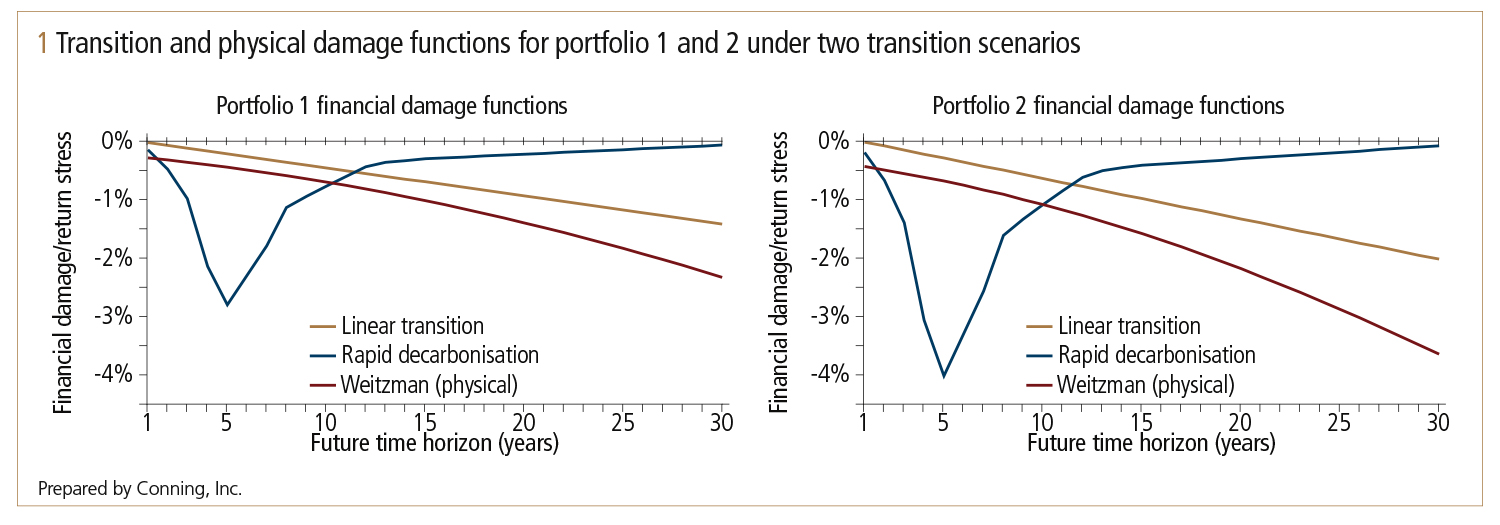
Figure 1 considers two possible through-time paths with regard to the magnitude and timing of the future transition risk impacts or financial damage of the scenario. These are a linearly increasing damage scenario and a rapid decarbonisation scenario. In the latter scenario, the impact increases rapidly in the next 10 years, which can be seen as the peak stress of the blue line in figure 1, before falling back as markets reorder to absorb the structural changes that have taken place. For physical risk, a Weitzman-like damage function is assumed, one of the commonly used functions from the climate literature.
These scenarios are then applied to the output of the GEMS Economic Scenario Generator using an algorithm developed by Conning and a cloud-based scenario analysis tool, the Conning Climate Risk Analyzer. Figure 2 shows the effect through time of the scenarios on the mean market value of each portfolio and the 1% annual value-at-risk (VAR). The effect is expressed in terms of excess climate risk (ECR) defined as the change in the statistic relative to the current best estimate of risk and reward. A value of -1% in the mean, for instance, can be interpreted as saying that, conditional on this scenario playing out, it would be expected that the portfolio market value is 1% lower than our current best estimate. Figure 2 also illustrates the attribution of the ECR to transition risk (middle row) and physical risk (bottom row).
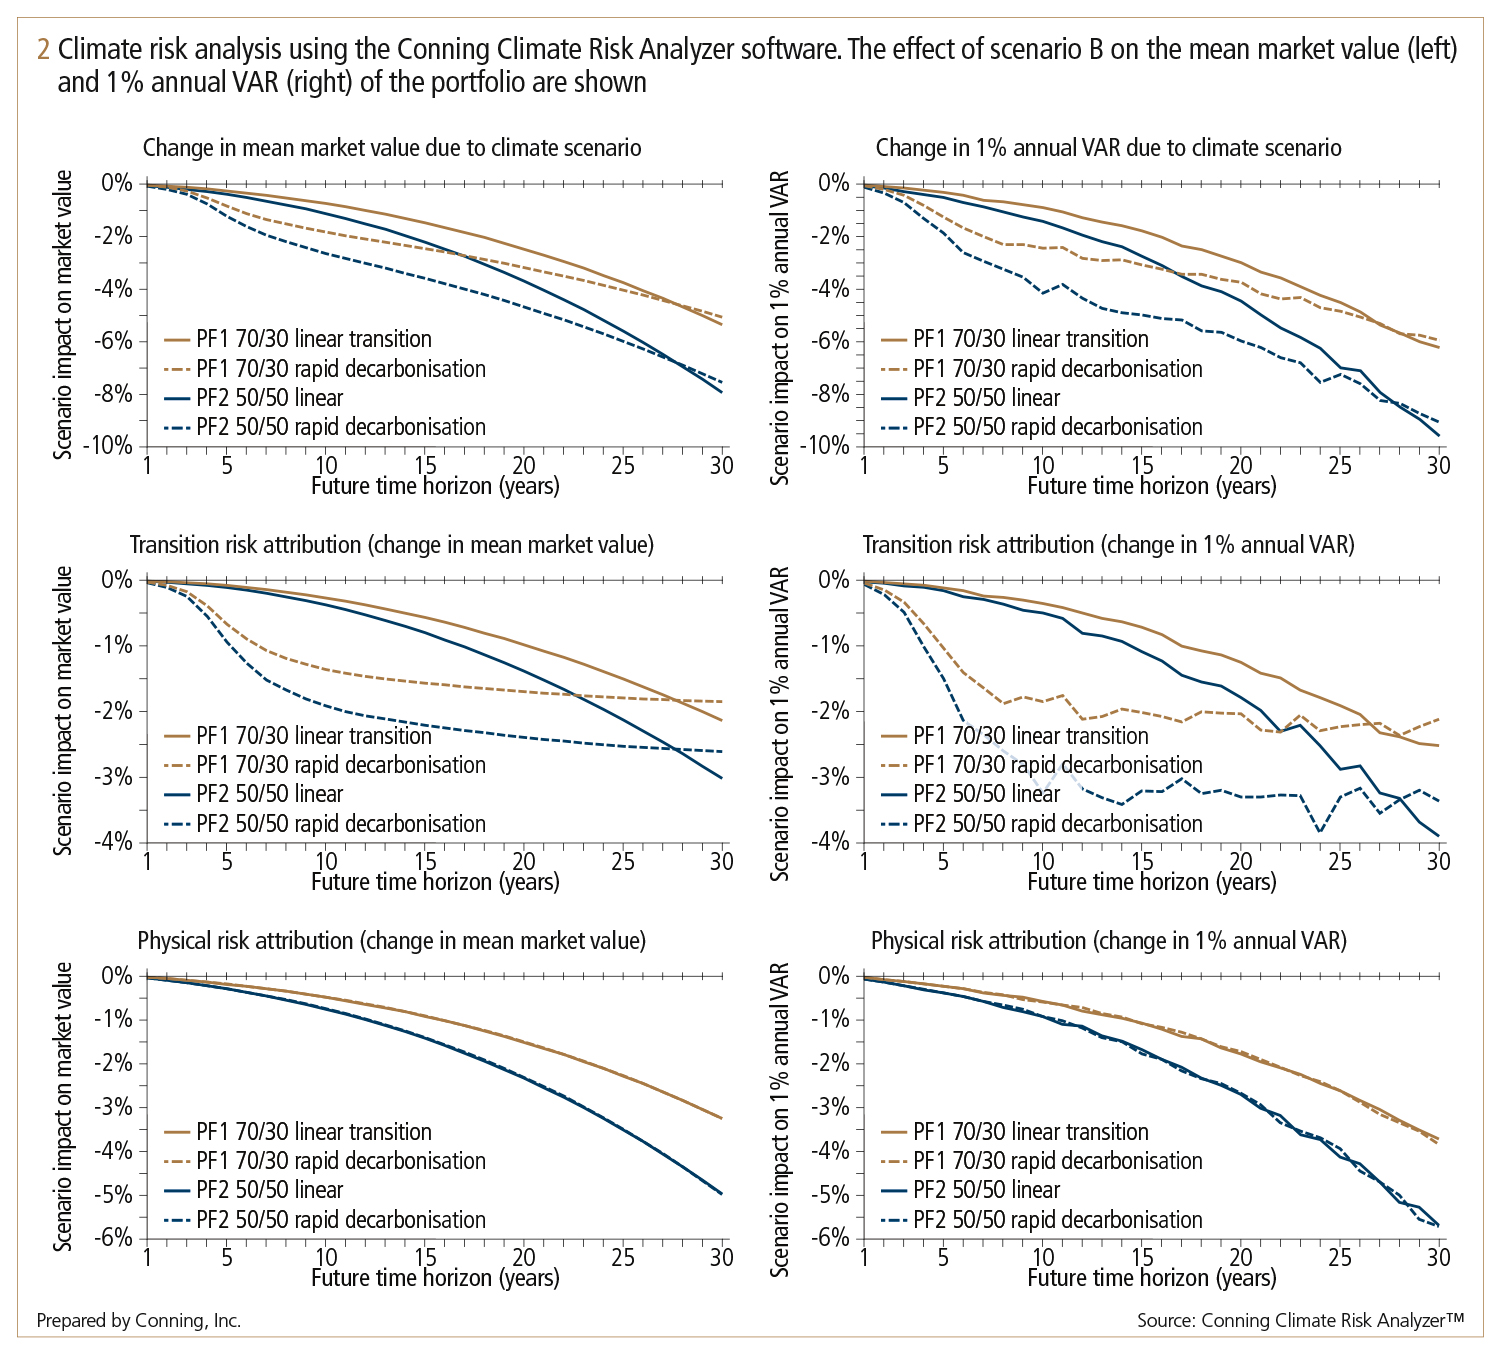
For both portfolios it is observed that the rapid decarbonisation scenario leads to larger impacts on risk and return at the shorter and medium time horizons. Over the full 30-year horizon it can be seen that the portfolios are relatively insensitive to the path the climate scenario takes through time. It is also observed that the scenario has a larger impact on risk than on mean return. For portfolio 1, the mean return is 5% lower under the rapid decarbonisation scenario than the current best estimate, while the 1% VAR has increased by nearly 6%. For portfolio 2, the differences are greater, with the mean return decreasing by approximately 7.5% while the 1% VAR increased by 9%. Considering the five-year horizon that might be used for Own Risk and Solvency Assessment reporting or analysis to form part of the Task Force on Climate-related Financial Disclosures or Principles for Responsible Investment disclosures, increases in risk of only 1.3% for portfolio 1 and 1.9% for portfolio 2 are observed under the rapid decarbonisation scenario.
Climate risk – Special report 2021
Read more
This feature contains forward-looking statements. Readers should not place undue reliance on forward-looking statements. Actual results could differ materially from those referenced in forward-looking statements for many reasons. Forward-looking statements are necessarily speculative in nature, and it can be expected some or all of the assumptions underlying any forward-looking statements will not materialise or will vary significantly from actual results. Variations of assumptions and results may be material. Without limiting the generality of the foregoing, the inclusion of forward-looking statements herein should not be regarded as a representation by the investment manager or any of their respective affiliates or any other person of the results that will actually be achieved as presented. None of the foregoing persons has any obligation to update or otherwise revise any forward-looking statements, including any revision to reflect changes in any circumstances arising after the date hereof relating to any assumptions or otherwise.
Sponsored content
Copyright Infopro Digital Limited. All rights reserved.
As outlined in our terms and conditions, https://www.infopro-digital.com/terms-and-conditions/subscriptions/ (point 2.4), printing is limited to a single copy.
If you would like to purchase additional rights please email info@risk.net
Copyright Infopro Digital Limited. All rights reserved.
You may share this content using our article tools. As outlined in our terms and conditions, https://www.infopro-digital.com/terms-and-conditions/subscriptions/ (clause 2.4), an Authorised User may only make one copy of the materials for their own personal use. You must also comply with the restrictions in clause 2.5.
If you would like to purchase additional rights please email info@risk.net