
Swaps data: CCP and Sef volumes still growing
First three quarters show strong growth in interest rate swaps, forex NDFs and index CDSs

With three quarters’ worth of swaps data now in, it’s a good chance to take stock of overall volumes and the competitive picture across a range of products and currencies. In short, the story is that volumes are growing, but not for all central counterparties (CCPs) and swap execution facilities (Sefs) – some are growing faster than others; some are down year-on-year.
Global cleared interest rate swaps
First let’s look at quarterly gross notional of interest rate swaps in major currencies – Australian dollar, Canadian dollar, euro, sterling, US dollar, yen – as reported by clearing houses.
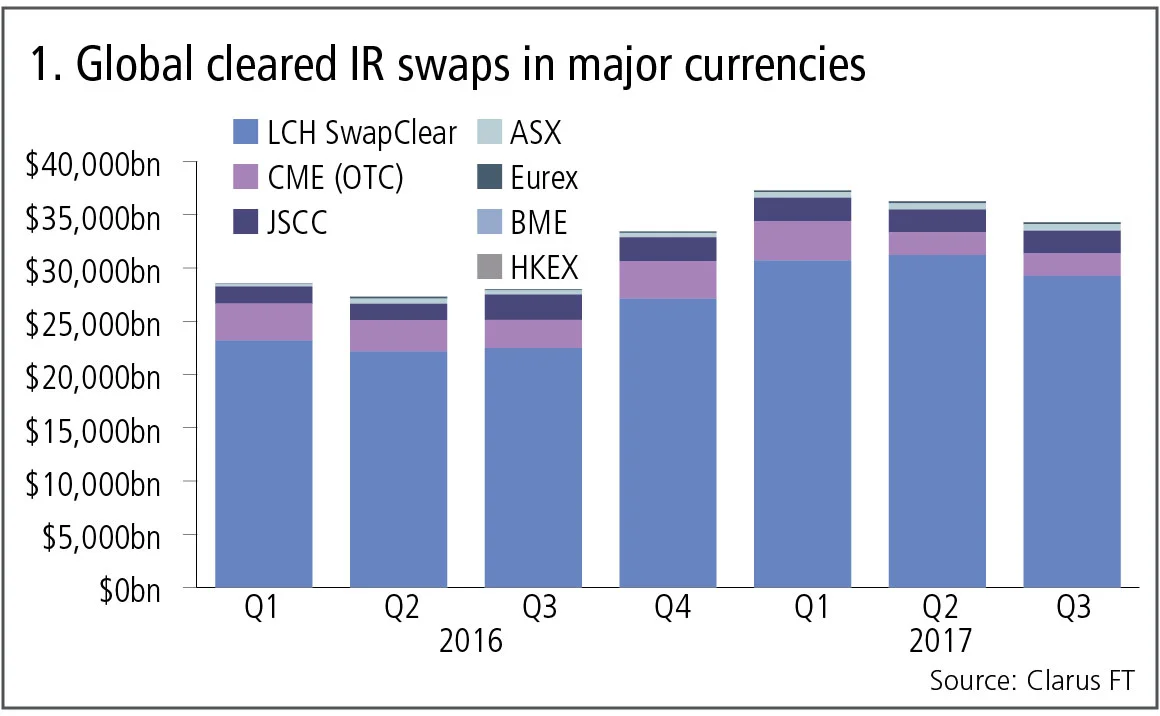
Figure 1 shows:
- Strong growth in 2017 over 2016, with each quarter higher than the corresponding quarter a year earlier.
- LCH SwapClear the largest with $29 trillion in the third quarter of 2017, up 30% year-on-year, and a year-to-date market share of 85% by gross notional.
- CME with $2 trillion in the third quarter of 2017, down 19% from the same period last year, and a year-to-date market share of 7%.
- The Japan Securities Clearing Corporation (JSCC) with $2 trillion in the third quarter, down 12% (in US dollar terms) from the third quarter in 2016 and a year-to-date market share of 6%.
- ASX with $620 billion in the third quarter, up 57% year-on-year (in US dollar terms) and a year-to-date market share of 2%.
- Eurex with $170 billion in the third quarter, up 107% (in dollar terms) from the same period a year earlier.
- Spain’s Bolsas y Mercados Espanoles (BME) with $700 million so far this year.
So the cleared interest rate swap market continues to grow, with a strong growth rate of 30% at the market leader LCH SwapClear, as well as exceptional growth from a lower base at ASX and Eurex, while both CME and JSCC are down in the most recent quarter from a year earlier.
US swap execution facilities
Next, volumes reported by US Sefs for interest rate swaps in the same six currencies.
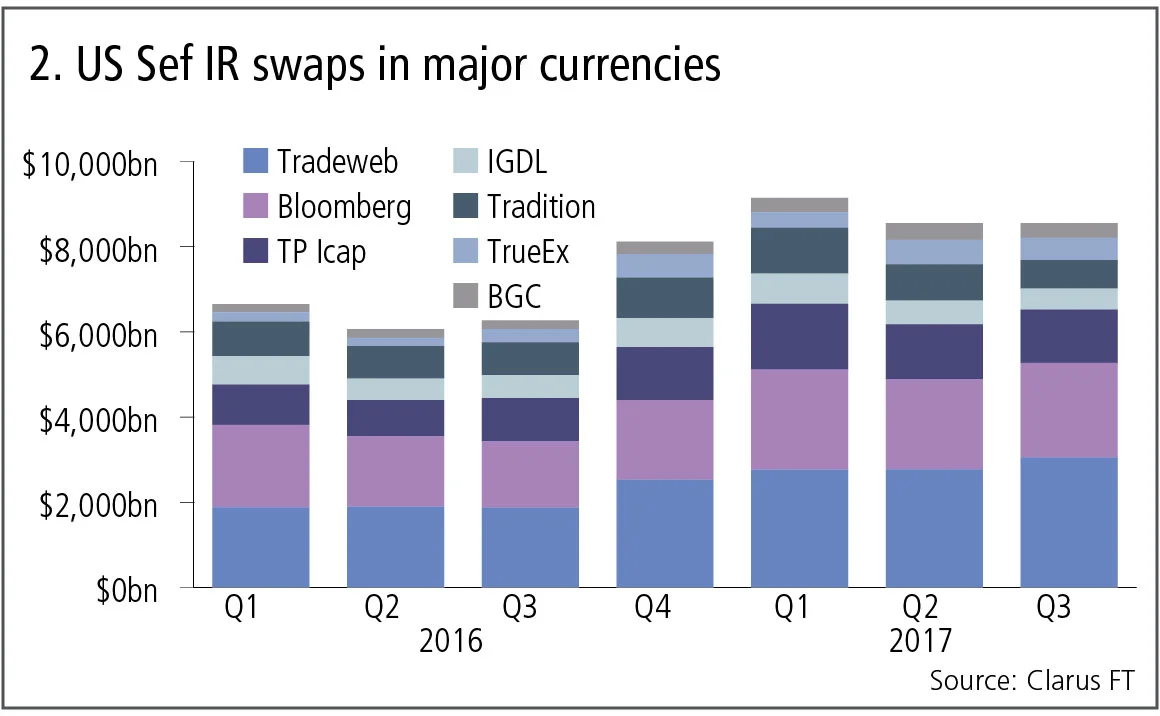
Figure 2 shows:
- Strong growth in 2017 over 2016, with each quarter higher than the corresponding quarter a year earlier.
- Tradeweb the largest with $3 trillion in the third quarter of 2017, up 63% from the same period last year, and a year-to-date market share of 33% by gross notional.
- Bloomberg with $2.2 trillion in the third quarter, up 42% from the third quarter in 2016 and a year-to-date market share of 25%.
- TP Icap is the largest interdealer player with $1.25 trillion in the third quarter, up 24% year-on-year, and a year-to-date share of 16%.
- IGDL, which is owned by TP Icap but managed separately, has $500 billion in the third quarter, down 9% from the same period last year, and a 7% year-to-date market share.
- Tradition with $670 billion in the third quarter, down 13% year-on-year, and a 10% year-to-date market share.
- TrueEx with $520 billion in the third quarter, up 67% from last year and a 6% year-to-date market share.
- BGC with $345 billion in the third quarter, up 73% year-on-year and a 4% year-to-date market share.
In summary, excellent growth at the three dealer-to-client Sefs: Bloomberg, Tradeweb and TrueEx, in part driven by portfolio maintenance compression and roll activity, with Tradeweb now established as the largest. For dealer-to-dealer Sefs, TP Icap is the leader with gains in the third quarter, while IGDL and Tradition are down during the period, possibly due to lower CME-LCH central counterparty switch volumes.
Interestingly, the cumulative volume reported by US Sefs in 2017 is $26 trillion and represents 24% of global cleared volume of $108 trillion.
Global cleared forex non-deliverable forwards
Cleared volumes for forex NDFs have benefited from the implementation of new margin rules for the non-cleared product, with volumes hitting new records.
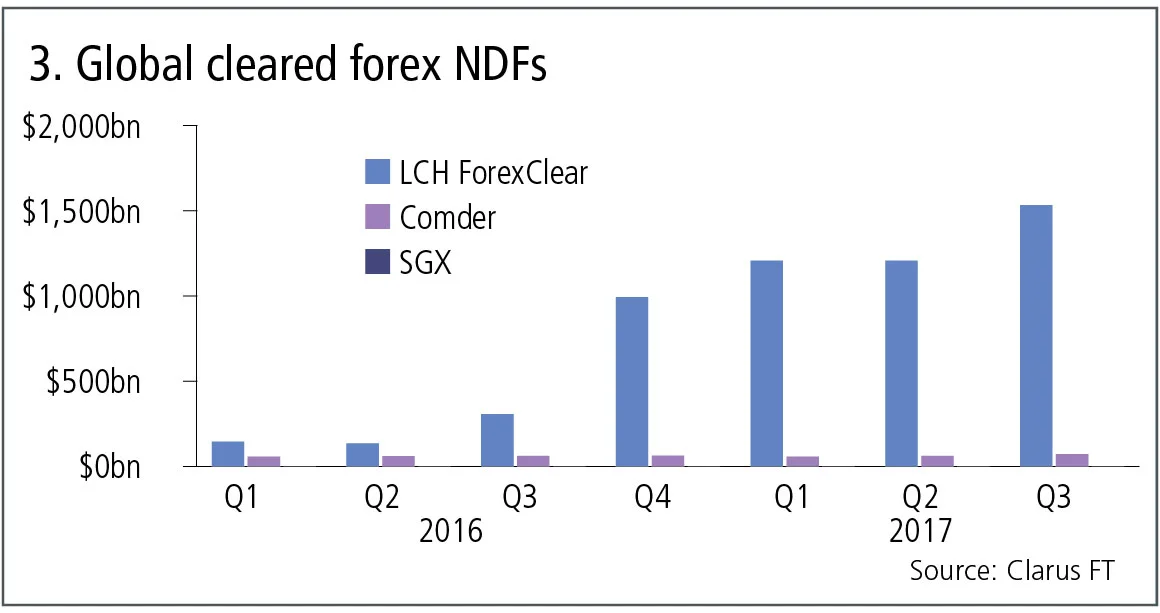
Figure 3 shows:
- LCH ForexClear with $1.5 trillion in the third quarter of 2017, up 400% from the same period last year, for a year-to-date market share of 95%.
- Comder with $73 billion in the third quarter, up 16% year-on-year, for a 5% share.
NDF volumes at US Sefs
US Sef volumes, however, do not show the same trend.
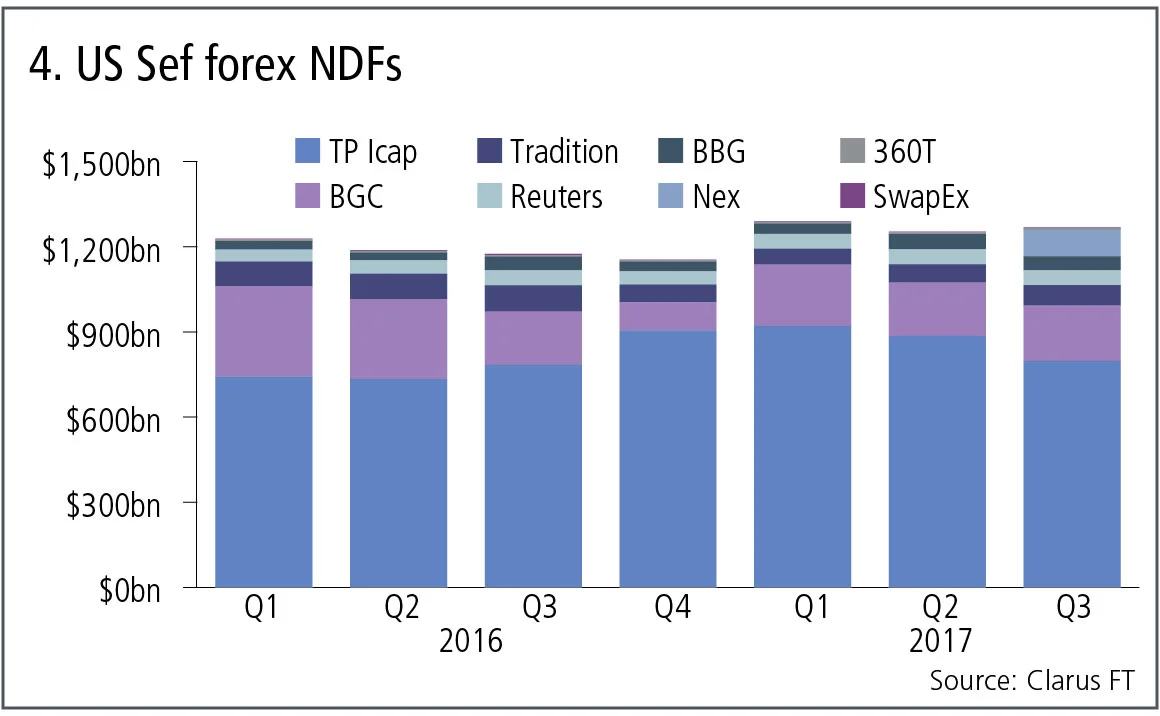
Figure 4 shows:
- Increases in 2017 but nothing like that seen for cleared volumes, which is due to the fact that clearing for NDFs happens post-trade and not at the point of execution, so the volumes here represent overall market activity, of which an increasing volume is now being cleared.
- The combination of TP Icap is the largest, with $800 billion in the third quarter this year.
- BGC is next with $194 billion in the third quarter.
- Nex started reporting in the most recent quarter.
The cumulative volume reported by US Sefs in 2017 is $3.8 trillion and equivalent to 92% of the global cleared volume of $4.1 trillion, which given there is significant NDF trading in Europe and Asia, suggests there is some way to go before cleared NDF volume growth slows down.
Global cleared CDS index
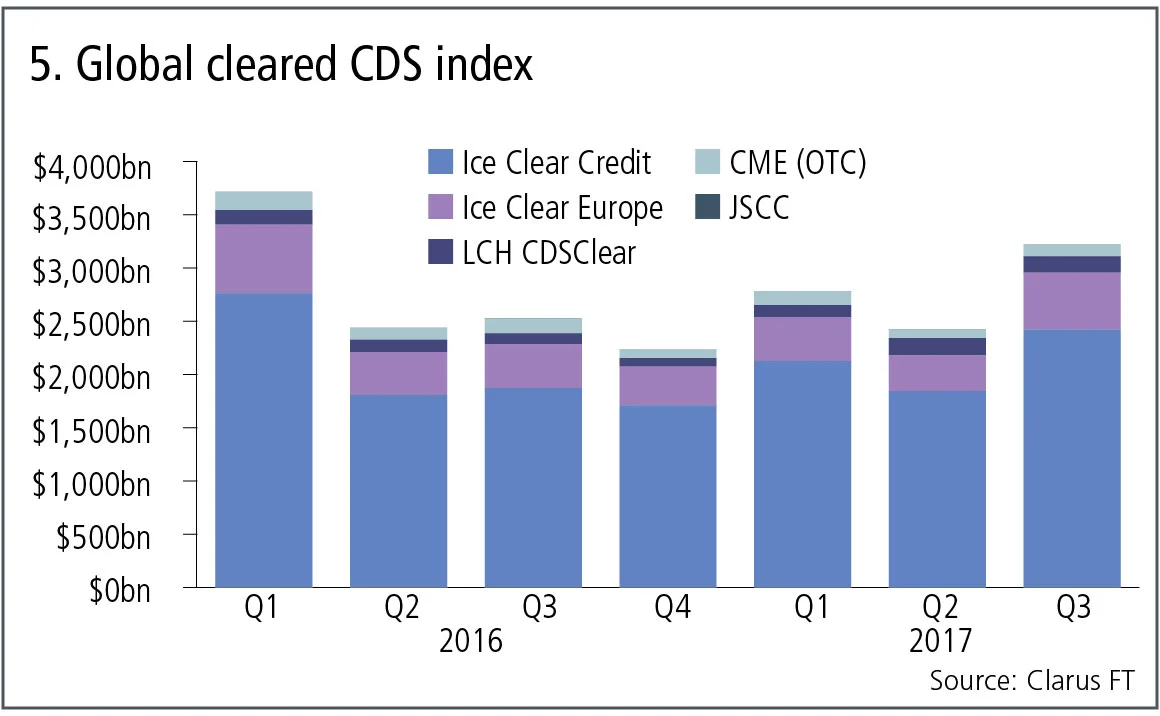
Figure 5 shows:
- Volumes for the third quarter of 2017 are up versus the same period in 2016, but previous quarters in 2017 were down.
- Ice Clear Credit is the largest clearer with $2.4 trillion in the third quarter, up 29% year-on-year for a year-to-date market share of 76%.
- Ice Clear Europe has $536 billion in the third quarter and is up 30% year-on-year.
- LCH CDSClear has $152 billion in the third quarter and is up 50% in dollar terms from the same period last year.
- CME has announced the closure of its CDS service and JSCC does not register on the chart.
In summary, strong growth from the market leader Ice, and strong growth from a lower base for LCH CDSClear.
CDS index volumes at US Sefs
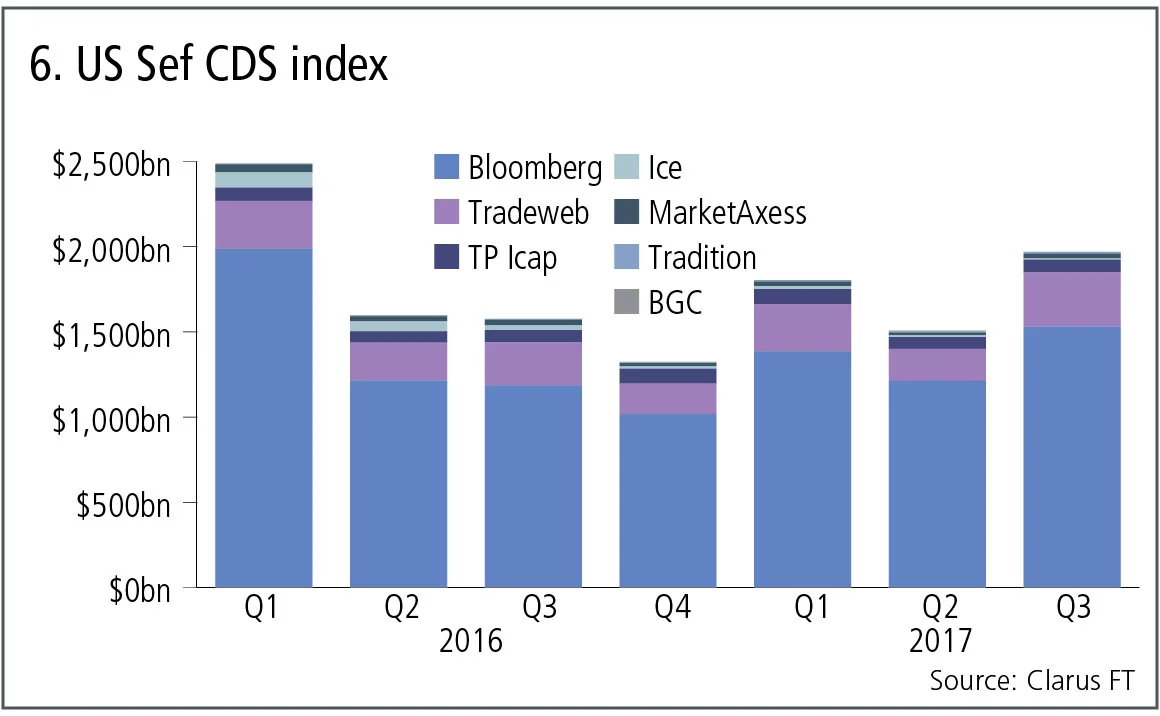
Figure 6 shows:
- A similar trend to figure 5, with the third quarter of 2017 up from the same period in 2016.
- Bloomberg by far the largest with $1.5 trillion in the third quarter, up 29% year-on-year and retaining the lion’s share of the market.
- Tradeweb is next with $318 billion in the third quarter, up 26% from last year for a year-to-date share of 15%.
- TP Icap combined with $72 billion in the third quarter, which is flat compared with the same period last year.
- The rest all barely adding to their small share of the market – meaning Bloomberg and Tradeweb are capturing all the growth.
Amir Khwaja is chief executive of Clarus Financial Technology.
コンテンツを印刷またはコピーできるのは、有料の購読契約を結んでいるユーザー、または法人購読契約の一員であるユーザーのみです。
これらのオプションやその他の購読特典を利用するには、info@risk.net にお問い合わせいただくか、こちらの購読オプションをご覧ください: http://subscriptions.risk.net/subscribe
現在、このコンテンツを印刷することはできません。詳しくはinfo@risk.netまでお問い合わせください。
現在、このコンテンツをコピーすることはできません。詳しくはinfo@risk.netまでお問い合わせください。
Copyright インフォプロ・デジタル・リミテッド.無断複写・転載を禁じます。
当社の利用規約、https://www.infopro-digital.com/terms-and-conditions/subscriptions/(ポイント2.4)に記載されているように、印刷は1部のみです。
追加の権利を購入したい場合は、info@risk.netまで電子メールでご連絡ください。
Copyright インフォプロ・デジタル・リミテッド.無断複写・転載を禁じます。
このコンテンツは、当社の記事ツールを使用して共有することができます。当社の利用規約、https://www.infopro-digital.com/terms-and-conditions/subscriptions/(第2.4項)に概説されているように、認定ユーザーは、個人的な使用のために資料のコピーを1部のみ作成することができます。また、2.5項の制限にも従わなければなりません。
追加権利の購入をご希望の場合は、info@risk.netまで電子メールでご連絡ください。
詳細はこちら コメント
オペリスク・データ:日本のレストラン向け決済企業が7億ドルの損失を計上
また、バローダ銀行の詐欺事件の提訴、ウェルズ・ファーゴのポンジ・スキーム問題、そしてスウェドバンクのパナマ文書関連の賠償金支払いについても取り上げます。データ提供:ORX News

プライベートクレジットリスクは、システミックなものでなくても深刻になり得る
リスク管理のリーダーが、プライベートクレジット部門のリスクは抑制されているという共通認識に存在する3つの欠陥について概説しました

無期限先物:満期がなくなる時代、ガバナンスが鍵となる
ヴィシャル・グプタ氏は、無期限先物が先物のロールオーバー問題を解決する一方で、市場構造や規制上のリスクを抱えていると警告しています

オペリスクに関するデータ:ペントウォーター社、エイビス株の試運転に多額の費用を投じる
また、ルーマニアのロボル監督当局がベンチマーク操作に対して厳しい姿勢を示しました。Wamcoによる「チェリーピッキング」も阻止されました。データ提供:ORX News

ユーロ対米ドルのステーブルコインをめぐる議論は的外れである
Flow Tradersのデジタル資産部門責任者は、ステーブルコインの流動性の進化において、市場構造と規制の整合性が中心的な役割を果たしていると述べています。

AIのコンピューティングにあるガバナンス問題
取引所がコンピューティング先物の導入に乗り出す中、ヴィシャル・グプタ氏は、真の試練は製品の革新性ではなく、ガバナンスがその進展に追いつけるかどうかにあると主張しています

なぜ価格が急騰する?
「長年にわたる調査を経ても、依然としてはっきりとは分かっていない」とジャン=フィリップ・ブショー氏は述べています

ギャップリスクは気にしないで:クレジット・リパックの規制上の取り扱い
シニア・クオンツのアンデレイ・チリキン氏は、リパッケージングにおけるギャップ・リスクは、バーゼルIIIの自己資本規制上の信用評価調整には該当しないと主張しています