
Monthly swaps data review: ADV for OTC derivatives
Daily volumes are a pillar of the futures market, and can now be found for US swaps

Average daily volume (ADV) is one of the listed derivatives market’s statistical pillars. Published by exchanges for each of their contracts, it is widely used by participants as a way to compare market sizes and decide trading strategies.
An analogous figure can now be derived from over-the-counter market data. As in the futures market, ADV for swaps could allow investors and hedgers to work out where they are best able to execute – and may also have the added benefit of encouraging futures market-makers to take a fresh look at the opportunities of expanding into the OTC space.
The caveat is that notional figures, arguably the simplest and most appealing way of comparing OTC trading volumes, are also the wrong starting point – sensitivity to interest rates is a better basis for comparison.
As an example of ADV disclosures in the listed market, the table below – taken from a CME Group report – shows ADV data for April and March 2017.
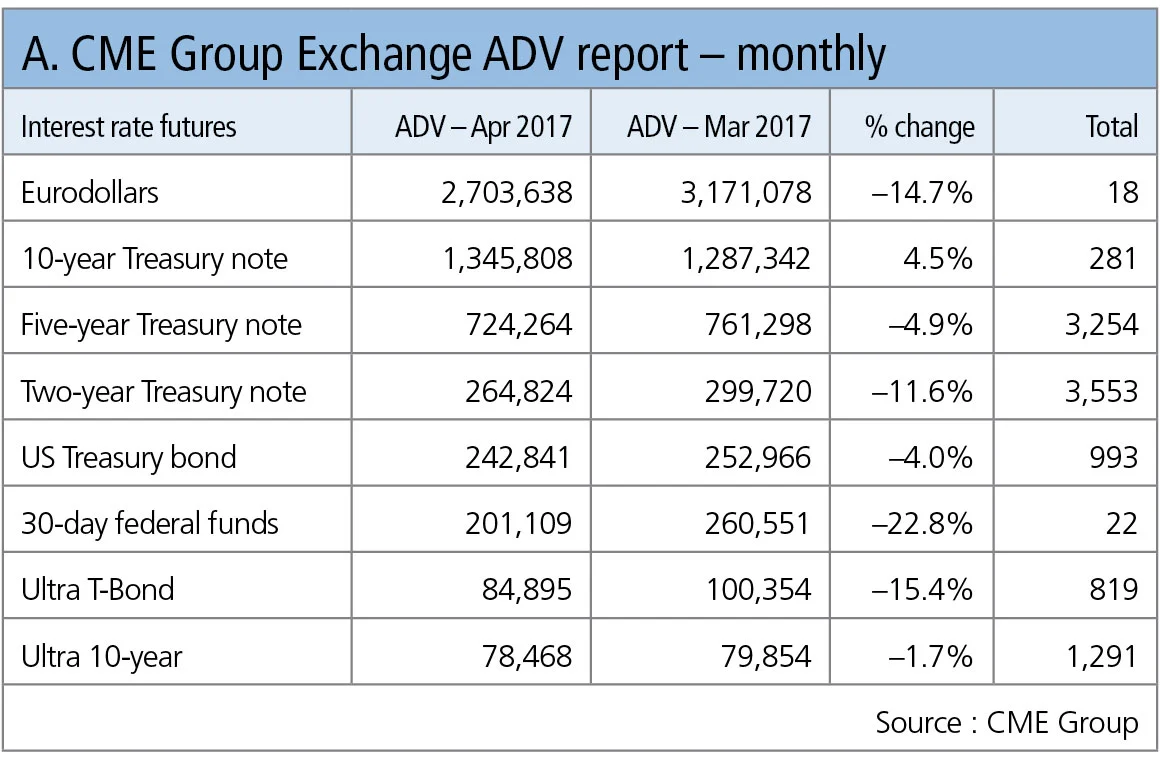
Table A shows:
- ADV as the number of contracts traded for each market, with Eurodollars the largest, with 2.7 million in April, down 14.7% from March.
- The 10-year Treasury note is next – and so it continues in declining order of volume, with the data showing April trading was lighter across the board, particularly for the federal funds and Eurodollar contracts, with only the 10-year Treasury note higher.
- Note some of these markets have different contract sizes, for example Eurodollar is $1 million per contract while the 10-year Treasury note is $100,000.
US dollar interest rate swaps
One impact of the Dodd-Frank Act in the US has been the public dissemination of trade-level data for OTC derivatives and the granular transparency this provides makes it possible to calculate ADV for specific products in an analogous fashion to futures.
By filtering and categorising the public dissemination record, it is possible to calculate ADV for specific products.
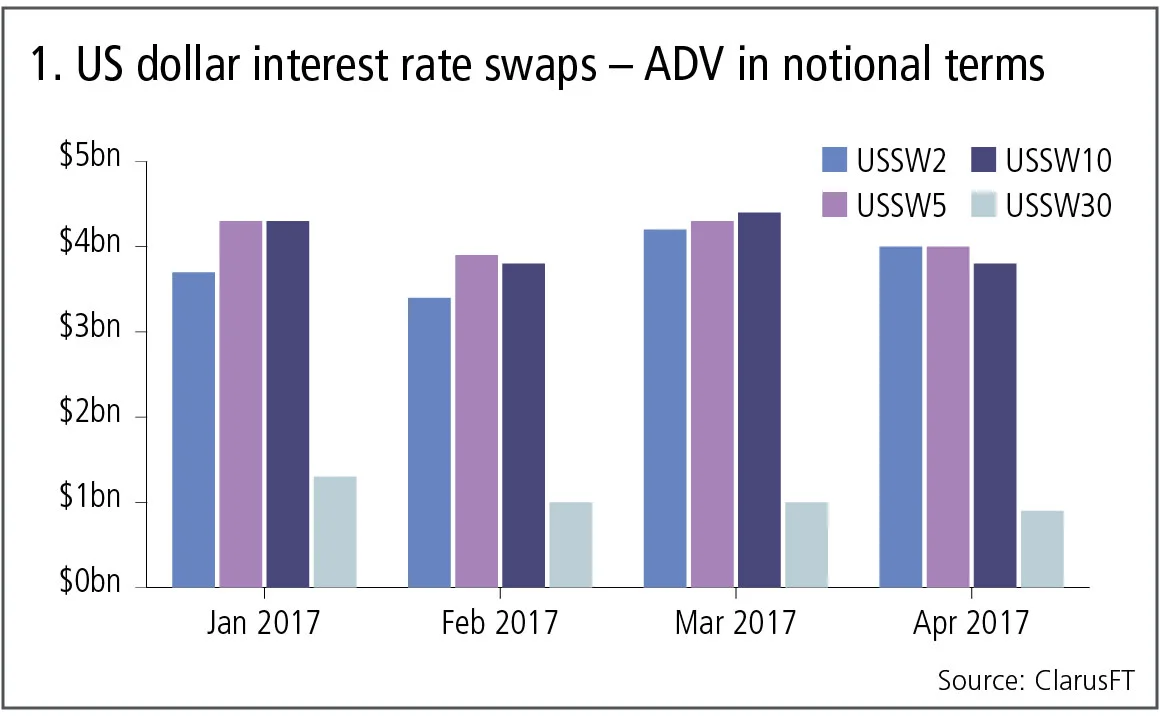
Figure 1 shows:
- ADV for the major vanilla US dollar swaps, denoted by their commonly used Bloomberg tickers of USSW2, USSW5, USSW10, USSW30, with the number corresponding to the maturity in years.
- The two-year, five-year and 10-year swaps each show approximately $4 billion ADV.
- The 30-year product has approximately $1 billion ADV.
This chart highlights the importance of the unit selected for ADV and while notional is useful to compare a specific ticker over the months in question, it is less useful when making comparisons between these tickers as the risk of a $100 million five-year swap is roughly half that of a 10-year swap.
Calculating ADV using the per-basis point interest rate sensitivity – DV01 – gives a different picture.
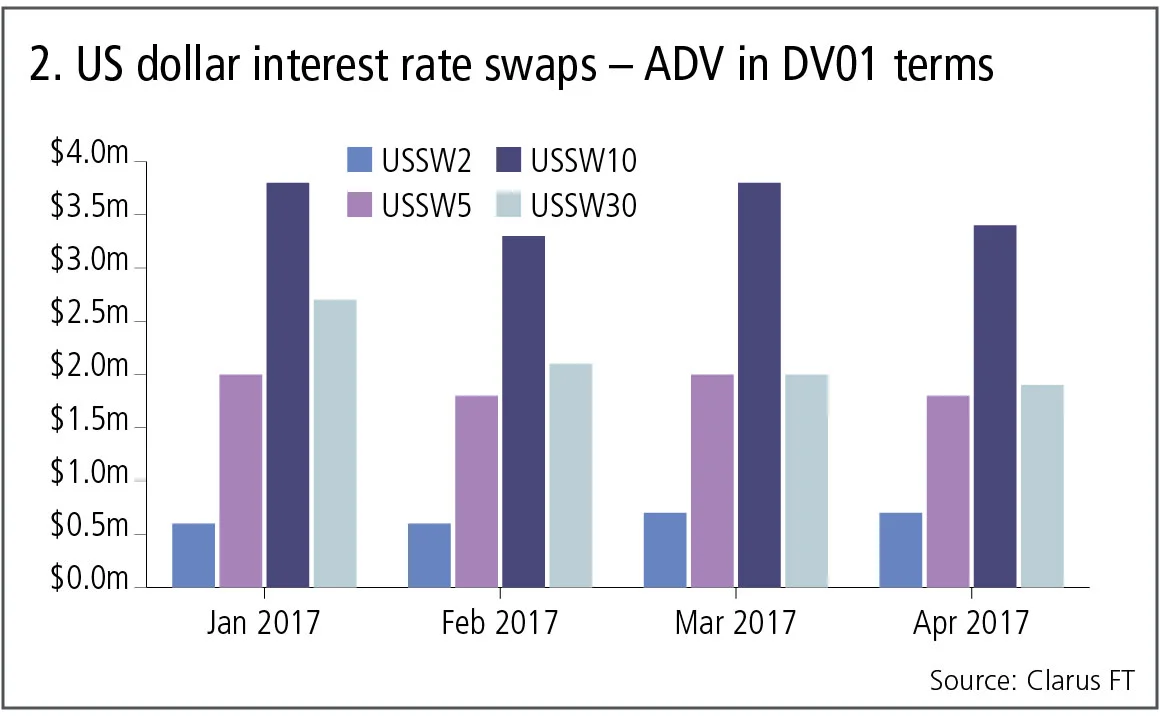
Figure 2 shows:
- USSW10 is the largest, with $3.4 million ADV in April 2017, which is down 13% from $3.8 million ADV in March 2017.
- USSW30 is the next largest, with $1.9 million ADV in April, down 6% month-on-month.
- USSW2 is the lowest, with $0.7 million ADV in April.
- Volumes in April are lower than March, similar to the CME figures above.
Caveats and assumptions
These ADV figures are not perfect and like any measure it is important to understand the assumptions before using.
First, US public dissemination rules mean that for trades above specified notional sizes – by asset class and tenor – the full notional is not disclosed. For instance, a 10-year interest rate swap would show as $170 million, whether the notional was $175 million or $250 million. In practice, this can understate the ADV by 20–30%.
Second, this is not global ADV for USSW30, it is the liquidity in the US market only. This is different to a futures contract where global liquidity is typically concentrated at the single exchange where the product trades.
Until Europe and Asia provide more public dissemination of OTC derivatives data, what we have are US ADVs, representing approximately 45% of global ADV for these instruments. More data will be available following the arrival next year of Europe’s new trading and transparency regime – the second Markets in Financial Instruments Directive (Mifid II).
US dollar overnight indexed swaps
Let’s turn now to the fed funds index and US dollar swaps that reference the overnight indexed swap (OIS) rate.
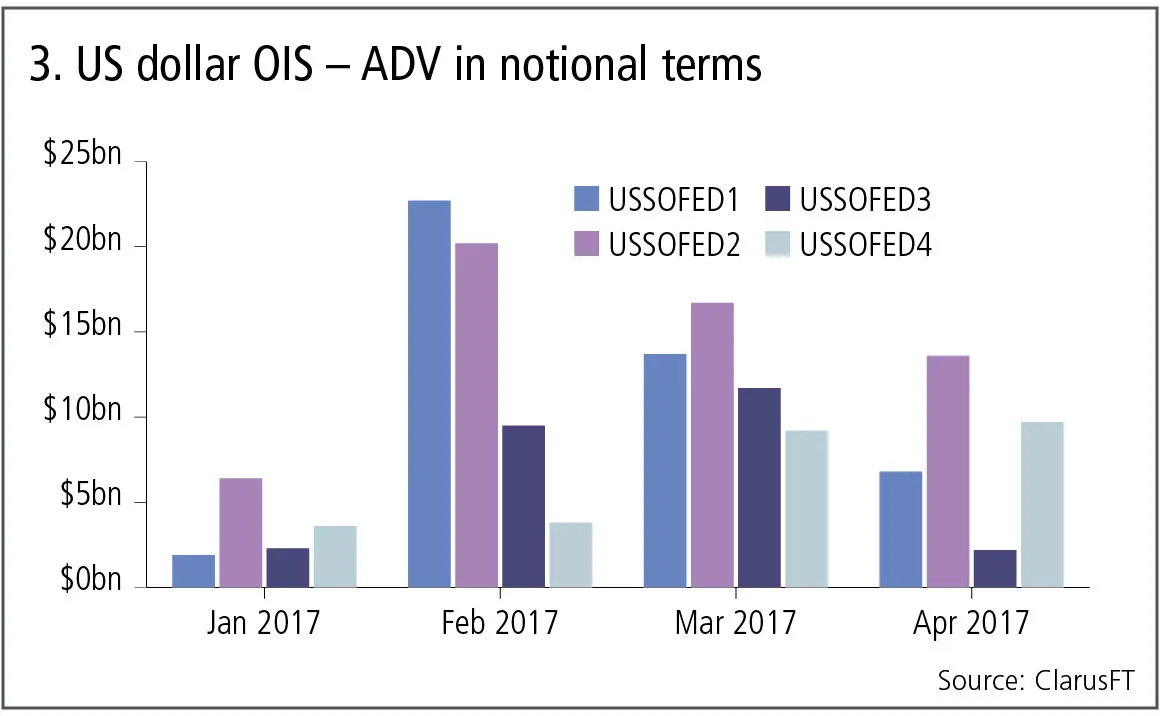
Figure 3 shows:
- The most common US dollar OIS swaps correspond with meeting dates for the Federal Reserve’s rate-setting committee, so USSOFED1 has a start date of the next meeting and a maturity of the subsequent meeting.
- As the meetings are generally six weeks apart, each of these represent short-dated swaps, making large notionals the norm.
- Feb 2017 shows a huge spike in volumes of FED1 and FED2, previously highlighted by this column.
- These subsequently dropped in March and again in April.
- April volumes are back down from their high, but remain well above January, only FED3 – the July 26 to September 20 period – showing low volume.
Cross-currency swaps
Cross-currency swaps are one of the largest products covered by non-cleared margin rules.
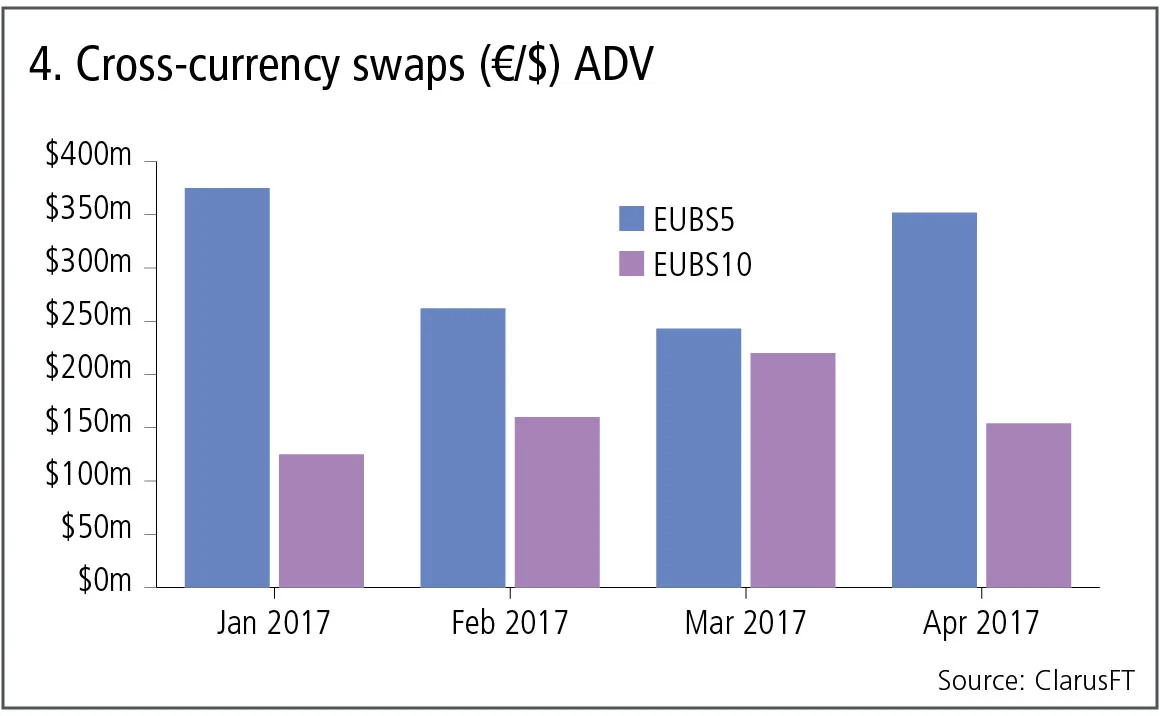
Figure 4 shows:
- €/$U cross-currency swaps, EUBS5 and EUBS10.
- EUBS5 ADV in April is €350 million ($391 million), up 45% from the €243 million in March and just below the high of €375 million in January.
- EUBS10 ADV in April is €154 million, down 30% from the €220 million in March.
Other jurisdictions
Aside from the US, Canada is the only other jurisdiction with trade-level public dissemination from trade repositories, which is required for the above analysis.
While Europe, Japan and other jurisdictions have daily transaction reporting to trade repositories, none have trade-level public dissemination. The only public reports available are at such a high level of aggregation that they are entirely useless to market participants: a missed opportunity to add transparency to these markets and complete the global picture.
Mifid II will provide much more useful data. The only caveat is that the complexity of regulations that seek to cover securities, exchange-traded and OTC derivatives means there is an over-reliance on unique identifiers, whch will make real-world use by market participants unnecessarily difficult.
コンテンツを印刷またはコピーできるのは、有料の購読契約を結んでいるユーザー、または法人購読契約の一員であるユーザーのみです。
これらのオプションやその他の購読特典を利用するには、info@risk.net にお問い合わせいただくか、こちらの購読オプションをご覧ください: http://subscriptions.risk.net/subscribe
現在、このコンテンツを印刷することはできません。詳しくはinfo@risk.netまでお問い合わせください。
現在、このコンテンツをコピーすることはできません。詳しくはinfo@risk.netまでお問い合わせください。
Copyright インフォプロ・デジタル・リミテッド.無断複写・転載を禁じます。
当社の利用規約、https://www.infopro-digital.com/terms-and-conditions/subscriptions/(ポイント2.4)に記載されているように、印刷は1部のみです。
追加の権利を購入したい場合は、info@risk.netまで電子メールでご連絡ください。
Copyright インフォプロ・デジタル・リミテッド.無断複写・転載を禁じます。
このコンテンツは、当社の記事ツールを使用して共有することができます。当社の利用規約、https://www.infopro-digital.com/terms-and-conditions/subscriptions/(第2.4項)に概説されているように、認定ユーザーは、個人的な使用のために資料のコピーを1部のみ作成することができます。また、2.5項の制限にも従わなければなりません。
追加権利の購入をご希望の場合は、info@risk.netまで電子メールでご連絡ください。
詳細はこちら コメント
オペリスク・データ:日本のレストラン向け決済企業が7億ドルの損失を計上
また、バローダ銀行の詐欺事件の提訴、ウェルズ・ファーゴのポンジ・スキーム問題、そしてスウェドバンクのパナマ文書関連の賠償金支払いについても取り上げます。データ提供:ORX News

プライベートクレジットリスクは、システミックなものでなくても深刻になり得る
リスク管理のリーダーが、プライベートクレジット部門のリスクは抑制されているという共通認識に存在する3つの欠陥について概説しました

無期限先物:満期がなくなる時代、ガバナンスが鍵となる
ヴィシャル・グプタ氏は、無期限先物が先物のロールオーバー問題を解決する一方で、市場構造や規制上のリスクを抱えていると警告しています

オペリスクに関するデータ:ペントウォーター社、エイビス株の試運転に多額の費用を投じる
また、ルーマニアのロボル監督当局がベンチマーク操作に対して厳しい姿勢を示しました。Wamcoによる「チェリーピッキング」も阻止されました。データ提供:ORX News

ユーロ対米ドルのステーブルコインをめぐる議論は的外れである
Flow Tradersのデジタル資産部門責任者は、ステーブルコインの流動性の進化において、市場構造と規制の整合性が中心的な役割を果たしていると述べています。

AIのコンピューティングにあるガバナンス問題
取引所がコンピューティング先物の導入に乗り出す中、ヴィシャル・グプタ氏は、真の試練は製品の革新性ではなく、ガバナンスがその進展に追いつけるかどうかにあると主張しています

なぜ価格が急騰する?
「長年にわたる調査を経ても、依然としてはっきりとは分かっていない」とジャン=フィリップ・ブショー氏は述べています

ギャップリスクは気にしないで:クレジット・リパックの規制上の取り扱い
シニア・クオンツのアンデレイ・チリキン氏は、リパッケージングにおけるギャップ・リスクは、バーゼルIIIの自己資本規制上の信用評価調整には該当しないと主張しています