
This article was paid for by a contributing third party.More Information.
Ultra 10-year Note futures: A $100 billion market

By Eric Leininger, CME Group
Introduced in 2016 to provide a futures contract more closely tied to the 10-year point on the Treasury curve, the Ultra 10-Year Note futures contract (CME Globex Symbol: TN; Bloomberg Symbol UXY) is one of the most successful launches in CME Group’s history. Today, it has grown into a $100 billion market in just five years. With a deliverable basket of original issue 10-Year US Treasury Notes with remaining terms to maturity at delivery between nine years and five months and 10 years, Ultra 10 offers an efficient, off-balance sheet and is a precise tool for hedging 10-year US Rates exposure.
Exhibit 1: Ultra 10-Year Note futures annual ADV and open interest
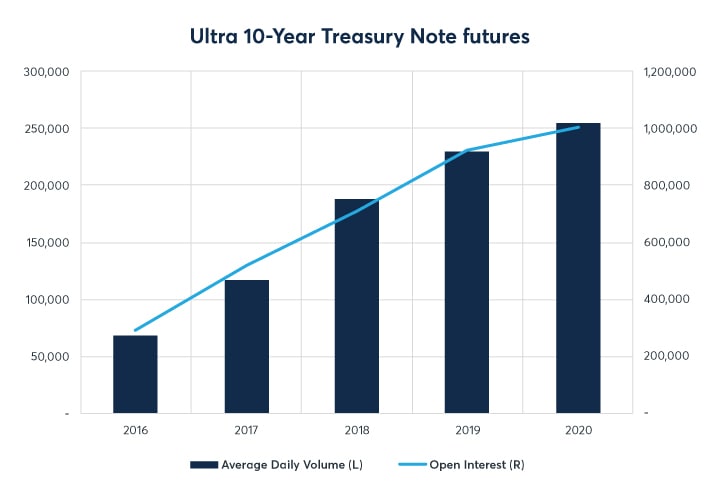
Source: CME Group
Recently, TN has broken out to even greater levels, aided in part by an increasingly broad pool of participants. In January, as TN tallied a record 131 large open interest holders in the CFTC Commitments of Traders report, open interest jumped 14% MoM to a record 1.14M contracts.
Exhibit 2: Ultra 10-Year Note futures daily open interest and weekly large open interest holders

Source: CME Group, CFTC Commitments of Traders Report
Additionally, January is often a time when asset managers establish positions based on their allocation needs. CFTC positioning data (Exhibit 3) shows Asset Manager gross position as a percentage of total TN open interest has risen to a nine-month high of 52%. The chart also shows Asset Manager long positions (blue bars) began exceeding short positions (red bars) on 12/31/20 for the first time since May 2020. The risk expression and capital efficiency of the Ultra 10-Year contract makes it a compelling instrument for managing exposure at the key 10-year tenor point on the UST curve.
Exhibit 3: Asset Manager/Institutional positioning in Ultra 10-Year Futures (5 May 2020 – 26 January 2021)
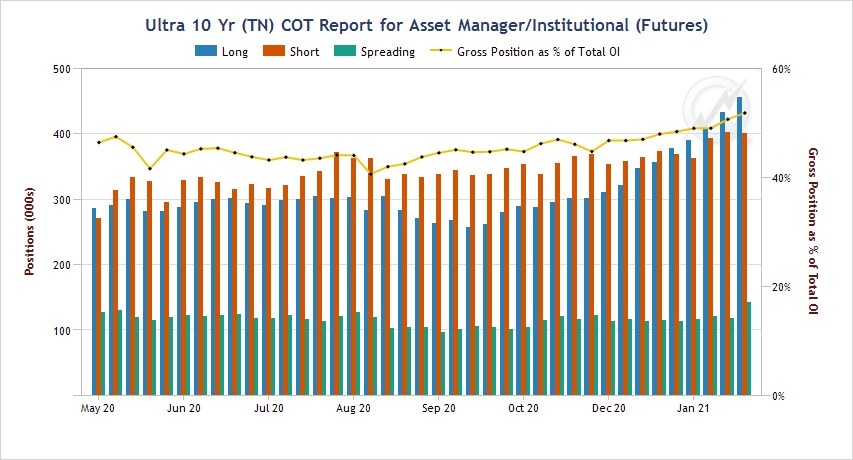
Source: QuikStrike COT tool, CFTC Commitments of Traders Report
Another contributing factor has been the dynamic nature of the 10-year yield move over the last three months. In January alone, the CTD implied forward yield for Ultra 10-Year futures moved from a low near 0.90% up to 1.15% and closed the month at 1.10%. With some expecting that Treasury yields could continue to climb in 2021 alongside increased issuance, risk management at this part of the curve could become even more critical.
Exhibit 4: Ultra 10-Year Note futures CTD implied forward yield history (4 January 2021 – 29 January 2021)
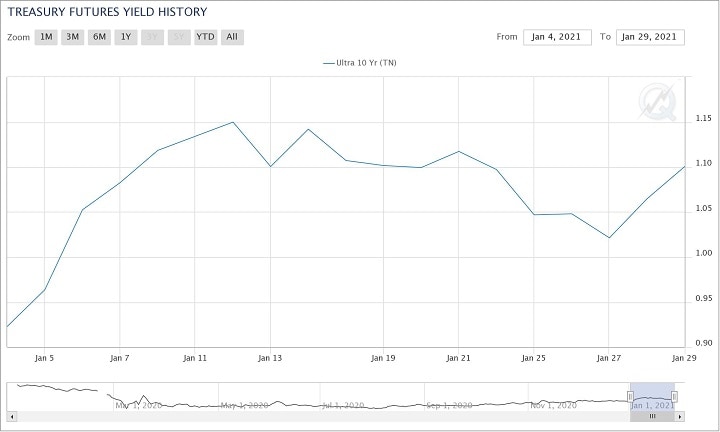
Source: Treasury Analytics tool, powered by QuikStrike
Speaking of the curve, a great amount of steepening has happened over the prior month, with Ultra 10-Year futures moving in near lock step to the long-end of the curve. The Ultra 10-Year vs. 2-Year yield spread currently sits near its 13-month high of ~1.00%, up from a recent low of 0.13% in February 2020. Increasingly, market participants are relying on inter-commodity spreads to efficiently execute yield curve spreads involving the 10-year point on the curve. For example, the TEX spread (+3 ZN, -2 TN) was the third most actively traded ICS instrument in 2020, with daily spread volume rising 24% YoY. Likewise, the NCB spread (+5 TN, -3ZB) was the fifth most active ICS in 2020. To learn more about ICS, and to view ICS volume by spread, check out our related article here.
Exhibit 5: Treasury futures yield curve change (29 January 2021 vs. 31 December 2020)
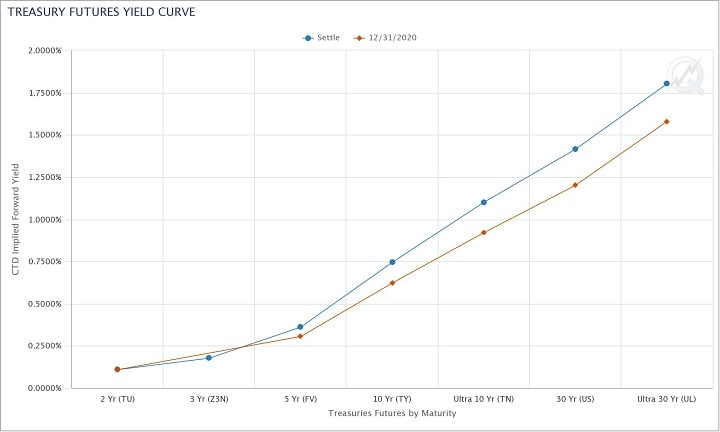
Source: CME TreasuryWatch tool, powered by QuikStrike
Exhibit 6: Ultra 10 vs. 2-Year futures yield spread (2 January 2020 – 29 January 2021)
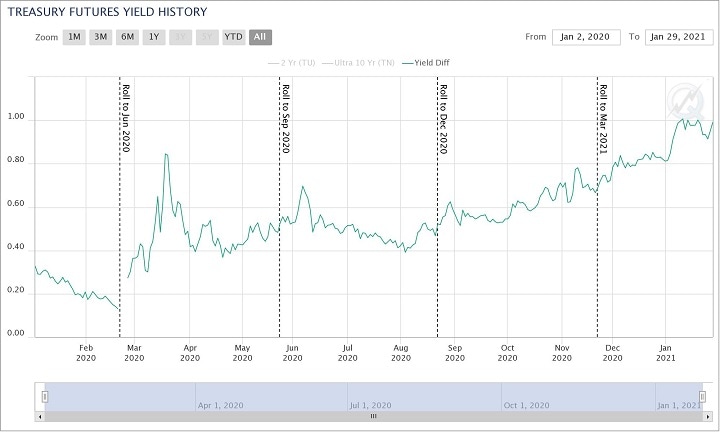
Source: Treasury Analytics tool, powered by QuikStrike
With impressive growth over its first five years, a narrowly defined basket, a rich source of inter-commodity spreads, and more Treasury issuance to come, Ultra 10-Year Note futures appear well-primed for even greater growth ahead.
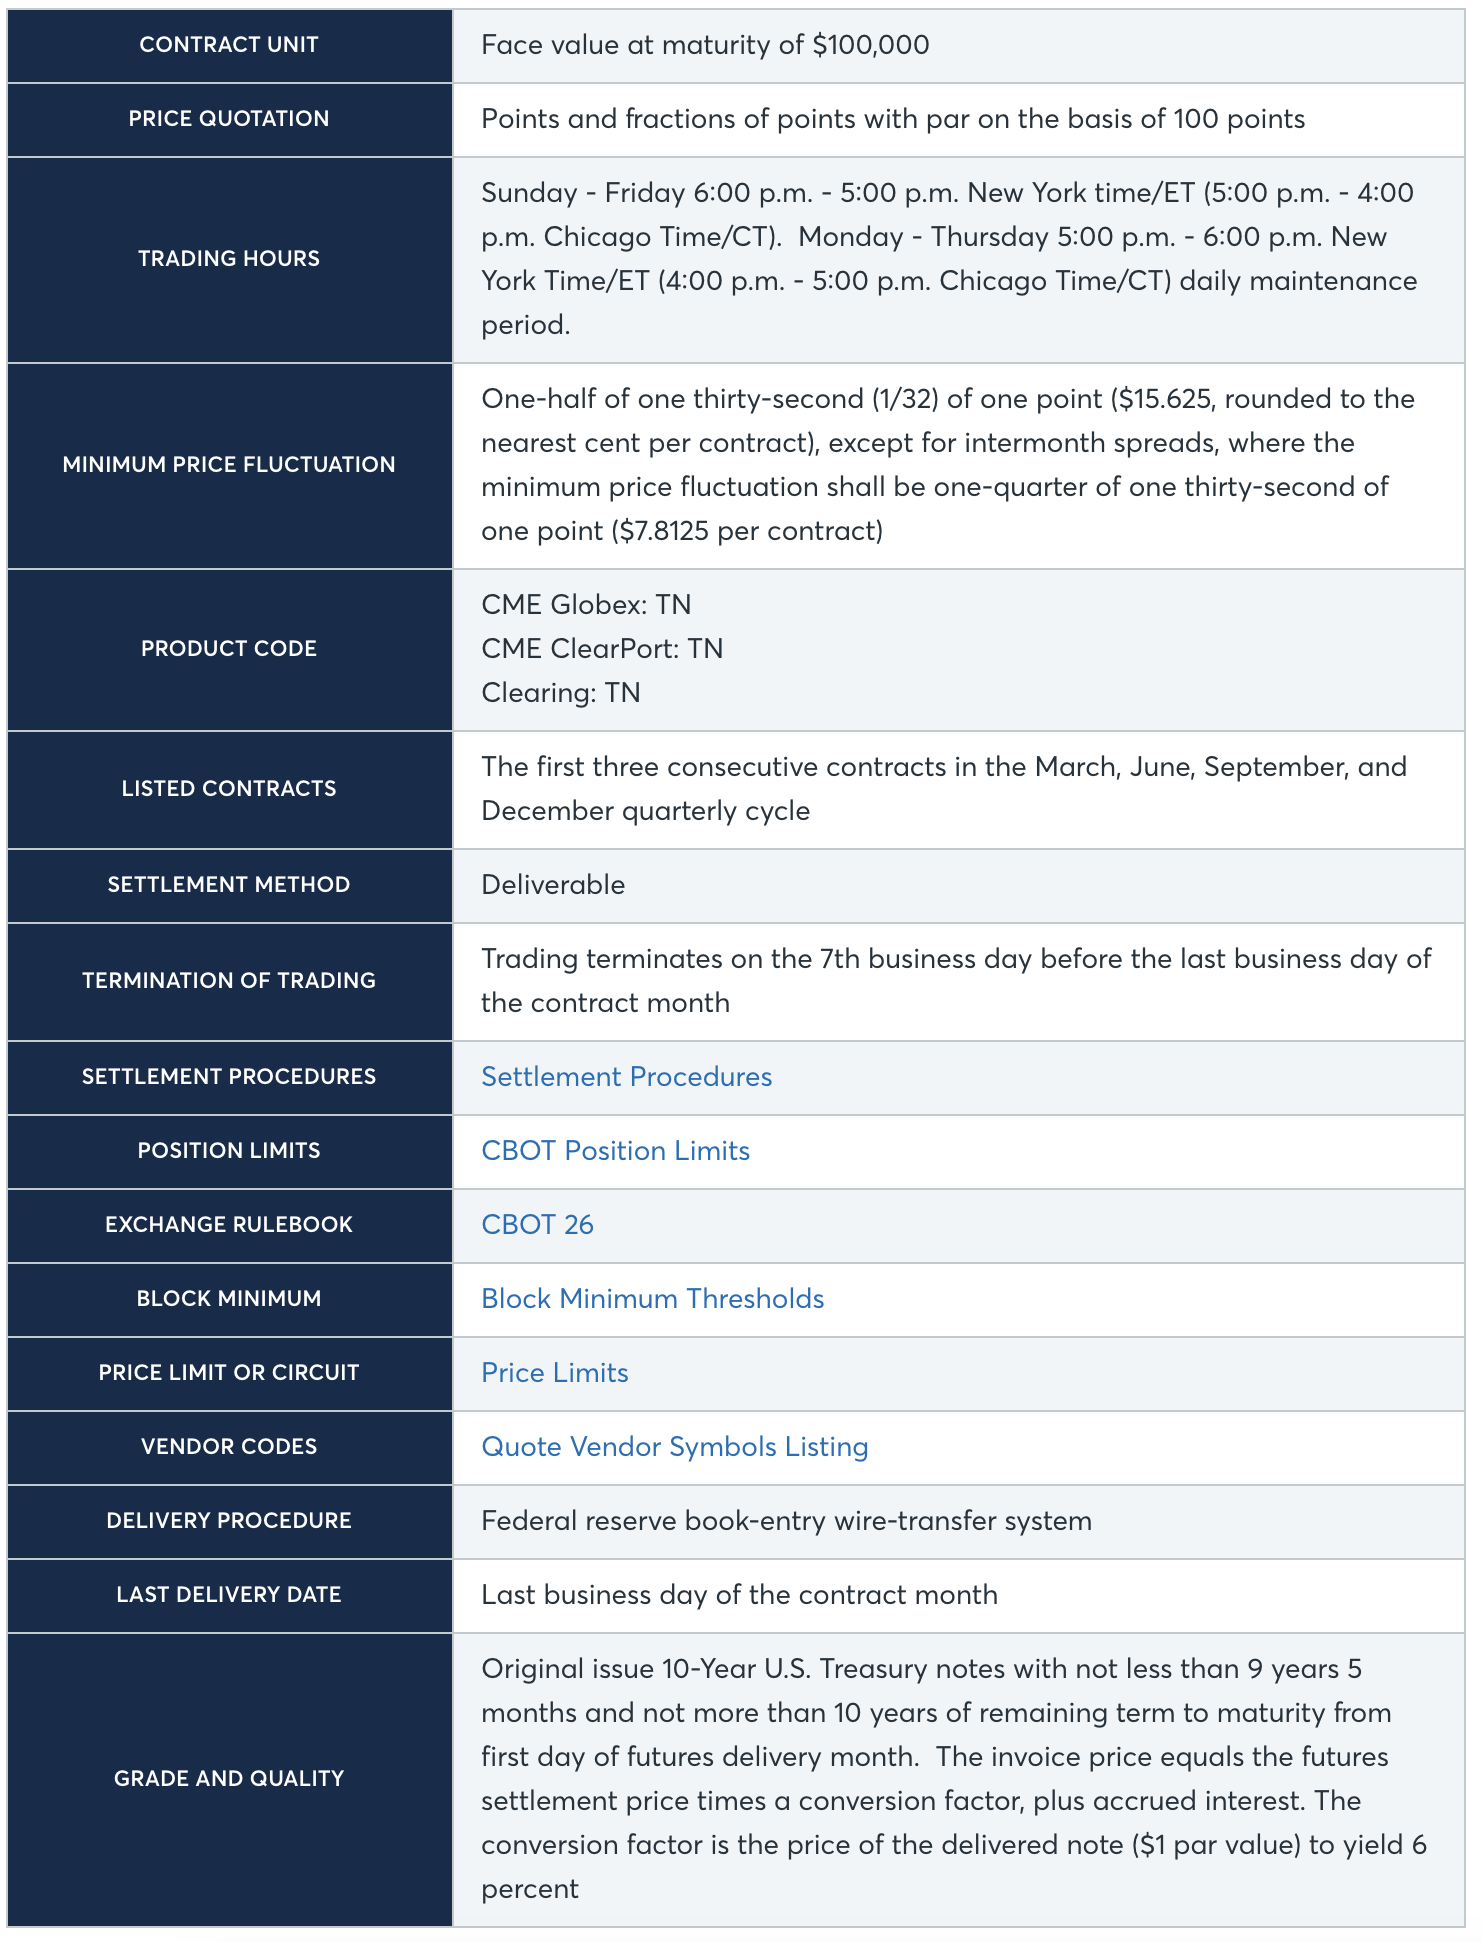
Ultra 10-Year US Treasury Note futures – Contract specs
Sponsored content
Copyright Infopro Digital Limited. All rights reserved.
As outlined in our terms and conditions, https://www.infopro-digital.com/terms-and-conditions/subscriptions/ (point 2.4), printing is limited to a single copy.
If you would like to purchase additional rights please email info@risk.net
Copyright Infopro Digital Limited. All rights reserved.
You may share this content using our article tools. As outlined in our terms and conditions, https://www.infopro-digital.com/terms-and-conditions/subscriptions/ (clause 2.4), an Authorised User may only make one copy of the materials for their own personal use. You must also comply with the restrictions in clause 2.5.
If you would like to purchase additional rights please email info@risk.net