
This article was paid for by a contributing third party.More Information.
The 20-year bond in a brave new world

By CME Group
The US Government has responded to COVID-19 in unprecedented ways to produce a huge and rapid fiscal policy response. To fund this policy, the Treasury announced that it will issue over $800 billion in Treasury securities over the next three months. Including issuance completed in April, the issuance number rises to over $1 trillion. That is a massive issuance schedule. Here is what is upcoming.
Treasury issuance details
In order to meet financing needs, the Treasury will issue a new tenor of 20-year bonds. Prior to the announcement, many market participants discussed the need to issue in a variety of other tenors including longer-dated 40- and 50-year securities. For now, the addition of a new 20-year security slots in neatly between the current issuance tenors of 10-year notes and 30-year bonds. The Treasury believes that there will be strong demand from investors for the 20-year bonds, which will allow the Treasury to finance its longer-term obligations at today’s very low interest rates.
Changing curve dynamics
The 20-year tenor brings entirely new dynamics across the back-end of the curve, a segment that traditionally relied on old 30-year securities to provide yield guidance. The new bond will provide an additional trading point for both cash and derivatives products which have seen volumes surge in recent years. It is likely that this activity can increase; potentially dramatically.
According to Treasury data, on May 6, the 20-year yield jumped 9 basis points higher at the end of the day. Tellingly, the 2/20s curve steepened 7 basis points higher as the market digested this rates regime change. The market did not seem prepared for either the overall coupon issuance nor the size of the 20-year.
Markets
At present, there is a two-decade gap between the issuance of a 30-year security and it next closest relative, the 10-year. This situation provides interesting dynamics for this large segment of the yield curve. As a 30-year bond ages, it generally becomes less liquid and more expensive to trade. In order to reduce transaction costs, portfolio managers and other market participants generally prefer to infrequently trade securities in this region, but to hedge them with more liquid parts of the curve. This can leave large duration mismatches and exposure without the proper tools to manage them.
Cash markets
At present, the current closest 20-year security is the 4-3/8% of May 15, 2040 bond originally issued in 2010. With such a large original coupon, and with a current yield about 1%, the price of the bond is almost 160 points. This means that the principal amount is currently over 1.5 times what a new 20-year bond will be. For comparison, the When Issued (WI) 30-year bond, 1¼% of May 15, 2050, will be closer to par and the settled amount will require less funding. In this opaquer part of the curve, the new 20-year should provide more clarity with a coupon close to its yield. This will give market participants a much-needed new tool to manage exposures more adroitly.
From a technical perspective, the new 20-year auction will be on May 20, 2020. The bond will settle on June 1, 2020, and have a final maturity date of May 15, 2040. The security will have the CUSIP 912810SR0.
This could spur much more trading in this segment as there are often non-linear benefits to new supply. Today, without a new 20-year issued bond, hedging costs are usually several basis points higher than liquid parts of the curve. When the new 20-year is auctioned in May, this shot of liquidity will allow more trading. While it might start slowly, it could rapidly grow as more trading brings more liquidity, then brings more trading.
In addition, relative value traders will now have a whole new area to trade and bring more liquidity. Curve trading should increase for benchmark securities and on- versus off-the-run trades will become more compelling and executable. This can have the dual benefits of increased liquidity and superior pricing discovery.
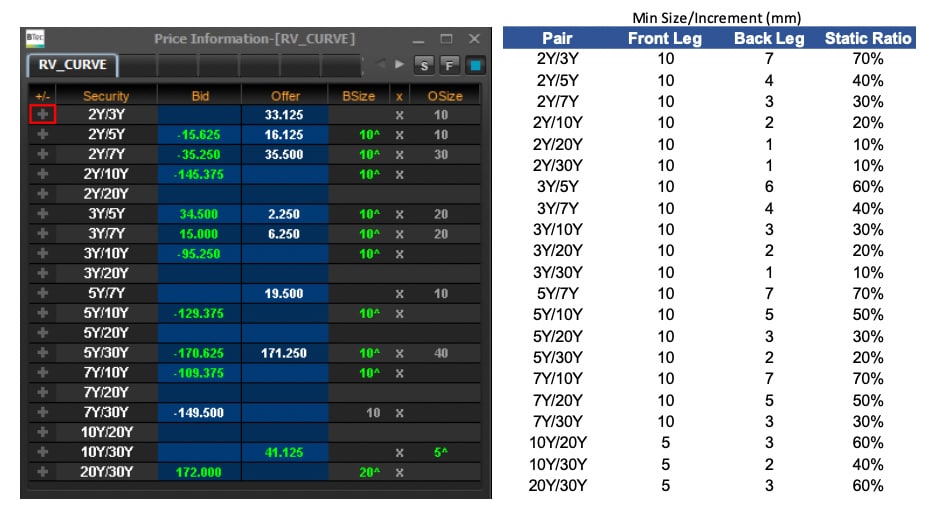
Exhibit 1: BrokerTec RV Curve
Derivative markets
Where the cash markets should receive a much-needed boost of liquidity and trading with the issuance of a new 20-year security, the impact to CME Group’s futures markets will be very interesting.
The new 20-year bond will mature on May 15, 2040. It is currently trading as the When Issued (WI) spread against the 3% of November 15, 2045 on CME Group’s BrokerTec platform. The 3% of November 2045 is currently the cheapest-to-deliver (CTD) for the Ultra Bond futures June and September 2020 contract months. Importantly, the new WI May 15, 2040 bond will belong to the delivery basket of the Classic Treasury Bond futures contract. Therefore, the cash WI May 2040 bond versus the 3% of November 2045 spread is like the Bond-Ultra (BOB) yield curve spread on CME Globex. This relationship will provide a rich set of risk management, spread, and box trading strategies.
Exhibit 2: With issuance growing over the next year, the Classic T-Bond delivery basket will grow by almost $1 trillion and increasing the number of securities 50%.
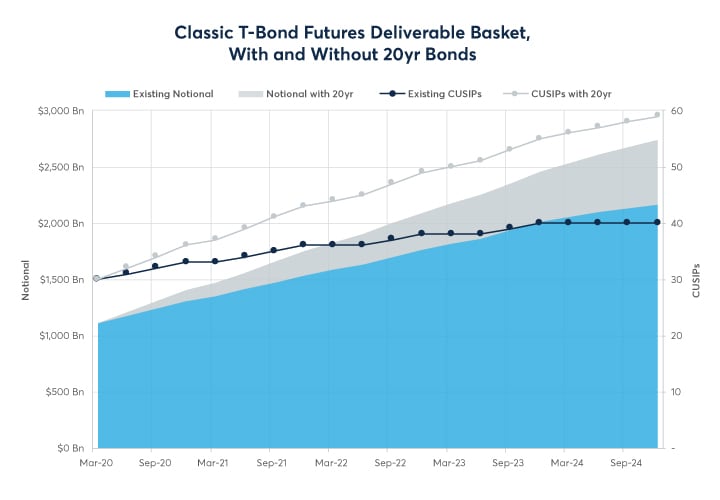
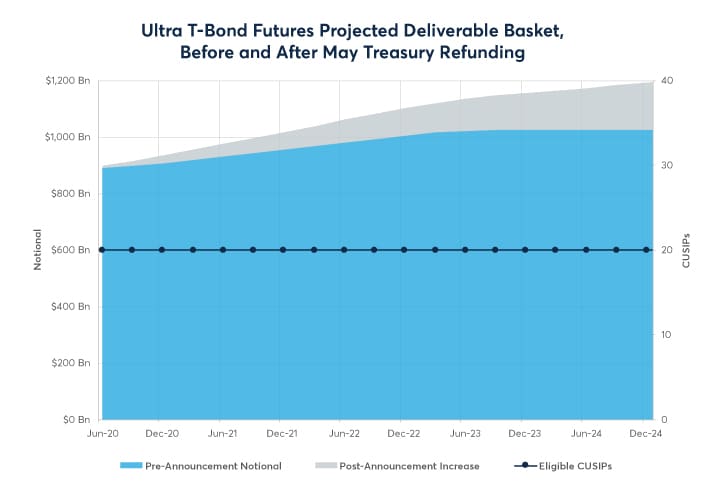
Exhibit 3: The Ultra Bond basket will retain the same CUSIP count and see more modest growth than the Classic T-Bond basket.
Issuance will have an impact on the other futures baskets as well. Here is the short-end of the curve.
Exhibit 4: 2-Year Note futures will ride a wave of increasing notional amounts in its delivery basket.
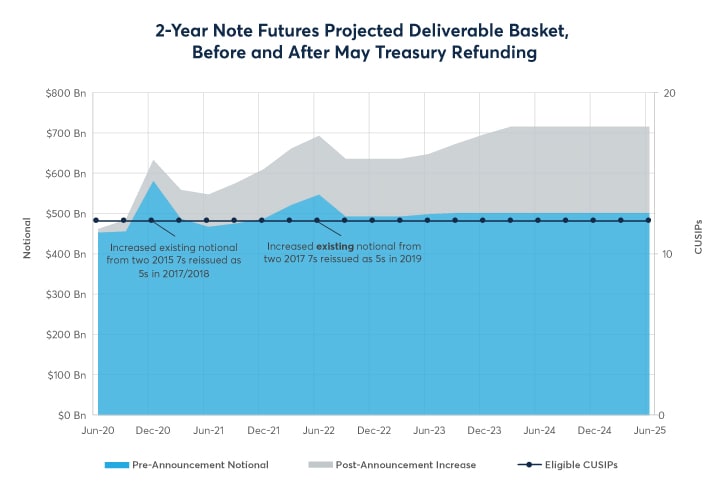
Exhibit 5: The 3-Year Note’s delivery basket will see upward waves of notional growth with a dip in the number of CUSIPs in 2021. Growth will be driven by expanded 3-yr issuance (extra $2B/month through year-end) and CME Group’s plans to bolster the deliverable basket with aging 7s on July 13.
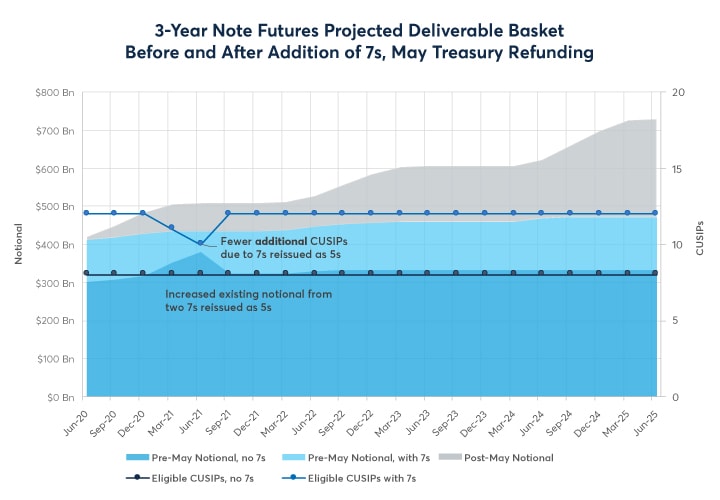
Exhibit 6: The 5-Year basket will increase in notional and will maintain the same CUSIP count.
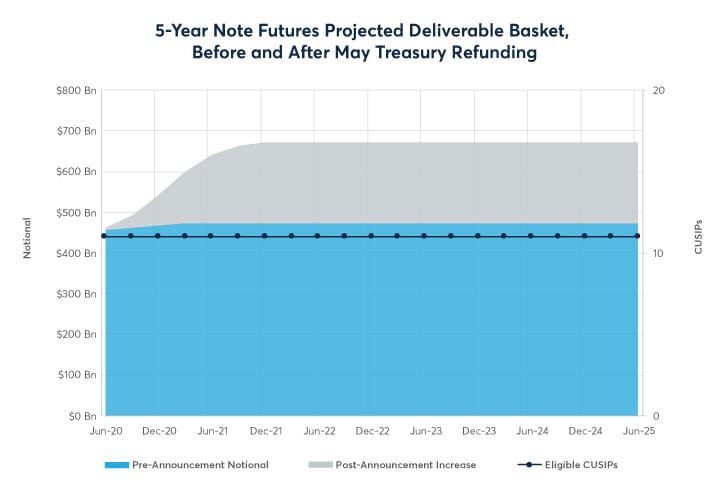
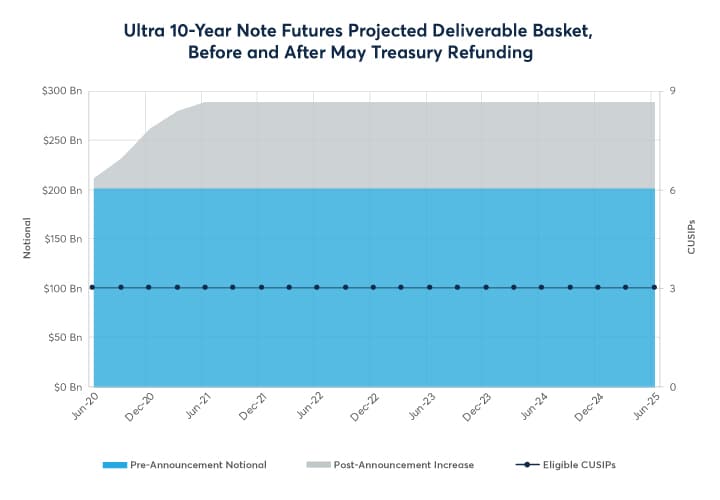
Exhibit 7: Like the 5-Year Note, the 10-Year and Ultra 10-Year baskets will continue to have the same number of CUSIPs, but the notional amounts will increase.
Inter-Commodity Spreads
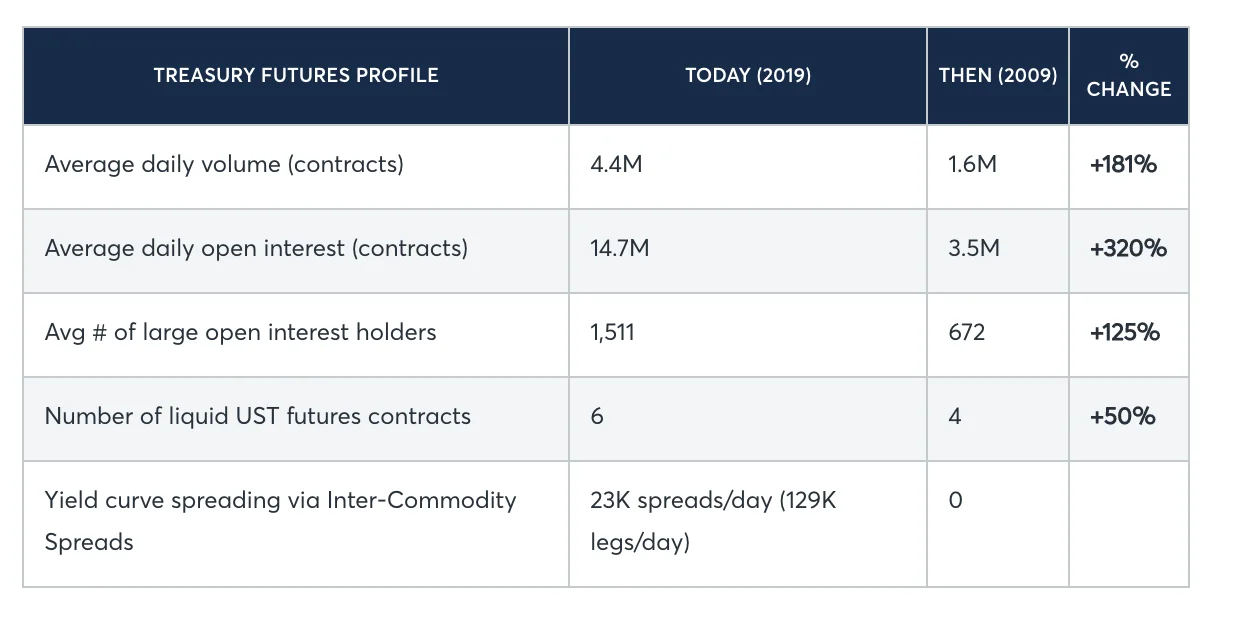
Inter-Commodity Spreads (ICS) are another area of the derivatives market that will likely grow. Treasury futures account for a much larger share of the daily risk transfer in Treasury markets and have seen exponential growth in the institutional user base, trading volumes, and open interest. Investors have demonstrated a strong appetite for additional tenor points on the UST futures curve as evidenced by the success of the Ultra T-Bond (launched 2010) and Ultra 10-Year Note futures (launched 2016). In addition, spread trading between Treasury futures has become more efficient with the rise of CME Globex-listed Inter-Commodity Spreads (ICS).
Exhibit 8: Treasury futures profile
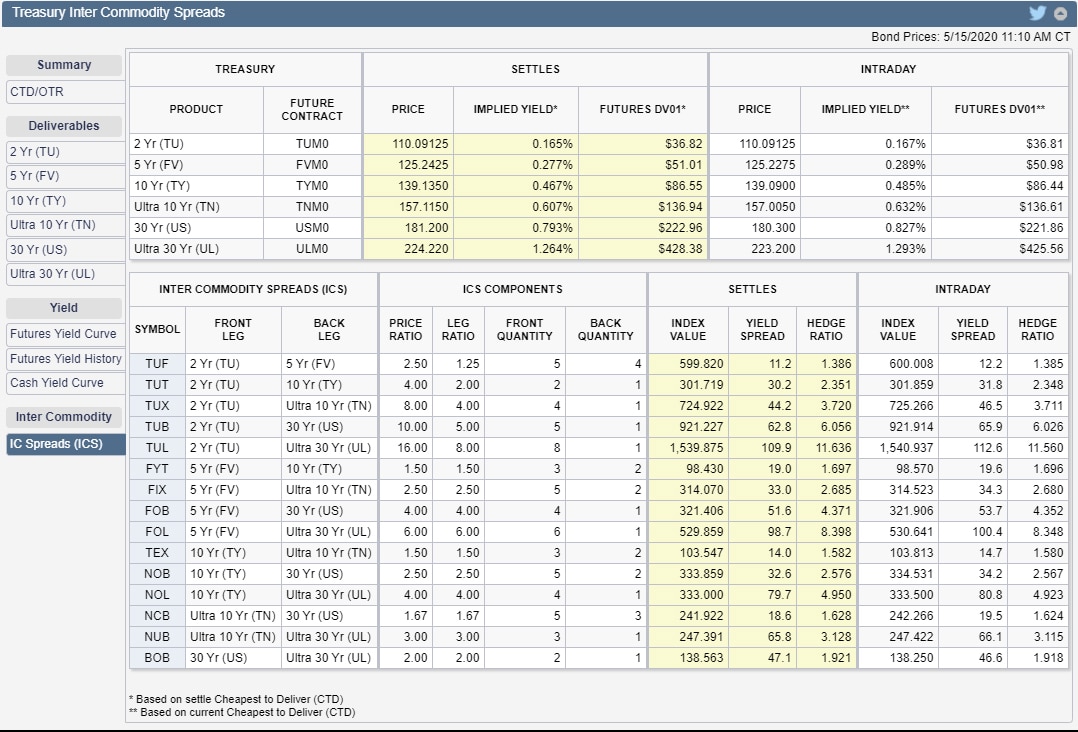
The below graphic shows a rich matrix of the current spreads that one can see on CME Group’s Treasury Analytics tool from QuikStrike. One can also expect more trading of futures against cash treasuries. Also note that the 20-year WI will trade as a spread of Nov 2045, the CTD to Ultra Bond.
Exhibit 9: Treasury Analytics tool
Funding markets
The Fed and ARRC-endorsed alternative reference rate, the Secured Overnight Financing Rate “SOFR”, is nearly identical risk as the UST yield curve. This makes funding and risk management a more transparent and easier process as the funding tools will have less basis effects that create “noise” in portfolios. In a zero-rate environment, it is unlikely that the new bond will become the CTD anytime soon.
Other implications
As we watch the new 20-year issuance, there are many questions that remain. Is it possible that other new bonds will be issued that are longer than the current 30-year bond? What will the long-end curve shape look like and how will this affect banks, long-dated liability managers, and other investors with needs in this sector. Regardless of your needs, CME Group has a risk management solution for you in the Brave New World.
Sponsored content
Copyright Infopro Digital Limited. All rights reserved.
As outlined in our terms and conditions, https://www.infopro-digital.com/terms-and-conditions/subscriptions/ (point 2.4), printing is limited to a single copy.
If you would like to purchase additional rights please email info@risk.net
Copyright Infopro Digital Limited. All rights reserved.
You may share this content using our article tools. As outlined in our terms and conditions, https://www.infopro-digital.com/terms-and-conditions/subscriptions/ (clause 2.4), an Authorised User may only make one copy of the materials for their own personal use. You must also comply with the restrictions in clause 2.5.
If you would like to purchase additional rights please email info@risk.net