
This article was paid for by a contributing third party.More Information.
June mid-month auctions – Coupon and yield trends

By Bobby Timberlake, CME Group
As Treasury issuance amounts set new records, coupons at the front end of the curve have marched downward, while back-end coupons have lagged.
Yield spreads across each popular measure show a consistent steepening of the curve through the first half of 2020.
While the Federal Open Market Committee (FOMC) has cut the Fed Funds target rate to nearly zero, focusing attention on Treasury notes at the front of the yield curve, equally interesting may be the relative movement at the back end. The mid-month auctions of the 3-year, 10-year, and 30-year provide an opportunity to examine Treasury trends a month after the May refunding that set a new trajectory on government borrowing.
With Treasury refunding periods operating on three-month cycles beginning in February, May, August, and November, June is the middle of the term. June typically sees smaller reissues for the back half of the curve. Nonetheless, auctions will see a record high for the 3-yr, and increases in the 10-yr and 30-yr over their equivalent March values. Across all notes and bonds, this means an increase of $35 billion over the same point in the last quarter, or $52 billion with the new 20-yr included.
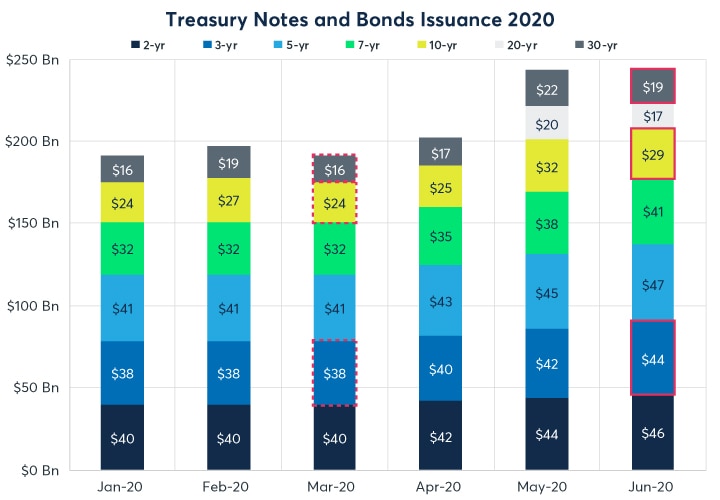
Source: Treasury Direct, US Treasury May Refunding Statement
The nominal coupons, led by FOMC target rate policy, show a general trend downward, which is more pronounced at the front end. The back end of the curve, impacted by longer-term economic projections, a desire for higher yielding assets, and Fed purchasing, has followed the front end but lagged in magnitude.
The 2-yr and 3-yr coupons have come all the way down to 1/8, low as the Treasury is likely to issue coupons. These are large ranges from coupon highs of 1 3/8 and 1 1/2, respectively, from the start of the year. The 10-yr and 30-yr will remain at 5/8 and 1 1/4 through July’s auctions, versus 1 3/4 and 2 3/8 in January, or 12.5 to 25 basis points less of a reduction than at the front end.
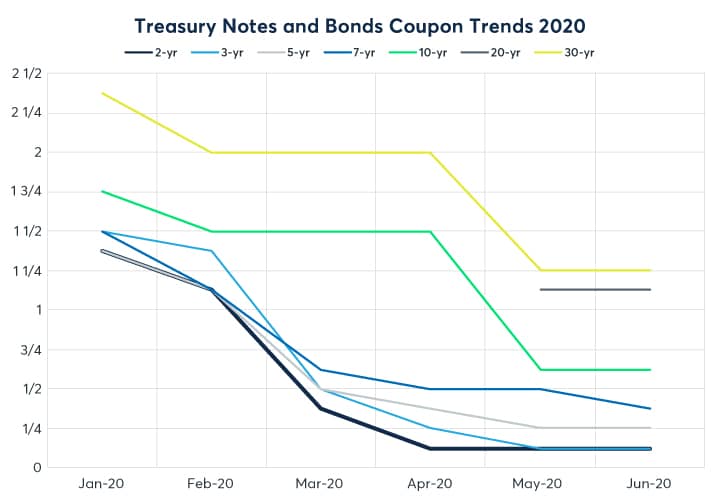
Source: Treasury Direct
Looking to effective yields of the on-the-run notes and bonds, this curve steepening is readily apparent. February shows a general reduction in anticipation of FOMC rate cuts, which occurred in March and accelerated this trend. However, not only did the long end of the curve lag, it recovered slightly by the start of June, even as the belly of the curve continued falling.
This leaves the 2-yr and 3-yr around 140 basis points lower than they started the year, as opposed to just 85 and 54 for the 10-yr and 30-yr. Historically closely watched, the 2s/10s spread has bull-steepened 33 basis points during that time, while its more recent equivalent, the 3m/10-yr, has increased by 56 bps. The former is tradable via Treasury futures inter-commodity spreads (ICS), as a 2:1 TUT1.
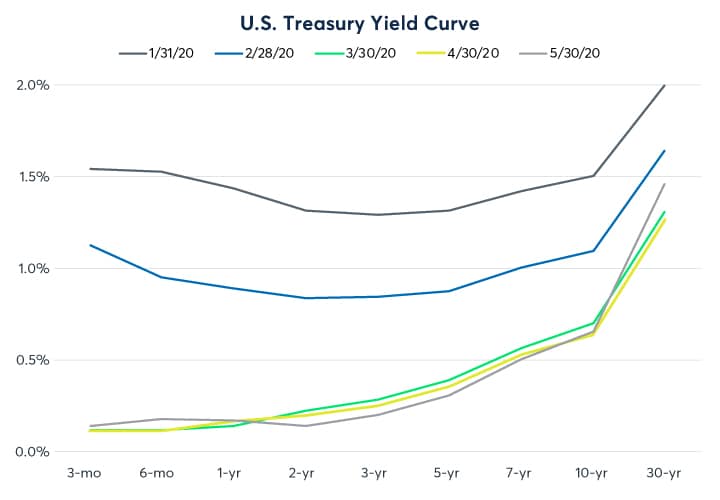
Source: Treasury Direct
The relative strength in the 30-yr yield is particularly interesting when compared to the newly issued 20-yr2. Several weeks after its relaunch, its yield remains stronger than an extrapolation between the 10-yr and 30-yr implies.
This kink may be due to its relatively new position on the curve, trading at a discount while liquidity builds, but when considered alongside the 30-yr’s premium it could also be a result of heavier issuance further out along the curve. Another factor at play is whether the Federal Reserve’s System Open Market Account (SOMA) purchases – i.e., the Fed’s balance sheet – are used to shape the long end of the curve, either implicitly or through an expansion in rate targeting policy.
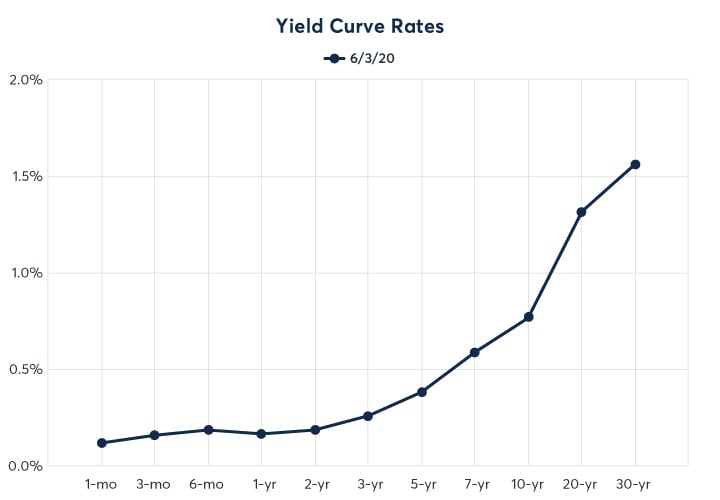
Source: QuikStrike
In addition to the popularity of the cash trade between the new 20-yr and the cheapest to deliver (CTD) CUSIP for Ultra Bond futures (3% of Nov 2045) and the CTD of the Bond futures (4 1/2s of Feb 2036), several Treasury futures inter-commodity spreads allow hedging and trading on either side of the 20-yr point of the curve, including:
- 10-Yr vs. Classic Bond (NOB)3
- 10-Yr vs. Ultra T-Bond (NOL)
- 10-Yr vs. Ultra 10-Yr (1:1 NON)
- Ultra 10-Yr vs. Classic Bond (NCB)
- Ultra 10-Yr vs. Ultra T-Bond (NUB)
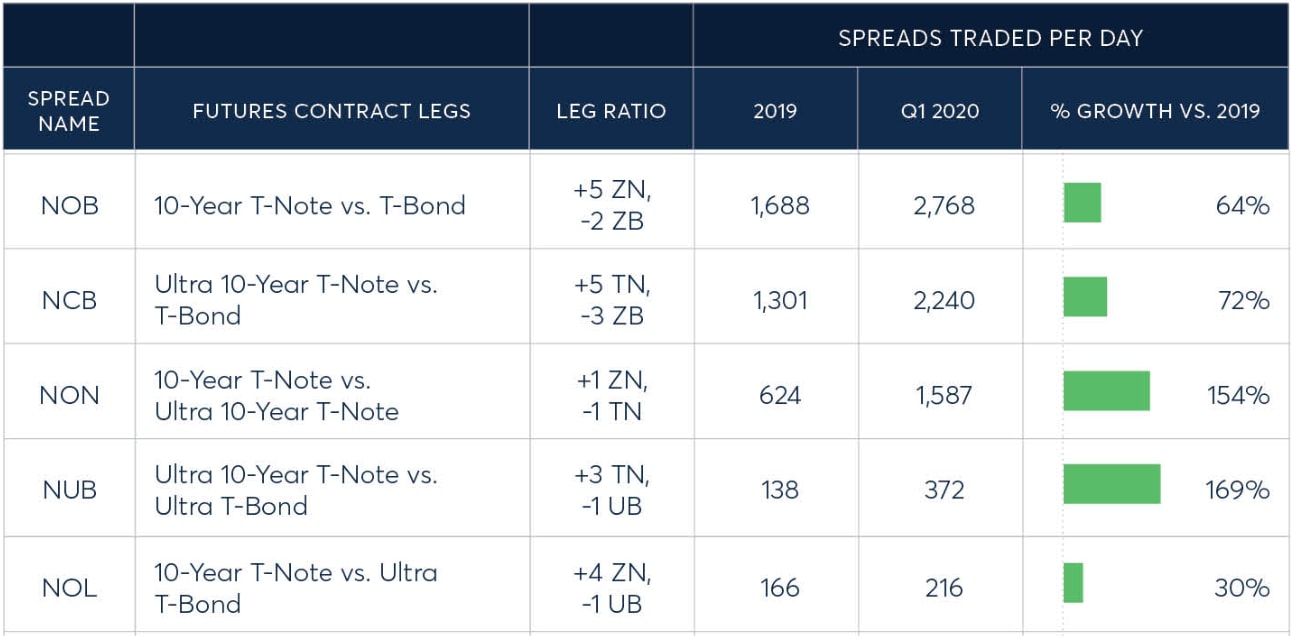
Source: CME Group
The growth in trading of these spreads and others4 highlights a renewed interest in longer-term relative value trades, the ability of markets to absorb larger debt issuance on an ongoing basis, and potential policy intervention further out on the curve.
1 Treasury futures ICS: https://www.cmegroup.com/trading/interest-rates/intercommodity-spread.html
2 Treasury Analytics, Cash Yield Curve: https://www.cmegroup.com/tools-information/quikstrike/treasury-analytics.html
3 Treasury futures ICS: https://www.cmegroup.com/trading/interest-rates/intercommodity-spread.html
4 Treasury Curve Trading: https://www.cmegroup.com/education/articles-and-reports/treasury-curve-trading-surges-in-q1-2020.html
About CME Group
As the world’s leading and most diverse derivatives marketplace, CME Group is where the world comes to manage risk. Comprised of four exchanges - CME, CBOT, NYMEX and COMEX - we offer the widest range of global benchmark products across all major asset classes, helping businesses everywhere mitigate the myriad of risks they face in today’s uncertain global economy.
Follow us for global economic and financial news.
Sponsored content
Copyright Infopro Digital Limited. All rights reserved.
As outlined in our terms and conditions, https://www.infopro-digital.com/terms-and-conditions/subscriptions/ (point 2.4), printing is limited to a single copy.
If you would like to purchase additional rights please email info@risk.net
Copyright Infopro Digital Limited. All rights reserved.
You may share this content using our article tools. As outlined in our terms and conditions, https://www.infopro-digital.com/terms-and-conditions/subscriptions/ (clause 2.4), an Authorised User may only make one copy of the materials for their own personal use. You must also comply with the restrictions in clause 2.5.
If you would like to purchase additional rights please email info@risk.net