Swaps data: OTC margin up; futures margin down
Swaps initial margin jumps 22% year-on-year, against surprise fall in futures margin, writes Amir Khwaja of Clarus FT

There were surprises and mysteries in the latest set of quarterly quantitative disclosures from derivatives clearing houses.
In the 12 months leading up to the end of March, the amount of initial margin consumed by interest rate swap clearing houses jumped 22%. But, here’s one surprise: IM for listed futures and options declined 9% over the same period. That’s not easy to explain when some of the biggest contracts in the listed market, such as CME’s Eurodollar interest rate futures, have been posting record volumes.
It could be that the pool of outstanding interest rate futures contracts – containing a greater share of shorter-dated trades than the corresponding swaps pool – becomes rapidly more mixed when interest rates rise, generating more offsets. But that’s just one guess.
Mystery came in the form of stats revealing large variation margin calls during the first quarter, indicating some significant single-day swings in the value of cleared positions. At a group of six derivatives clearing houses, the largest VM calls during the quarter added up to $31 billion. It is unlikely the calls all took place at precisely the same time – and the clearing houses don’t have to disclose this – but they may not have been far from each other.
It’s reminiscent of the huge margin calls that took place in the days after the UK’s 2016 vote to leave the European Union – but without the very public backlash that followed that earlier episode.
Elsewhere, the data provides further support for a theme previously highlighted in this column: in clearing, the big generally tend to get bigger.
Cleared interest rate swaps
Let’s start with quarterly trends for the largest over-the-counter product: interest rate swaps.
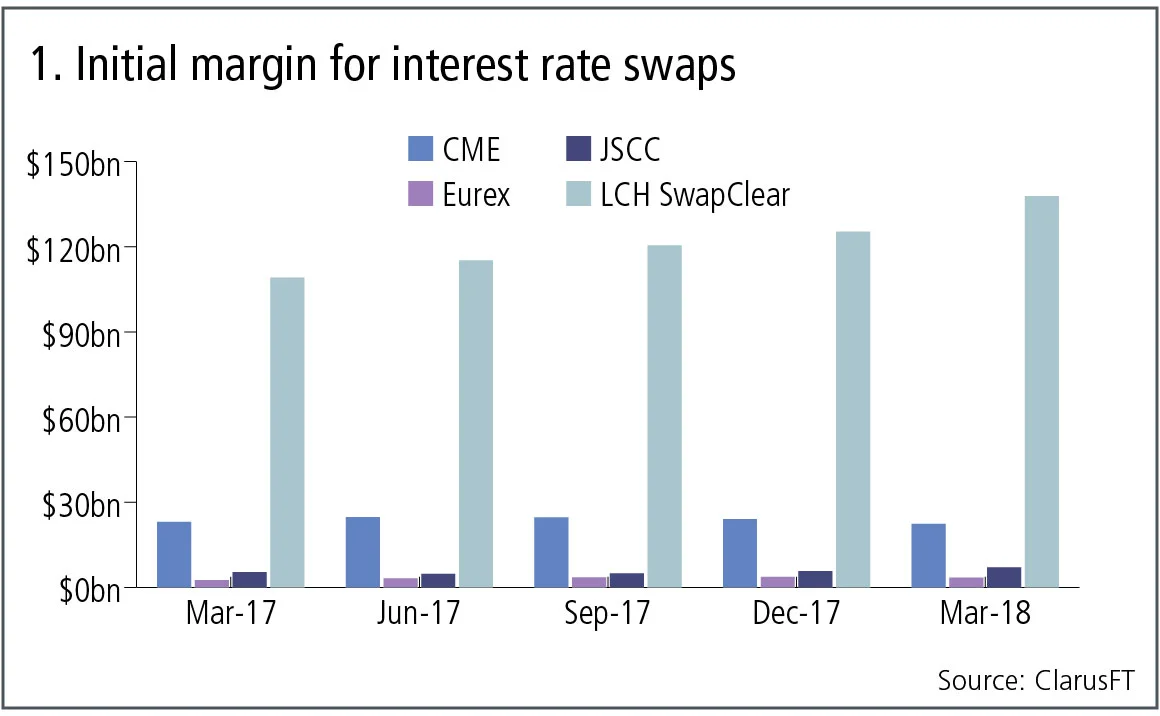
Figure 1 shows:
- Cumulative growth from $140 billion in IM at March 31, 2017 to $171 billion at March 31, 2018 – an increase of 22%.
- LCH SwapClear up 26% in US dollar terms, or 12% in sterling terms, with $138 billion of IM required at March 31, 2018, representing 81% of the total IM for the four selected clearing houses.
- CME down 3% in US dollar terms, with $22 billion of IM required at March 31, 2018, representing 13% of the total IM.
- Japan Securities Clearing Corporation (JSCC) up 32% in US dollar terms, or 25% in yen terms, with $7 billion of IM held at March 31, 2018, representing 4% of the total IM.
- Eurex up 33% in US dollar terms, or 15% in euro terms, with $3.5 billion of IM held at March 31, 2018, representing 2% of the total IM.
Apart from CME, all are showing continued strong growth in the amount of outstanding swaps risk held. One reason for this might be that in the US, mandatory clearing has long been in force, so all firms that are going to clear have been doing so for a while. In contrast, client clearing mandates and uptake in Europe and Japan are yet to reach a steady state.
Client clearing at LCH SwapClear
One way to get insight into this is to compare the trend in client margin with that for member firms’ own accounts.
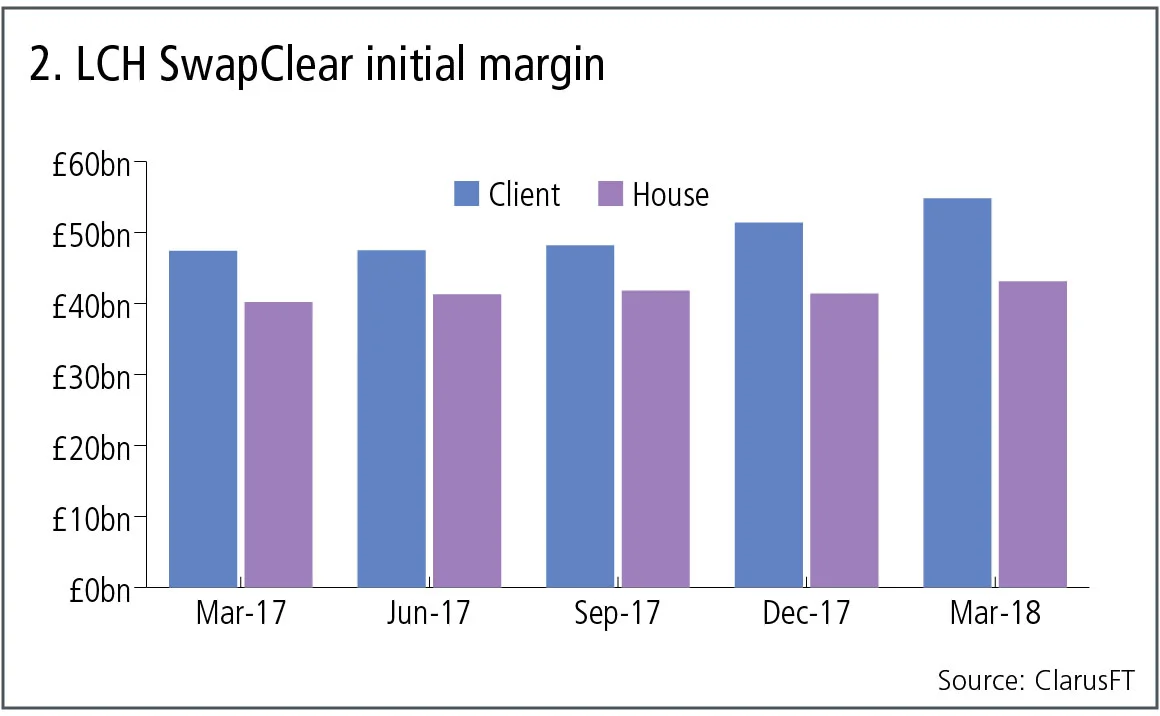
Figure 2 shows:
- Client IM higher than house and with a greater relative increase.
- Client IM of £55 billion, compared with £43 billion of house IM at March 31, 2018 – a 56% to 44% relative share.
- Client IM growing 31% over the year in US dollar terms, or 16% in sterling terms.
- House IM growing 21% over the year in US dollar terms, or 7% in sterling terms.
Cleared credit default swaps
Let’s turn next to credit default swaps, both index and single-name.
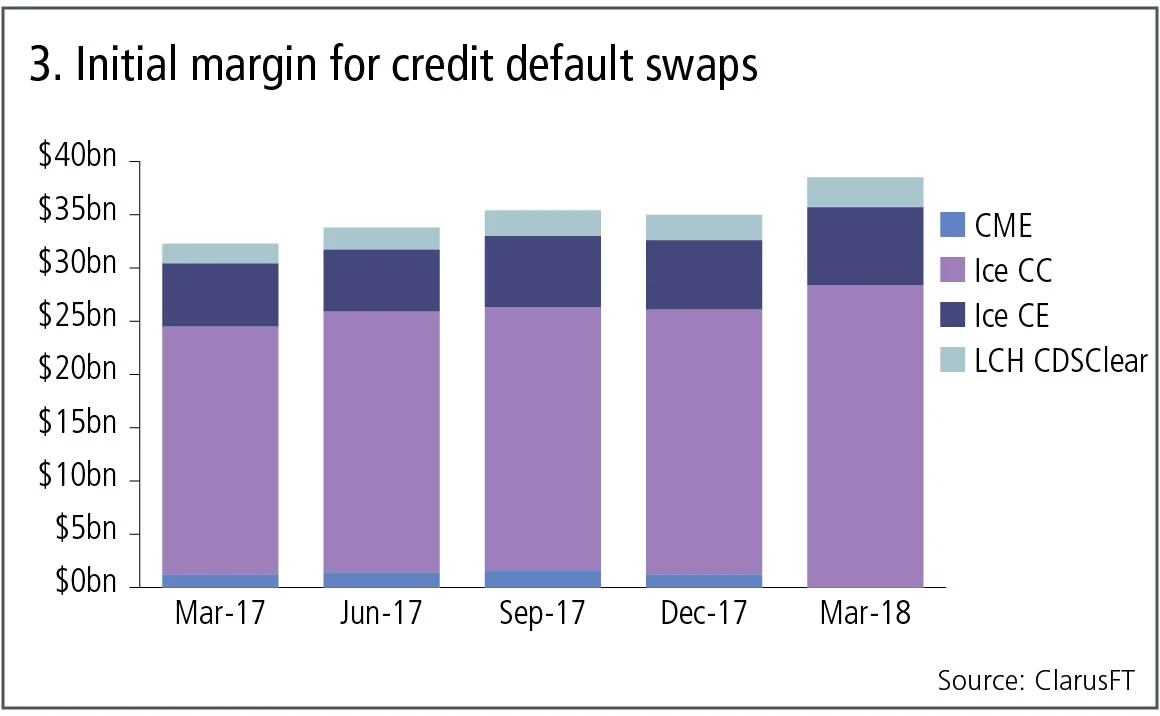
Figure 3 shows:
- Cumulative growth from $32 billion in IM at March 31, 2017, to $39 billion at March 31, 2018 – an increase of 20%.
- Ice Clear Credit up 22% in US dollar terms, with $28 billion of IM required at March 31, 2018, representing 74% of the total IM for the selected four clearing houses.
- Ice Clear Europe up 24% in US dollar terms, or 8% in euro terms, with $7 billion of IM held at March 31, 2018, representing 19% of the total IM.
- LCH CDSClear up 53% in US dollar terms, or 32% in euro terms, with $3 billion of IM held at March 31, 2018, representing 7% of the total IM.
- CME closed its CDS clearing offering at the end of 2017 and it looks like this volume is now at Ice Clear Credit.
Again, just as for interest rate swaps, credit default swaps also show strong growth in cleared risk held at clearing houses, most likely for similar clearing mandate reasons.
Futures and options
Let’s now turn to exchange-traded derivatives, to see if these markets show similar growth trends in IM.
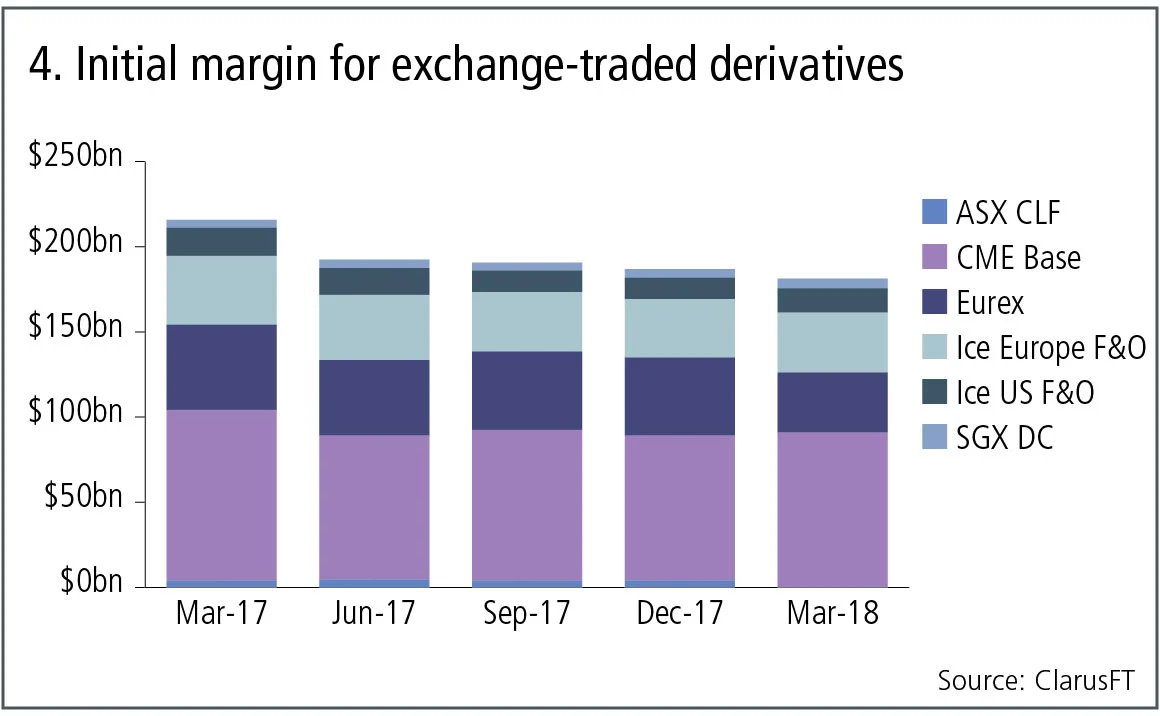
Figure 4 shows:
- Negative growth in IM requirements, which is surprising because of the growth in IM for OTC trades and the fact we have seen record volumes in some contracts, for example CME Eurodollar in the first quarter of 2018.
- For our selected six clearing houses, we see a 9% decrease in total IM from $216 billion to $197 billion.
- CME down 9% in US dollar terms, with $91 billion of IM required at March 31, 2018, which represents 46% of the total IM for these six clearing houses.
- Eurex down 5% in US dollar terms, or 18% in euro terms, with $47 billion of IM at March 31, 2018, representing 24% of the total IM.
- Ice Europe, futures and options down 13% in US dollar terms, with $35 billion of IM at March 31, 2018, representing 18% of the total IM.
- Ice US futures and options down 13% in US dollar terms, with $14 billion of IM at March 31, 2018, representing 7% of the total IM.
- SGX DC up 17% in US dollar terms, with $6 billion of IM at March 31, 2018, representing 3% of the total IM.
- ASX CLF (Concentrated Leaders Fund) flat, with $4 billion of IM at December 31, 2017, representing 2% of the total IM.
Cash movements
One of the other quantitative disclosures that drives home the size and importance of clearing, is the daily movement of cash between members and clearing houses to cover VM, and cash or securities to cover IM. In particular, the largest single-day movements in a quarter can be striking.
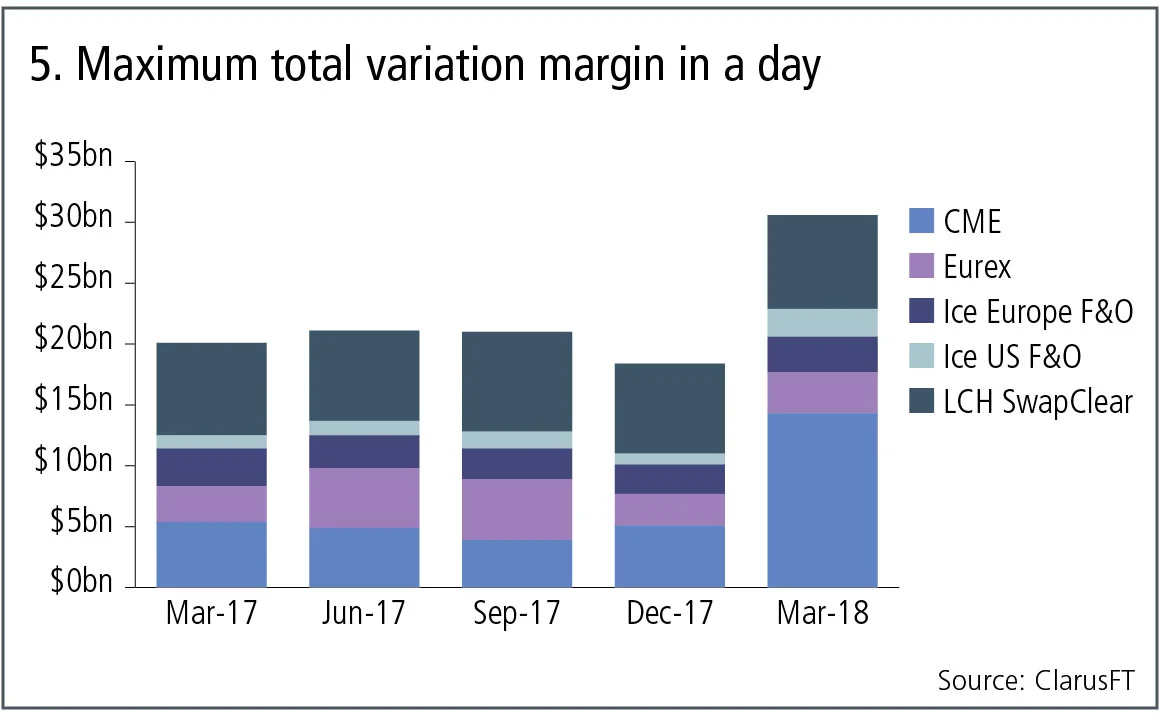
Figure 5 shows:
- That the quarter ending March 31, 2018, was the largest in the past 15 months, with a maximum total VM aggregated for the selected six clearing services of $31 billion. Probably these were not all on the same day, but most likely close in time.
- CME in particular, with a huge $14 billion daily VM call in the quarter, is much higher than its usual $5 billion.
A similar chart for the maximum aggregate IM call on a given day would show $9 billion in the quarter ending March 3, 2018, but some clearing houses include intra-day VM within this disclosure, because for IM to change that much in a day would not be credible for a measure meant to cover losses due to large market moves.
Amir Khwaja is chief executive of Clarus Financial Technology.
Only users who have a paid subscription or are part of a corporate subscription are able to print or copy content.
To access these options, along with all other subscription benefits, please contact info@risk.net or view our subscription options here: http://subscriptions.risk.net/subscribe
You are currently unable to print this content. Please contact info@risk.net to find out more.
You are currently unable to copy this content. Please contact info@risk.net to find out more.
Copyright Infopro Digital Limited. All rights reserved.
As outlined in our terms and conditions, https://www.infopro-digital.com/terms-and-conditions/subscriptions/ (point 2.4), printing is limited to a single copy.
If you would like to purchase additional rights please email info@risk.net
Copyright Infopro Digital Limited. All rights reserved.
You may share this content using our article tools. As outlined in our terms and conditions, https://www.infopro-digital.com/terms-and-conditions/subscriptions/ (clause 2.4), an Authorised User may only make one copy of the materials for their own personal use. You must also comply with the restrictions in clause 2.5.
If you would like to purchase additional rights please email info@risk.net
More on Comment
Op risk data: Corporate spies spell trouble for BBVA
Also: BofA buttonholed for alleged Epstein links; minority shareholders take a bite of Brookfield. Data by ORX News

The rise of AI politics
AI should not be treated as just another technology, writes MAS adviser David Hardoon

AI risk management and the shift to capability control
By reframing validation, banks can align innovation with regulatory demands and maintain robust risk discipline, argues risk manager

Tokenised commodities could help oil the machine
Shifting physical assets onto the blockchain eases collateral frictions, argues crypto expert

In the age of GenAI, why do we still need good models?
Jean-Philippe Bouchaud says models can guide artificial intelligence through regime shifts and away from overfitting

When trading speed outruns governance: the split-second control gap
A new form of light-driven electronics could be the next risk in market infrastructure, explains derivatives expert

What futures and options say about the cost of war
Spot prices reveal major disruption, futures indicate this will pass, options imply ongoing instability

For collateral, can TINA become TIA?
US Treasuries’ dominance as collateral in repo and derivatives is no longer set in stone, argues economist