
Swaps data: anatomy of a wild week in dollar swaps
Chaotic Italian politics jolted rates markets – including US dollar interest rate swaps, writes Amir Khwaja of Clarus FT

The difficulties facing Italy’s new populist coalition dominated the news – and the markets – at the end of May, prompting investors to move money out of euros and into US dollars and US Treasuries. The resulting severe drop in US Treasury yields and swap rates presents an interesting opportunity to look at price and volume data in the dollar swap market.
Tuesday, May 29
Let’s start with Tuesday, the day the market reopened after the US Memorial Day holiday. Dollar swap rates had been drifting down in the prior week with 10-year rates down a cumulative 15 basis points from May 21 to May 25 and daily volumes below or similar to monthly averages on each day in the week. Then, on Tuesday, the market dropped sharply.
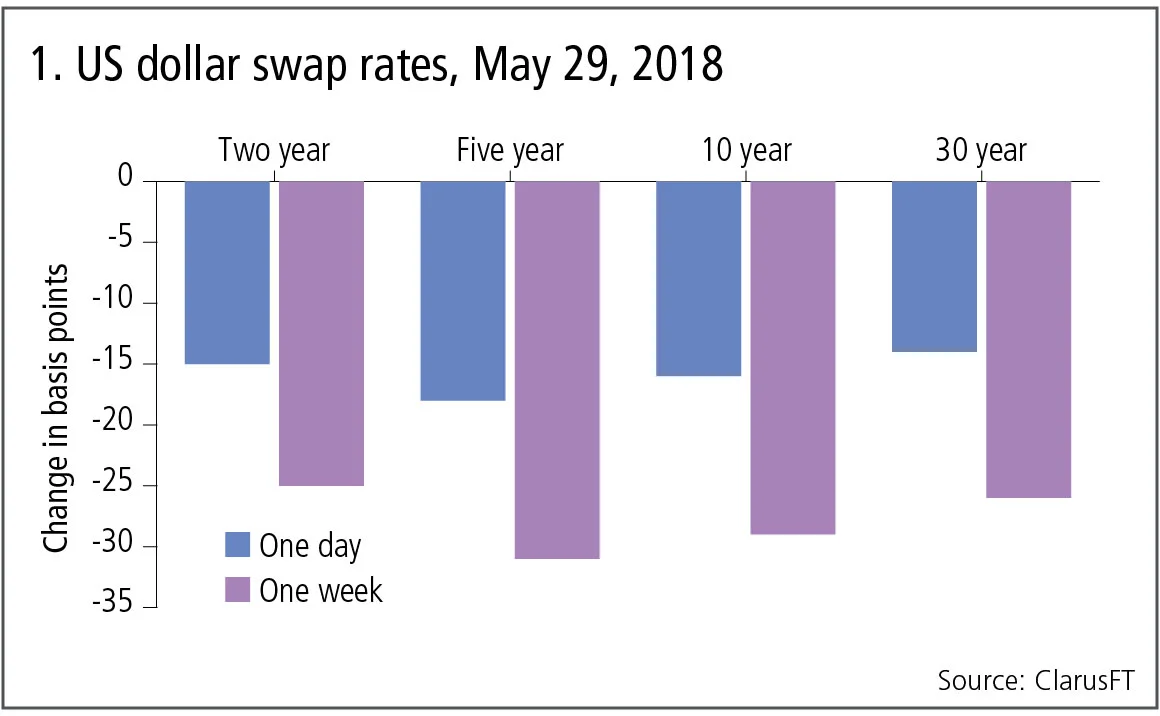
Figure 1 shows:
- Large one-day and one-week falls in swap rates for each major tenor – as a basis for comparison, daily moves are generally less than 2–3bp.
- Five-year swap rates down a massive 18bp at the close on Tuesday from the prior business day and down 31bp over one week.
- Two-year, 10-year and 30-year swap rates with similar drops.
Trade volumes on May 29
Stats from US swap data repositories (SDRs) allows us to build a picture of volume in vanilla spot starting swaps on this volatile day.
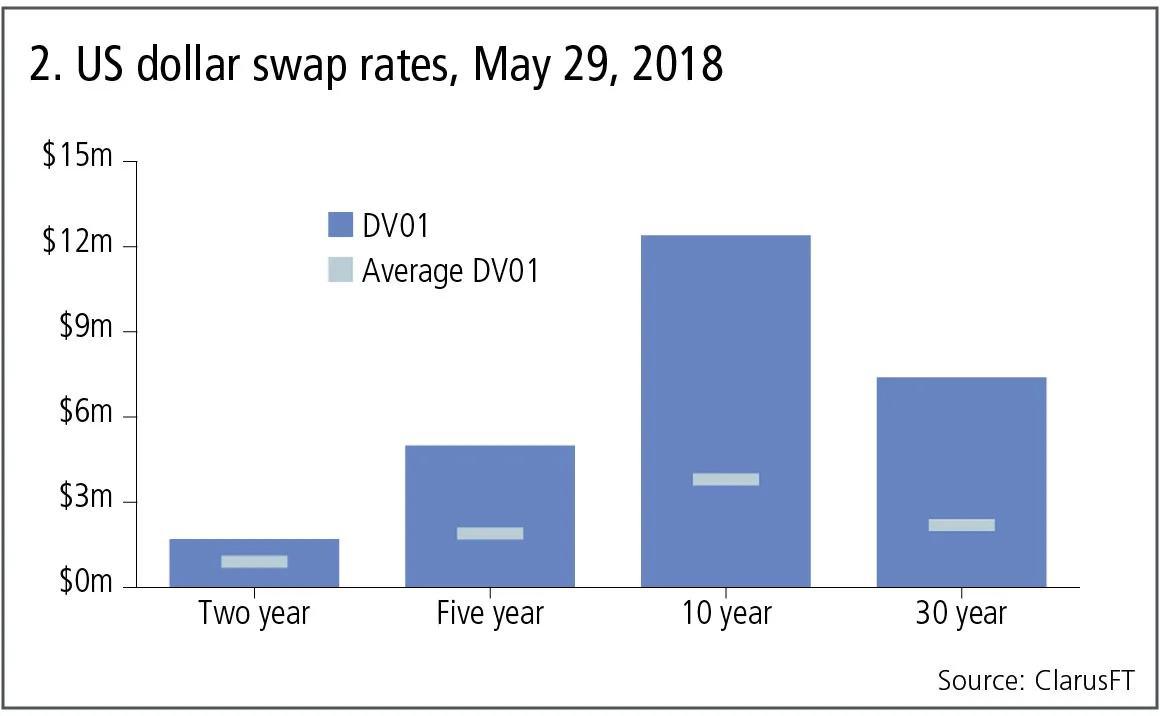
Figure 2 shows:
- Ten-year swap volume was over $12 million DV01 or greater than $14 billion notional, which is over three times the daily average.
- Thirty-year swap volume at $7 million DV01 was also over three times average.
- Two-year and five-year swaps both with elevated volumes.
Drilling down into the 10-year tenor, we can see the intra-day prices of the 240 trades reported by US entities that constitute the $12 million DV01.
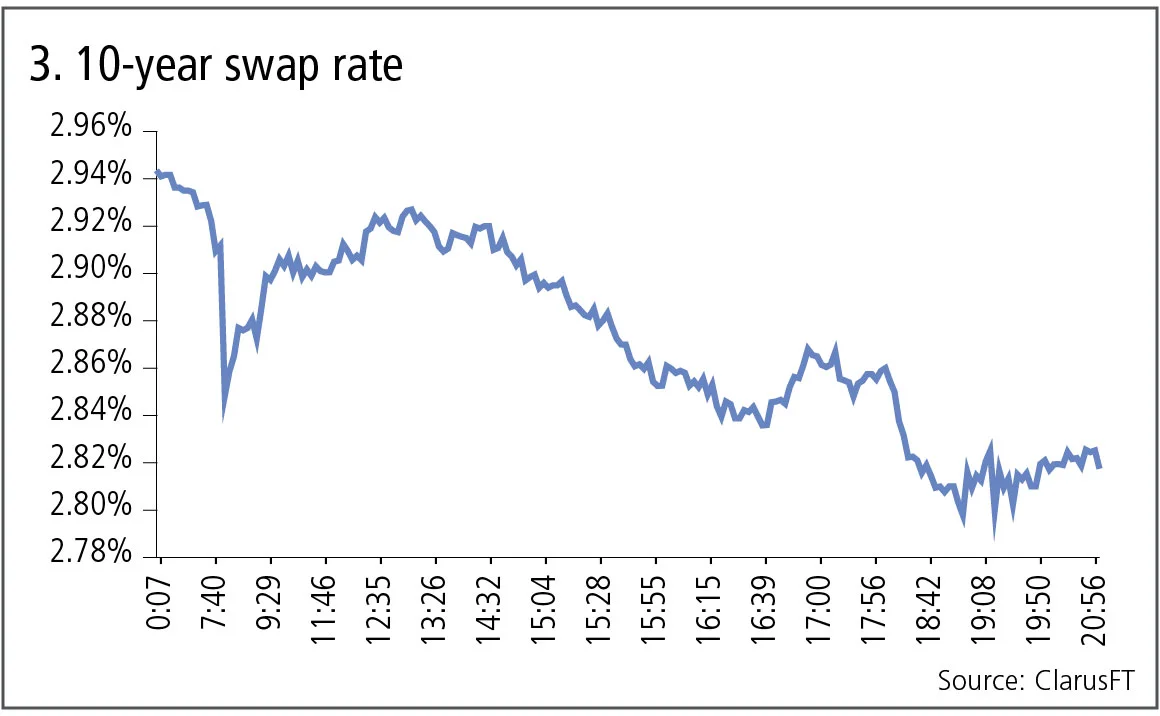
Figure 3 shows:
- Rates dropping sharply at the London market open to 2.85%.
- Back up to 2.92% for the start of the day in New York.
- Falling steadily in New York morning, back down to 2.85%.
- Rallying 3bp up for a two-hour period.
- Then falling again to just below 2.8%, before drifting up to 2.82%.
From Friday’s close, 10-year swap rates were down 16bp at the end of Tuesday, a tumultuous trading day.
Subsequent days
Frequently, after a shock in any market, prices snap back on subsequent days, as participants digest news and politicians or central bankers make policy statements – and this is what happened on this occasion.
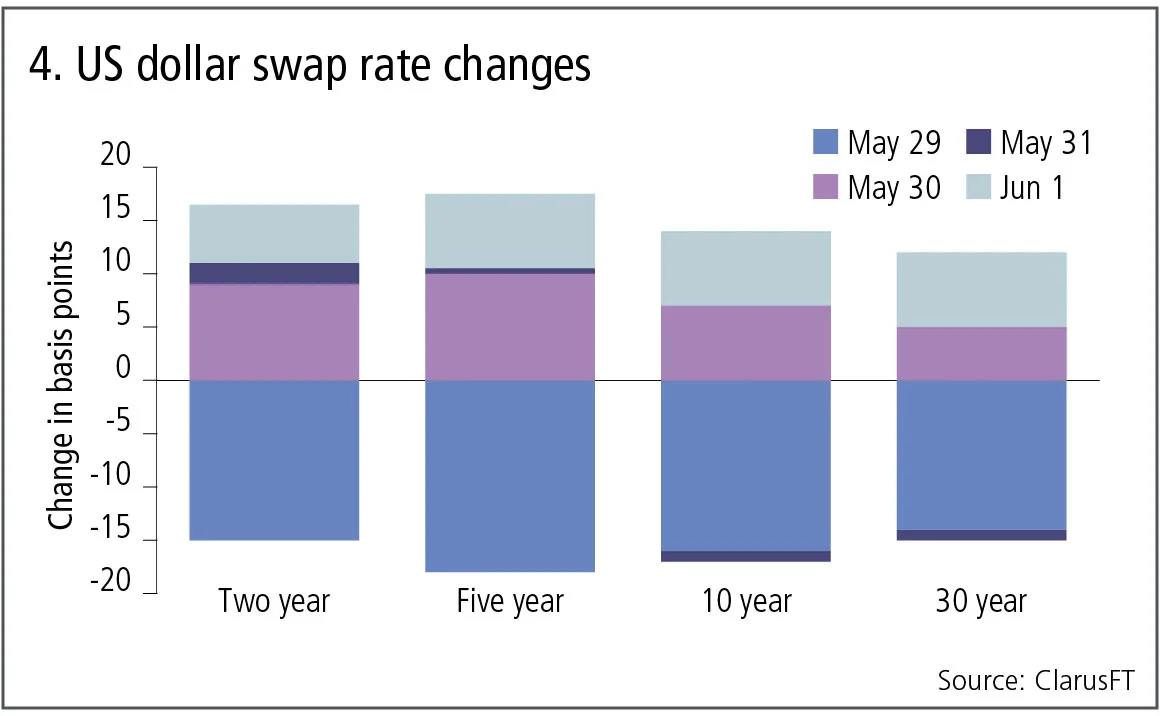
Figure 4 shows:
- After May 29, rates recovered by the end of the week.
- Five-year swap rates – having dropped 18bp – were up 10bp, 0.5bp and 7bp on the three subsequent days to end the week just 0.5bp down.
- A similar pattern for two-year, 10-year and 30-year rates.
In fact, this recovery meant the swap curve was down 5bp in May, compared with a rise of 18bp in April and the 10-year and 30-year benchmarks once again below the significant 3% level.
Let’s also look at volumes on these three days.
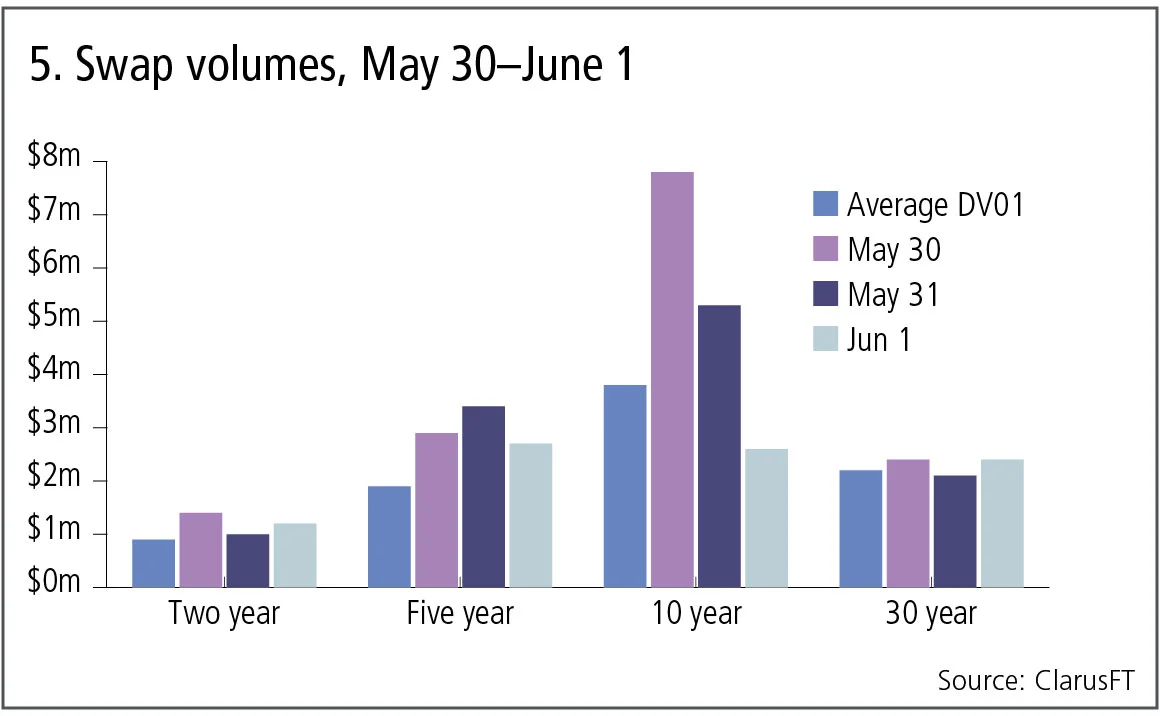
Figure 5 shows:
- Daily average DV01 in millions compared with the actual figure on May 30, May 31 and Jun 1.
- Generally volume was back down to the average for most tenors and days.
- Except for 10-year, which saw twice the average volume on May 30 and almost twice again on May 31, before a lower-than-average day on Jun 1.
Post-trade over-the-counter derivatives data at the transaction level means we can analyse the prices and volume of trades on any tenor and each business day – and can do so, not only the day after it happens, but also during a trading day. Such insight is now part and parcel of trading in swap markets.
Fed rate expectations
The prices of federal funds and overnight index swaps allow us to back out the market’s expectations of rate rises and how these changed over this one-week period. The market assigned a 95% probability on May 21 to a 25bp rate rise at the June 12–13 Federal Open Market Committee meeting, which dropped to a 72% probability on May 29 and then up to 78% probability on June 1. So, a hike is still seen as likely to happen, but it is now less likely than before.
Other markets
We know many other markets saw huge volumes on May 29, with CME reporting a record 39.6 million interest rate contracts traded, almost 50% higher than the previous record on Nov 9, 2016, the day after the US election. Further, CME reports six of its 10 highest-volume days have occurred during 2018.
Market volatility and volume is indeed back with a vengeance in 2018.
Amir Khwaja is chief executive of Clarus Financial Technology.
Only users who have a paid subscription or are part of a corporate subscription are able to print or copy content.
To access these options, along with all other subscription benefits, please contact info@risk.net or view our subscription options here: http://subscriptions.risk.net/subscribe
You are currently unable to print this content. Please contact info@risk.net to find out more.
You are currently unable to copy this content. Please contact info@risk.net to find out more.
Copyright Infopro Digital Limited. All rights reserved.
As outlined in our terms and conditions, https://www.infopro-digital.com/terms-and-conditions/subscriptions/ (point 2.4), printing is limited to a single copy.
If you would like to purchase additional rights please email info@risk.net
Copyright Infopro Digital Limited. All rights reserved.
You may share this content using our article tools. As outlined in our terms and conditions, https://www.infopro-digital.com/terms-and-conditions/subscriptions/ (clause 2.4), an Authorised User may only make one copy of the materials for their own personal use. You must also comply with the restrictions in clause 2.5.
If you would like to purchase additional rights please email info@risk.net
More on Comment
Podcast: Abi-Jaber and Li on a ‘sticky’ volatility problem
The pair discuss their model to jointly capture Vix, SPX and SSR

Markets perceive the future in very distorted ways
Discounting paradigms should adapt to be more realistic, says Jean-Philippe Bouchaud

Op risk data: Cyber hacks shake crypto protocols
Also: JP Morgan fined over investor losses; Symetra’s Methodist pensions mess. Data by ORX News

Prediction markets can be a canary in the coal mine
Prices of contracts on the likes of Polymarket can act as signals for risk management and hedging, says risk expert

How AI agents can join the dots for risk managers
Citi risk expert outlines agentic AI tool that would pull together structured and unstructured data on trading and lending approvals to create single, unified view of risk

Op risk data: Corporate spies spell trouble for BBVA
Also: BofA buttonholed for alleged Epstein links; minority shareholders take a bite of Brookfield. Data by ORX News

The rise of AI politics
AI should not be treated as just another technology, writes MAS adviser David Hardoon

AI risk management and the shift to capability control
By reframing validation, banks can align innovation with regulatory demands and maintain robust risk discipline, argues risk manager
