
Swaps data: the allure of liquidity
Liquidity in OTC trading concentrates at one venue, or splits across three, writes Amir Khwaja of Clarus FT

It’s often said that clearing is a business that naturally tends to monopoly. The primary burden for most users is the funding cost generated by margin calls, so bigger central counterparties – that are able to reduce margin demands via netting – will attract more business.
That’s the theory, and it seems to hold true in practice, as an earlier column showed.
But what about trading? A similar argument could be made here – liquidity is a force that exerts a strong gravitational pull, with bigger venues crowding out smaller ones.
This month, I look at market share by venue for different over-the-counter derivatives products. In some cases, there is a single, dominant player; in others, liquidity tends to be split across three competitors.
Credit index
Let’s start with credit index swap (CDX and iTraxx) volumes at swap execution facilities (Sefs). US persons are required to trade these products on these venues, which are regulated by the Commodity Futures Trading Commission.
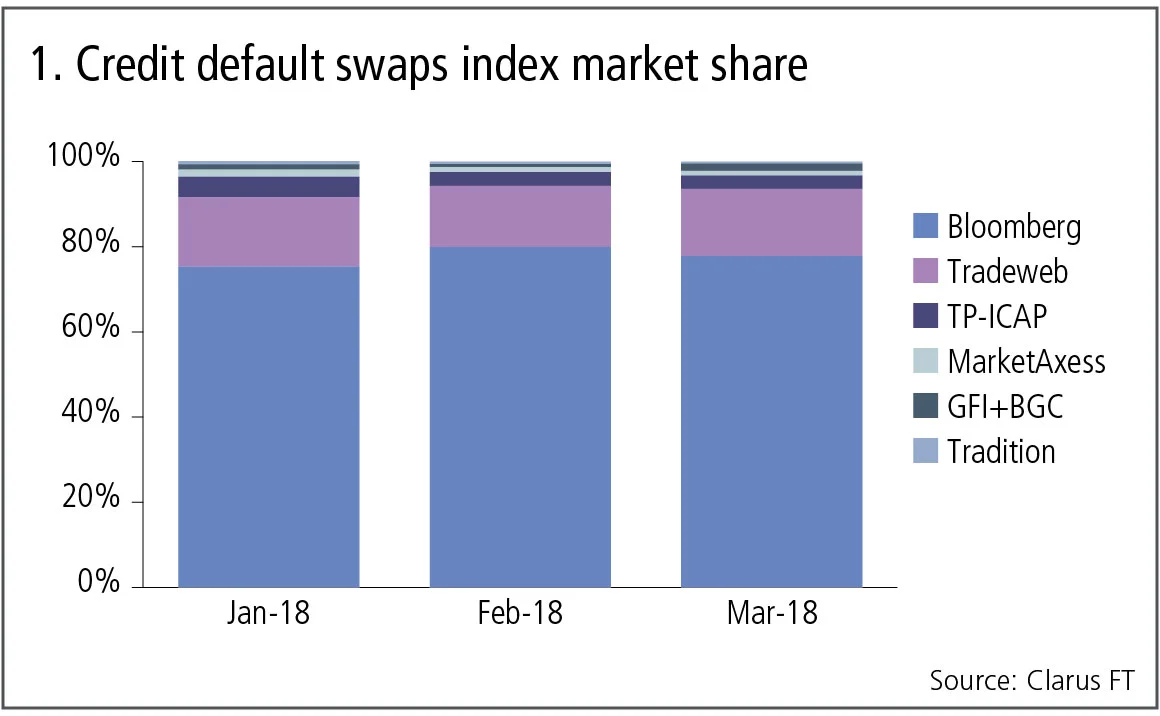
Figure 1 shows:
- Bloomberg dominates market share with a 78% average in Q1 2018.
- Tradeweb has 15%, with the other venues a long way behind.
For this product, execution volumes are highly concentrated and similar to the dominant clearing concentration of CDS indexes at Ice Clear Credit.
Non-deliverable forwards
Next let’s look at non-deliverable forward (NDF) volumes at Sefs, a product that has moved decisively from bilateral to cleared.
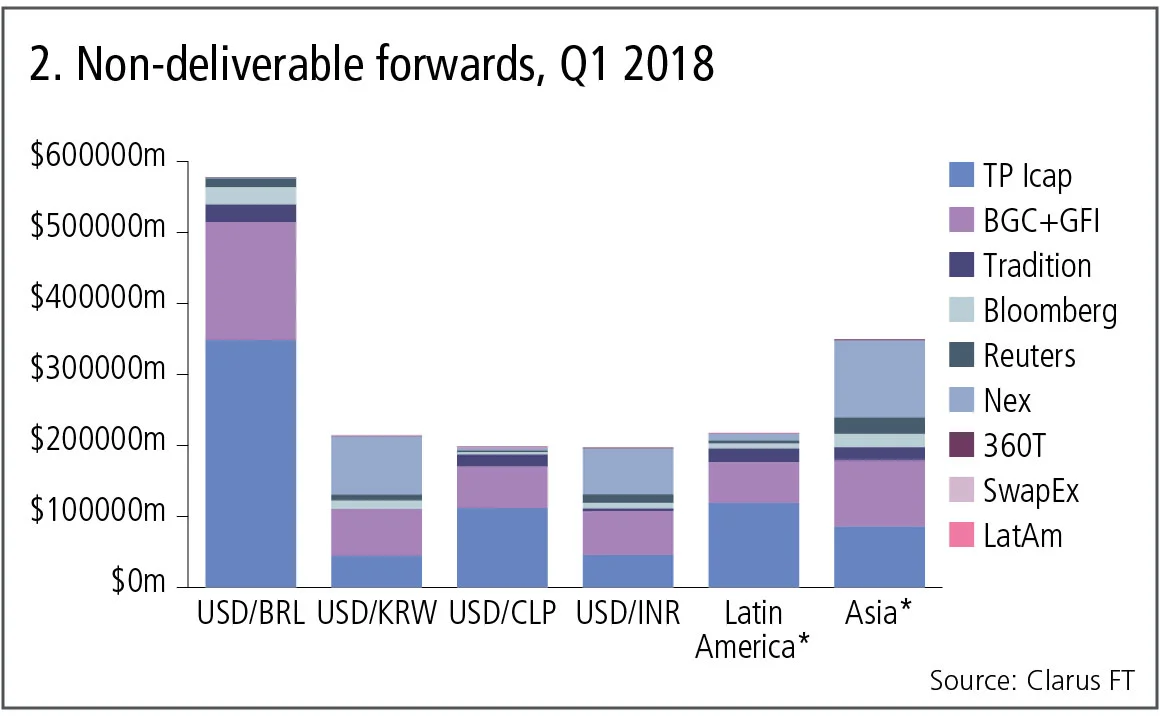
Figure 2 shows:
- US dollar/Brazilian real is by far the largest currency pair with $575 billion traded in the quarter. TP Icap dominates with a 60% share, as it does in US dollar/Chilean peso and other Latin American currency pairs.
- US dollar/Korean won and US dollar/Indian rupee are much more evenly shared with Nex, BGC/GFI and TP Icap, as are the other Asian currency pairs.
In all then, there is more diversity for NDFs, with Latin American currency pairs exhibiting significant liquidity concentration at one execution venue, while Asian pairs are split between three competing venues.
Forex options
Foreign exchange options are the next big product that clearing houses are targeting in 2018, so let’s again turn to Sef volumes for the largest currency pairs.
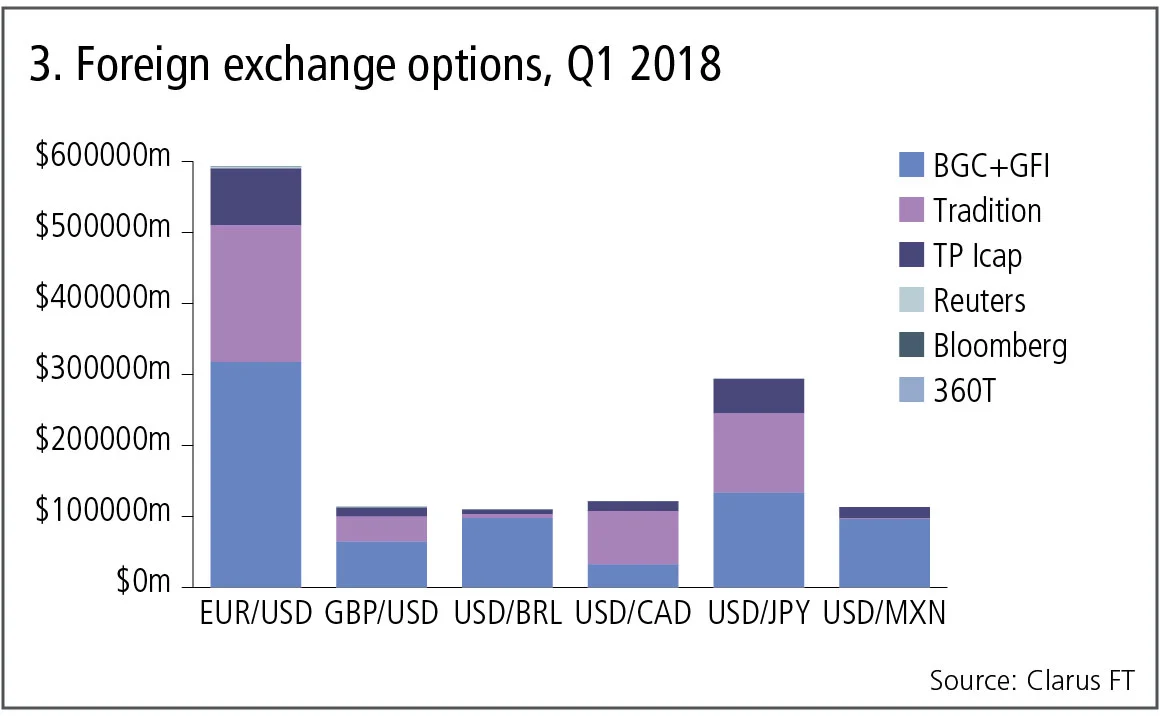
Figure 3 shows:
- Euro/US dollar is by far the largest currency pair with $600 billion traded in the quarter. Market share is split between BGC/GFI with 54%, Tradition 33% and TP Icap 13%.
- US dollar/yen shows a similar split but is slightly more even.
- US dollar/Brazilian real and US dollar/Mexican peso are dominated by BGC/GFI.
- US dollar/Canadian dollar is dominated by Tradition.
- BGC/GFI has the lion’s share of trading in sterling/US dollar.
Broadly, the picture for options is similar to that for NDFs, with some currency pairs highly concentrated at one execution venue, while others are split between three competing venues.
Interest rate swaps
Next let’s turn to the largest product, interest rate swaps.
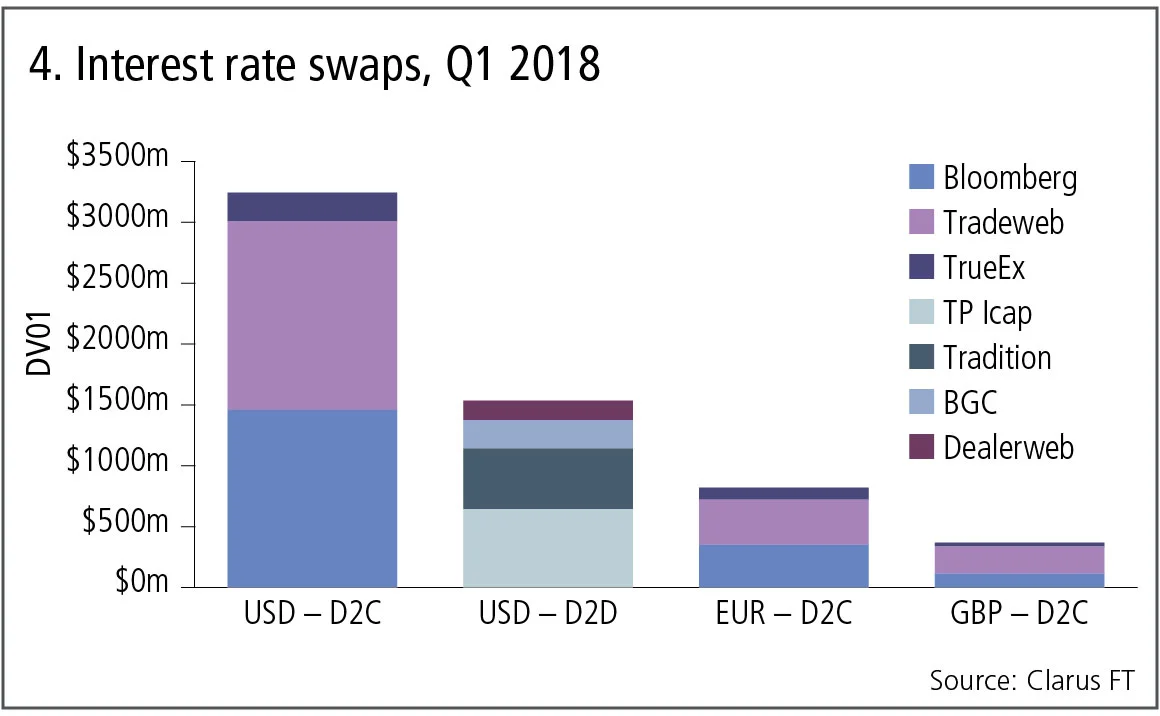
Figure 4 shows:
- US dollar interest rate swaps at dealer-to-client Sefs is the largest market, at $3 billion in DV01 or $6 trillion in gross notional, with market share evenly split between Bloomberg and Tradeweb.
- US dollar swaps at dealer-to-dealer Sefs adds up to $1.5 billion in DV01, where TP-Icap has 42% and Tradition has 32%.
- For euro and sterling interest rate swaps in the dealer-to-client segment, Tradeweb is ahead of Bloomberg, but significant chunks of the business is non-price forming list trading.
Turning next to non-US dollar interest rate swaps in the dealer-to-dealer venues.
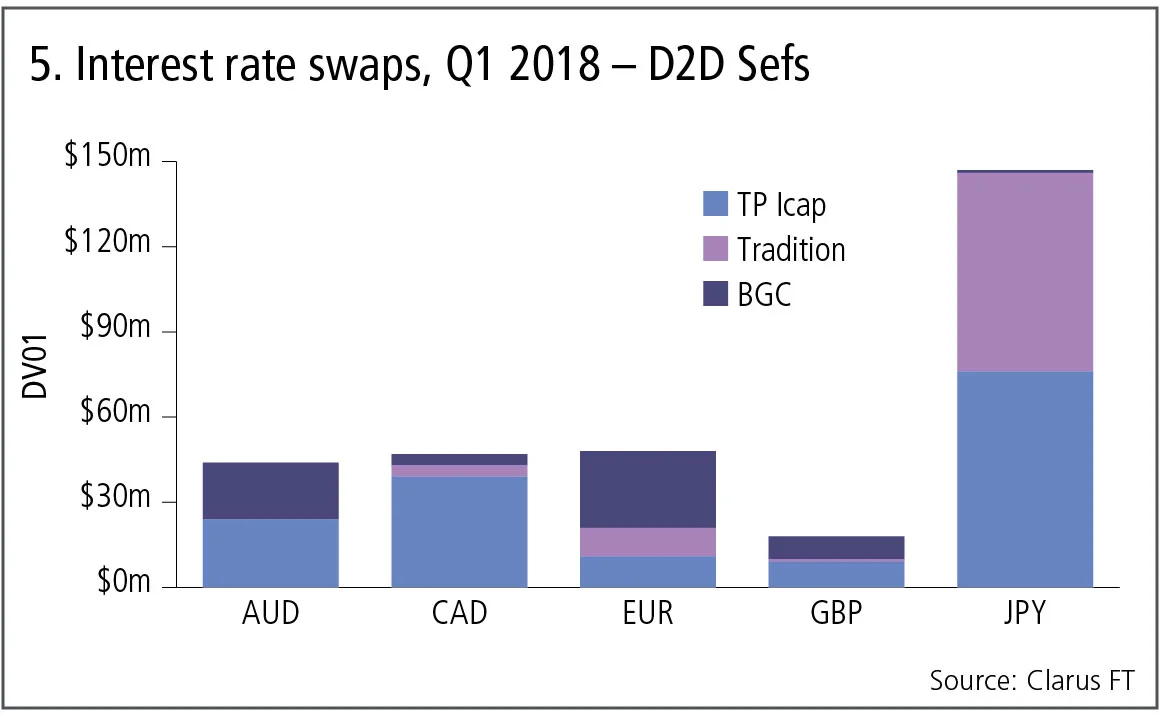
Figure 5 shows:
- Volumes are much lower here. Even yen interest rate swaps, as the largest, is only $150 million in DV01.
- TP Icap is the largest in Australian and Canadian dollars.
- Sterling and yen is split between two venues.
- BGC is the largest in euros.
- Euro swap volumes are just $50 million in DV01 or $75 billion gross notional, a small fraction of the US dollar interest rate swap volume.
Clearly very little interdealer trading of euro swaps takes place on US Sefs.
Europe and MTFs
For that, we need to turn to Europe, and the equivalent of Sefs, namely multilateral and organised trading facilities (MTFs and OTFs).
Unfortunately, as discussed in last month’s swap data review, four months after the implementation of new post-trade transparency rules in the Markets in Financial Instruments Directive, it remains a massively complex task to answer even the simple question of the market share split for euro interest rate swaps.
Today, all I can point to is Bloomberg MTF, one of the largest venues, which has been exemplary in publishing post-trade transparency data and making it public in a simple, machine-readable format.
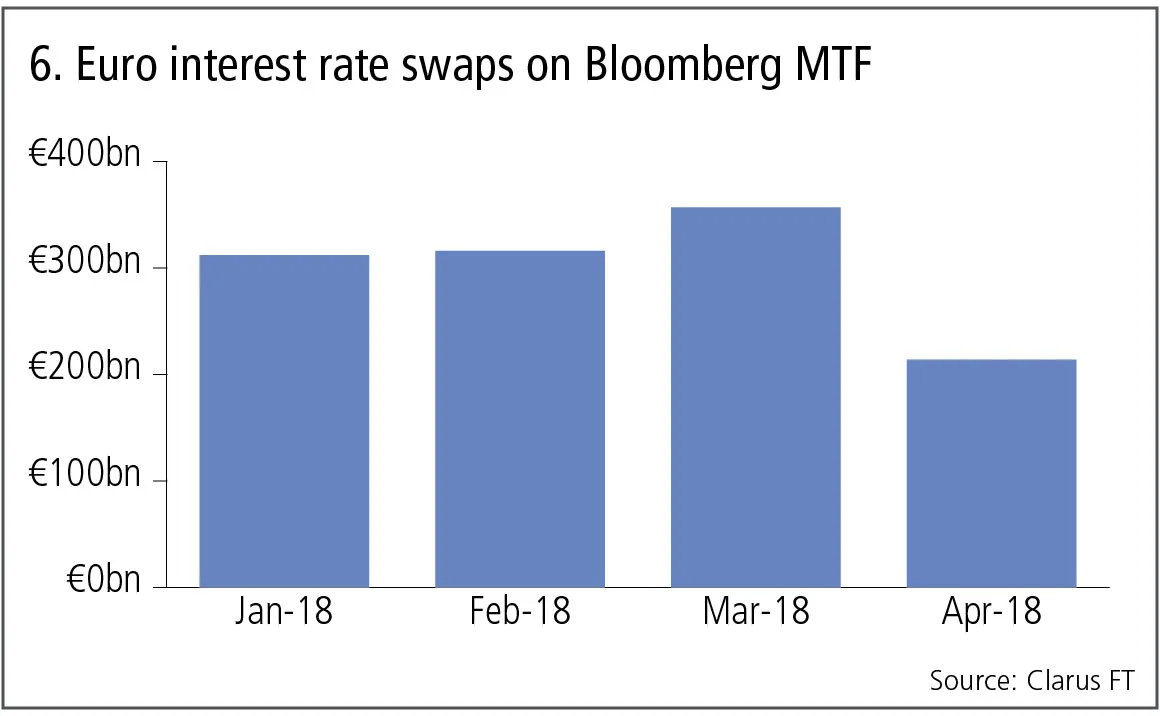
Figure 6 shows:
- Just over €300 billion gross notional was traded in each of the first two months.
- In March, volumes hit €360 billion.
- April appears low, but that is a result of four-week deferral rules that are currently in place, meaning we need to wait to see the full volume.
I can only hope that, when I write this column in a year’s time, the situation has changed. It would be a colossal waste of effort, money and regulation if it remains impossible to produce a simple chart of swaps market share.
Amir Khwaja is chief executive of Clarus Financial Technology.
Only users who have a paid subscription or are part of a corporate subscription are able to print or copy content.
To access these options, along with all other subscription benefits, please contact info@risk.net or view our subscription options here: http://subscriptions.risk.net/subscribe
You are currently unable to print this content. Please contact info@risk.net to find out more.
You are currently unable to copy this content. Please contact info@risk.net to find out more.
Copyright Infopro Digital Limited. All rights reserved.
As outlined in our terms and conditions, https://www.infopro-digital.com/terms-and-conditions/subscriptions/ (point 2.4), printing is limited to a single copy.
If you would like to purchase additional rights please email info@risk.net
Copyright Infopro Digital Limited. All rights reserved.
You may share this content using our article tools. As outlined in our terms and conditions, https://www.infopro-digital.com/terms-and-conditions/subscriptions/ (clause 2.4), an Authorised User may only make one copy of the materials for their own personal use. You must also comply with the restrictions in clause 2.5.
If you would like to purchase additional rights please email info@risk.net
More on Comment
G-Sib capital surcharge: how indexing and averaging alter incentives
Capital risk strategist anticipates Basel III endgame impact on US big-bank behaviour

Podcast: Abi-Jaber and Li on a ‘sticky’ volatility problem
The pair discuss their model to jointly capture Vix, SPX and SSR

Markets perceive the future in very distorted ways
Discounting paradigms should adapt to be more realistic, says Jean-Philippe Bouchaud

Op risk data: Cyber hacks shake crypto protocols
Also: JP Morgan fined over investor losses; Symetra’s Methodist pensions mess. Data by ORX News

Prediction markets can be a canary in the coal mine
Prices of contracts on the likes of Polymarket can act as signals for risk management and hedging, says risk expert

How AI agents can join the dots for risk managers
Citi risk expert outlines agentic AI tool that would pull together structured and unstructured data on trading and lending approvals to create single, unified view of risk

Op risk data: Corporate spies spell trouble for BBVA
Also: BofA buttonholed for alleged Epstein links; minority shareholders take a bite of Brookfield. Data by ORX News

The rise of AI politics
AI should not be treated as just another technology, writes MAS adviser David Hardoon
