
Credit data: US slowdown starts to bite for high yield
Credit quality in the US is turning, while the UK is sliding sharply, writes David Carruthers

US economic growth has slowed down during 2019, coming in at 1.9% in the third quarter, compared with 3.1% in the first quarter. The decline is starting to be reflected in corporate credit quality as well. The creditworthiness of US high-yield corporates has declined by 3% since the start of 2019, while investment-grade corporates are flatlining.
That’s still a stronger performance than in the UK, where investment-grade and high-yield credit quality is in negative territory – investment-grade credit quality has fallen by around 5% since the end of 2018. Even the top 100 companies, which had been relatively resilient, have now started to slide since the second quarter.
This decline is unsurprising, as the economy in the UK is much more challenged than in the US. UK economic output fell 0.2% in the second quarter of 2019, the first such decline since the fourth quarter of 2012. As the third quarter was overshadowed by fears over the possibility of a no-deal Brexit and the final quarter of the year will now be dominated by the uncertainty of a general election campaign, it seems unlikely the economy will recover during the second half of 2019.
Recent high-profile bankruptcies at Thomas Cook and Mothercare have highlighted the weakness of retail-related sectors in the UK in particular. UK names are relatively heavily represented in Credit Benchmark’s numbers, so its deterioration is also reflected in global numbers – 23 consumer goods and 47 consumer services companies have suffered recent downgrades in the credit estimates compiled by banks.
Only a few sectors globally, such as healthcare, telecommunications and oil and gas have enjoyed upticks in creditworthiness in recent months. However, even the improvement in oil and gas masks diverging fortunes for different business models. Although oil prices have recovered somewhat since the start of the year, when US WTI crude dipped toward $40 per barrel, they are still as little as half the peaks of more than $100 dollars seen in 2014. Given the time lag to complete projects, some production coming online now may no longer make economic sense. This is reflected in the weaker performance for US-based exploration and production companies, compared with integrated oil and gas models.
Coupled with the slowdown in the US and UK, the trends in the eurozone and China point to a weaker global economic outlook going into 2020, all of which makes more speculative “growth company” investments look a less appetising prospect. Banks’ credit risk assessments on companies generating poor returns are turning sharply negative, reflecting that switch to companies with more dependable earnings profiles.
Global credit industry trends
The latest consensus credit data shows that credit activity for corporates and financials has slightly increased, with 4.8% of entities moving by at least one notch, in comparison to 4.0% last month. Figure 1 shows detailed industry migration trends for the most recent published data, adjusted for changes in contributor mix.
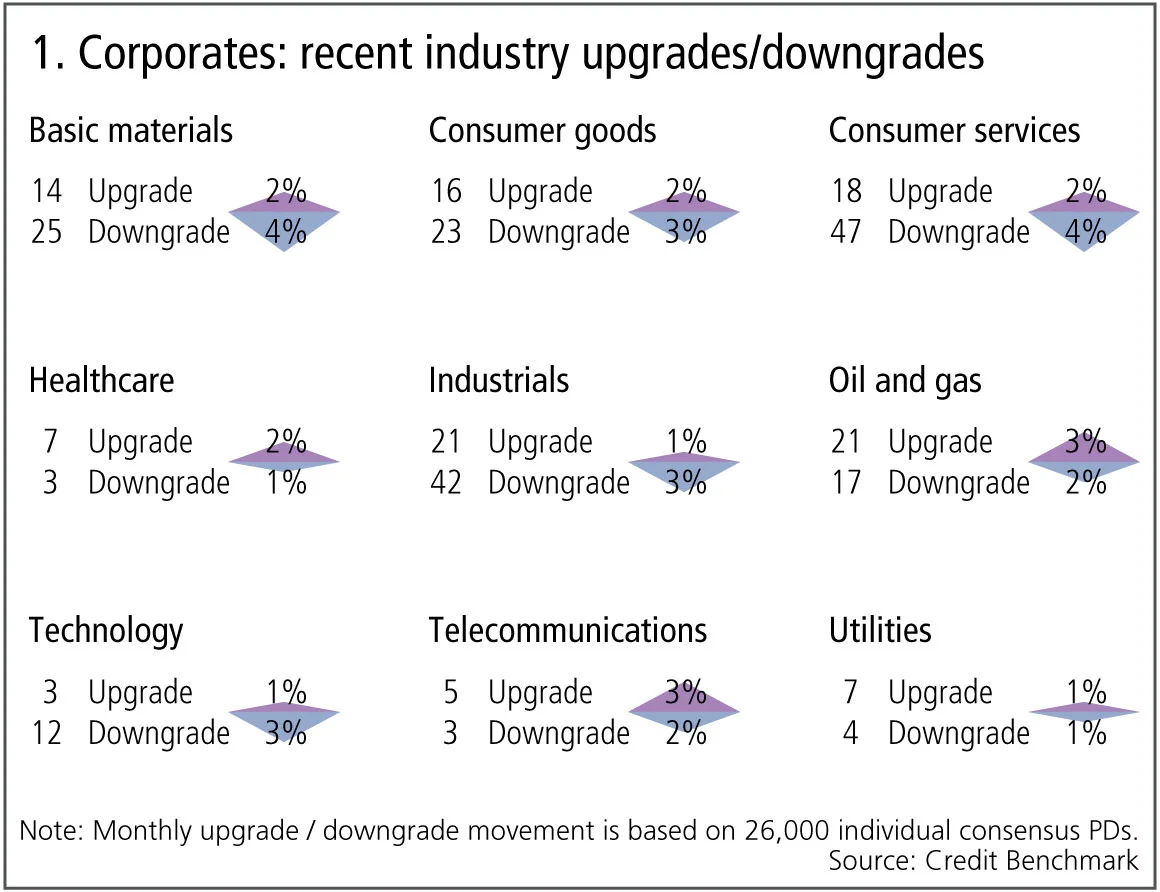
Figure 1 shows:
- Globally, the number of corporate downgrades outnumber upgrades.
- Upgrades outnumber downgrades in three of the nine industries, five industries are biased towards downgrades and one is in balance.
- Consumer goods and technology continue to see downgrades outweighing upgrades for a second month.
- Industrials has more downgrades than upgrades for the third month.
- Consumer services and basic materials return to downgrades outnumbering upgrades.
- Oil and gas and telecommunications continue to see upgrades outweigh downgrades for the second month.
- Healthcare sees more upgrades than downgrades after five months of downgrades dominating.
- Utilities is in balance for the third month.
North America oil and gas
In credit terms, the North American oil and gas industry has been on a rollercoaster over the past few years. Shale oil has changed the industry dynamics, but the North American oil and gas subsectors have usually shown very similar credit trends. This seems to be changing, with some important divergences appearing. Figure 2 shows the credit trend and distribution of 250 North American exploration and production and 160 North American integrated oil and gas companies.
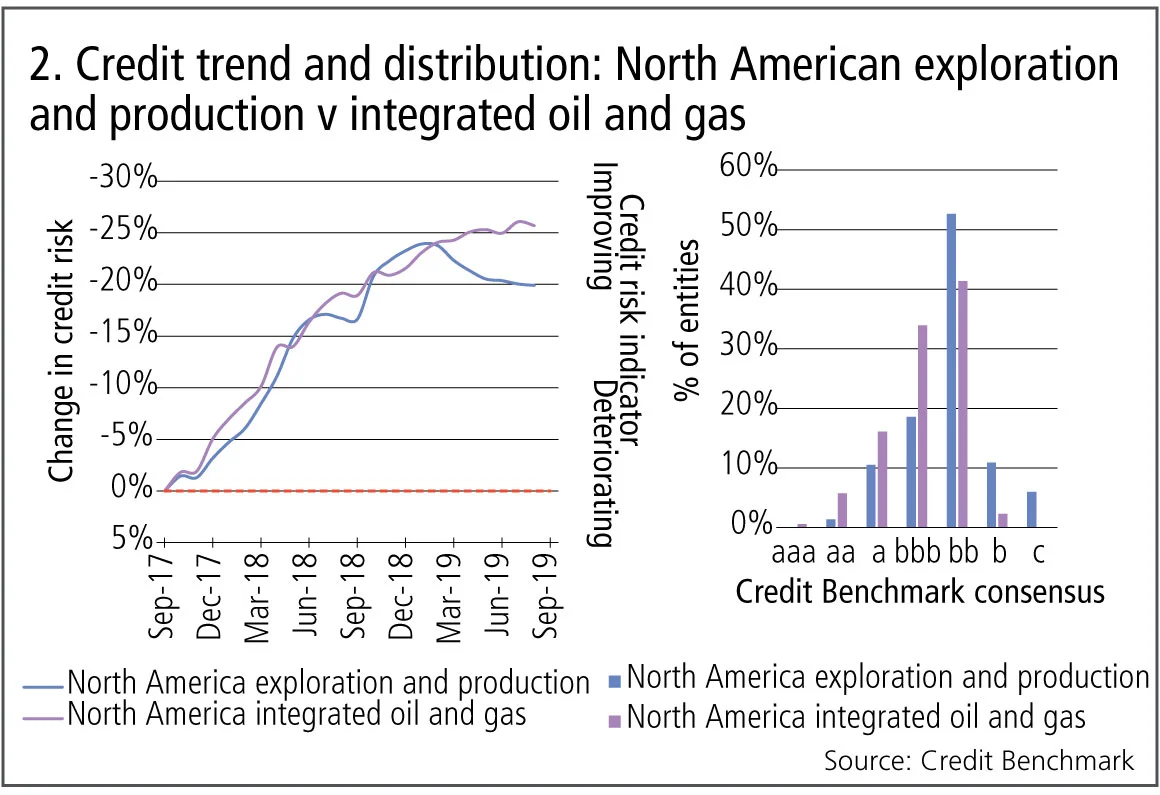
Figure 2 shows:
- The credit trends of North American exploration and production companies and integrated oil and gas companies were more or less identical from late 2017 to the end of 2018, both showing an improvement of nearly 25%.
- Since the beginning of 2019, integrated oil and gas has continued to improve, albeit at a slower rate. However, the trend for the exploration and production sector has turned with credit risk increasing, up 5% year-to-date.
- The majority of exploration and production companies, nearly 70%, are non-investment grade. In comparison, less than half (44%) of integrated oil and gas companies are non-investment grade.
UK top 100
Since the 2016 referendum on EU membership, there has been a distinct divergence in credit trends for the largest UK companies – many of which are heavy US dollar earners, and can be proxied by the FTSE 100 index – compared with those with a more European or domestic focus. For the past few years, most UK corporate credit aggregates have shown a steady decline; but the aggregate for the top 100 has generally been improving. However, recent months show an ominous change. Figure 3 shows the credit trend and distribution of the UK top 100 companies.

Figure 3 shows:
- The top 100 UK companies showed a sharp deterioration at the beginning of 2016. They bottomed out in summer 2016 with an improving trend over the next two years.
- This stalled in H2 2018, following a net 10% improvement from the end 2015 level.
- Recent data shows a renewed deterioration suggesting that this group of companies may have already passed a credit turning point.
- Over 90% of the UK top 100 companies have a Credit Benchmark consensus of a or bbb. There are no companies that have a credit category of b or worse.
Value versus growth: credit risk and earnings yield
As this year’s string of failed or pulled IPOs demonstrates, investors are turning their backs on overvalued growth companies that focus on revenue instead of profit.
And after years of lacklustre equity returns, the value stocks have seen a return to favour.
Figure 4 plots the credit data for 1,246 US corporate borrowers, split into three valuation categories based on earnings yield.
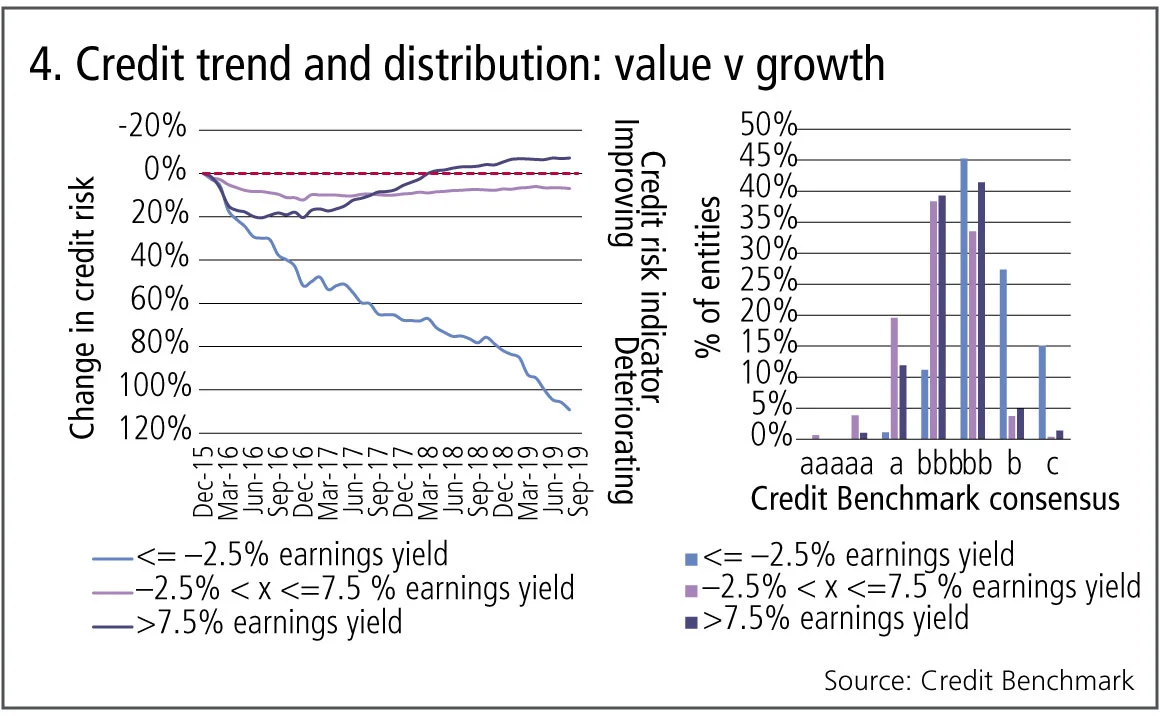
Figure 4 shows:
- The best value companies, with earnings yield of more than 7.5%, are clustered in the bbb and bb categories. Expensive companies with earnings yield of less than –2.5% are clustered in the bb and b categories, with a significant proportion in the c category.
- Those in between (earnings yield of –2.5% to +7.5%) are also clustered in the bbb and bb categories, with a significant proportion in the a category.
- Overall, two thirds of companies with earnings yield between –2.5% and 7.5% are investment grade; nearly 90% of US corporates with earnings yield below –2.5% are non-investment grade.
- Credit risk in the most expensive companies shows an unprecedented level of deterioration, more than doubling in the past three years.
- After a deterioration in 2016, the least expensive companies have shown a modest credit improvement over the past two and a half years.
UK v US corporates by credit category
Credit risk for US corporates showed a steady improvement after the Trump tax cuts, but recent data shows this effect is tailing off and in some credit categories has already turned negative. The negative impact of Brexit-related uncertainty on UK credit risk is now well known, but the decline is not uniform across credit categories. Figure 5 shows recent credit trends of 1,500 and 1,000 UK and US corporates, with credit category IGb (the lower segment of the investment-grade category), respectively, as well as 3,000 and 1,500 UK and US corporates with credit category HYb (the upper segment of the high-yield category), respectively.
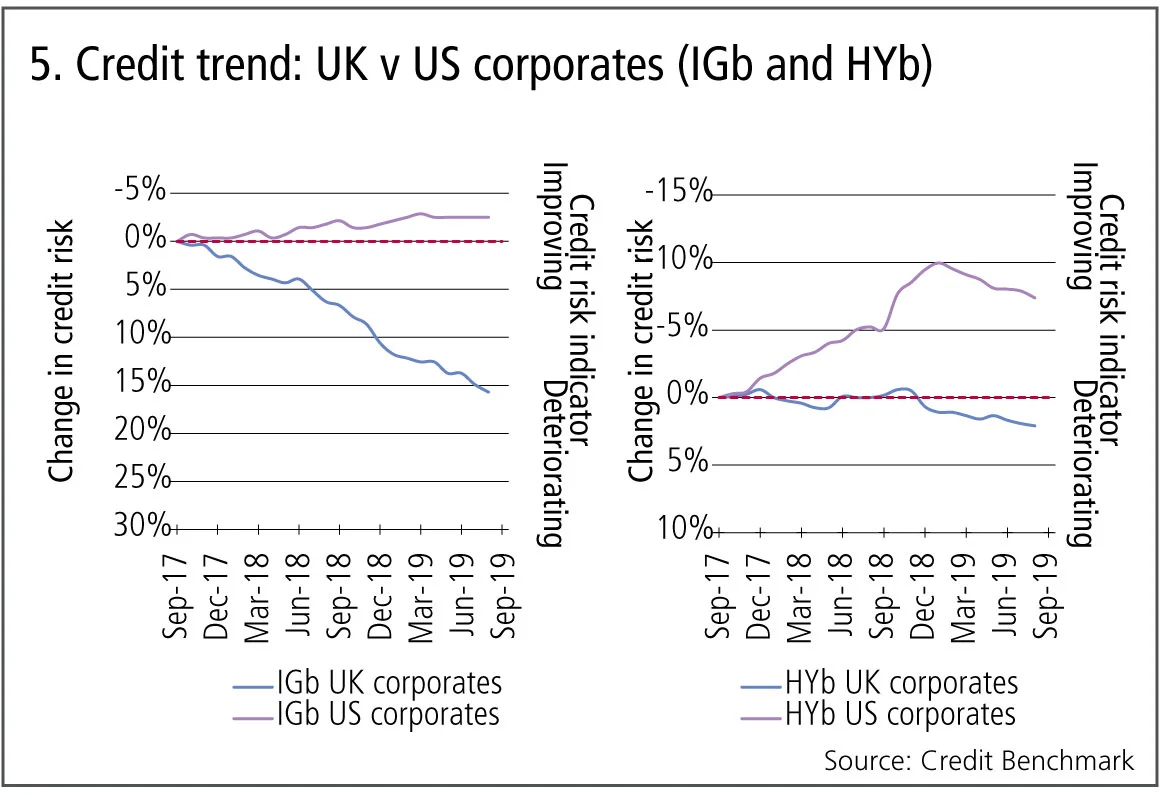
Figure 5 shows:
- Since Q4 2017, IGb US corporates have seen a steady improvement of 3% in terms of credit risk. In comparison, IGb UK corporates credit risk has deteriorated by 16%.
- In the HYb category, UK corporate credit risk was stable until late 2018; HYb US corporates improved by 9% over the same period.
- HYb UK corporates credit risk started a modest deterioration from late 2018.
- The recent deterioration in HYb US corporates began a few months later, in early 2019, and has so far increased by nearly 3%.
- The deterioration in HYb US corporates began a few months later, in early 2019, with credit risk increasing by nearly 3% since the beginning of the year.
About this data
Credit Benchmark collects monthly credit risk inputs from 40-plus of the world’s leading financial institutions, making it possible to follow credit trends across geographies and industries. In all, the dataset contains consensus ratings on about 50,000 rated and unrated entities globally.
David Carruthers is head of research at Credit Benchmark.
Only users who have a paid subscription or are part of a corporate subscription are able to print or copy content.
To access these options, along with all other subscription benefits, please contact info@risk.net or view our subscription options here: http://subscriptions.risk.net/subscribe
You are currently unable to print this content. Please contact info@risk.net to find out more.
You are currently unable to copy this content. Please contact info@risk.net to find out more.
Copyright Infopro Digital Limited. All rights reserved.
As outlined in our terms and conditions, https://www.infopro-digital.com/terms-and-conditions/subscriptions/ (point 2.4), printing is limited to a single copy.
If you would like to purchase additional rights please email info@risk.net
Copyright Infopro Digital Limited. All rights reserved.
You may share this content using our article tools. As outlined in our terms and conditions, https://www.infopro-digital.com/terms-and-conditions/subscriptions/ (clause 2.4), an Authorised User may only make one copy of the materials for their own personal use. You must also comply with the restrictions in clause 2.5.
If you would like to purchase additional rights please email info@risk.net
More on Comment
Op risk data: HSBC hit with $400m external fraud loss
Also: China’s unlicensed trading clampdown; SocGen’s insurance mis-selling woes. Data by ORX News

Vinicius fortune: quantifying luck in the World Cup draw
Julien Guyon explains how bias, variance and luck affect teams in this summer’s tournament – and explores wider relevance for portfolio managers

G-Sib capital surcharge: how indexing and averaging alter incentives
Capital risk strategist anticipates Basel III endgame impact on US big-bank behaviour

Podcast: Abi-Jaber and Li on a ‘sticky’ volatility problem
The pair discuss their model to jointly capture Vix, SPX and SSR

Markets perceive the future in very distorted ways
Discounting paradigms should adapt to be more realistic, says Jean-Philippe Bouchaud

Op risk data: Cyber hacks shake crypto protocols
Also: JP Morgan fined over investor losses; Symetra’s Methodist pensions mess. Data by ORX News

Prediction markets can be a canary in the coal mine
Prices of contracts on the likes of Polymarket can act as signals for risk management and hedging, says risk expert

How AI agents can join the dots for risk managers
Citi risk expert outlines agentic AI tool that would pull together structured and unstructured data on trading and lending approvals to create single, unified view of risk
