
Swaps data: IM grows in listed and OTC markets
Data shows fourth-quarter jump in IM across all product groups and after-effects of Nasdaq losses

The fourth quarter of 2018 was a time for soul searching at the world’s largest clearing houses, as margin models were called into question in the wake of a €114 million ($127.6 billion) loss at Nasdaq Commodities.
A new set of quantitative disclosures from the Committee on Payments and Market Infrastructures and International Organization of Securities Commissions hint at the extreme energy moves that triggered the losses – perhaps most evident in Ice Futures Europe’s eighteen-fold year-on-year jump in credit exposure to a single participant.
The figures show a clear increase in initial margin backing all major product groups – both over-the-counter and listed derivatives – in the 12 months leading up to the end of December.
Cleared interest rate swaps consumed 9% more IM than a year previously. LCH continued to dominate with $137 billion of interest rate swaps margin – up 16%. But momentum was firmly behind Eurex, where IRS margin jumped by 40% – driven perhaps by Brexit-related transfers. There is no sign of LCH’s crown being taken any time soon though, as the Frankfurt-based clearer had just $5 billion of initial margin backing cleared interest rate swaps.
There are many factors at play. In OTC markets, more players were incentivised to clear their derivatives exposures as phase three implementation of uncleared margin rules kicked in on September 1, bringing smaller dealers and the first buy-side firm into scope for initial margin on bilateral trades. In listed markets, where IM jumped by 13%, surging year-end equity volatility may also have contributed.
When it comes to credit risk, the picture is mixed. The Options Clearing Corporation estimates its largest aggregate stress loss on the default of a single participant at $4.1 billion, slightly down on a year earlier. LCH’s peak stress loss, at $4 billion, jumped 48% compared with a year previously.
Cleared interest rate swaps
Let’s start with the largest over-the-counter product, interest rate swaps and quarterly trends.
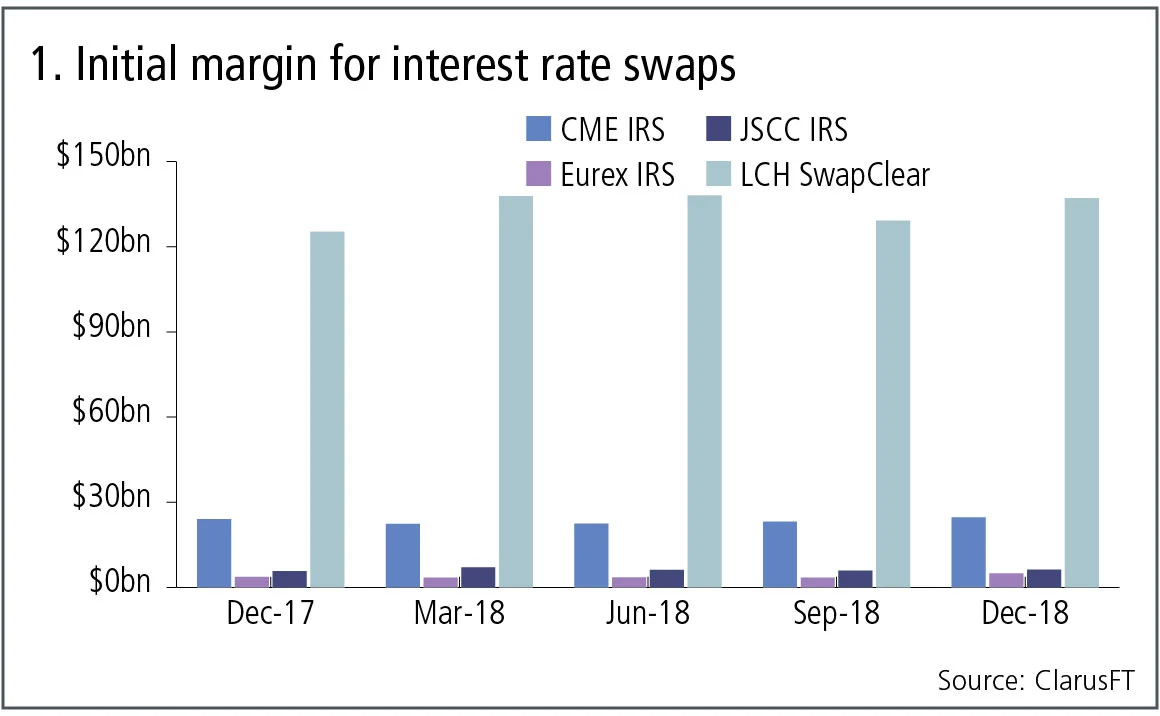
Figure 1 shows:
- LCH SwapClear the largest with $137 billion initial margin on December 31, 2018, which is up 16% in sterling terms from a year earlier, an absolute amount of £14.7 billion ($19.2 billion).
- CME IRS is next with $24.7 billion, up 3% from a year earlier.
- JSCC IRS with $6.3 billion, up 6% in yen terms.
- Eurex IRS with $5 billion, up 40% in euro terms.
The cumulative total for these four clearing services is $173 billion on December 31, 2018, an increase of 9% from the $159 billion a year earlier.
Cleared credit default swaps
Let’s turn next to credit default swaps, both index and single name.
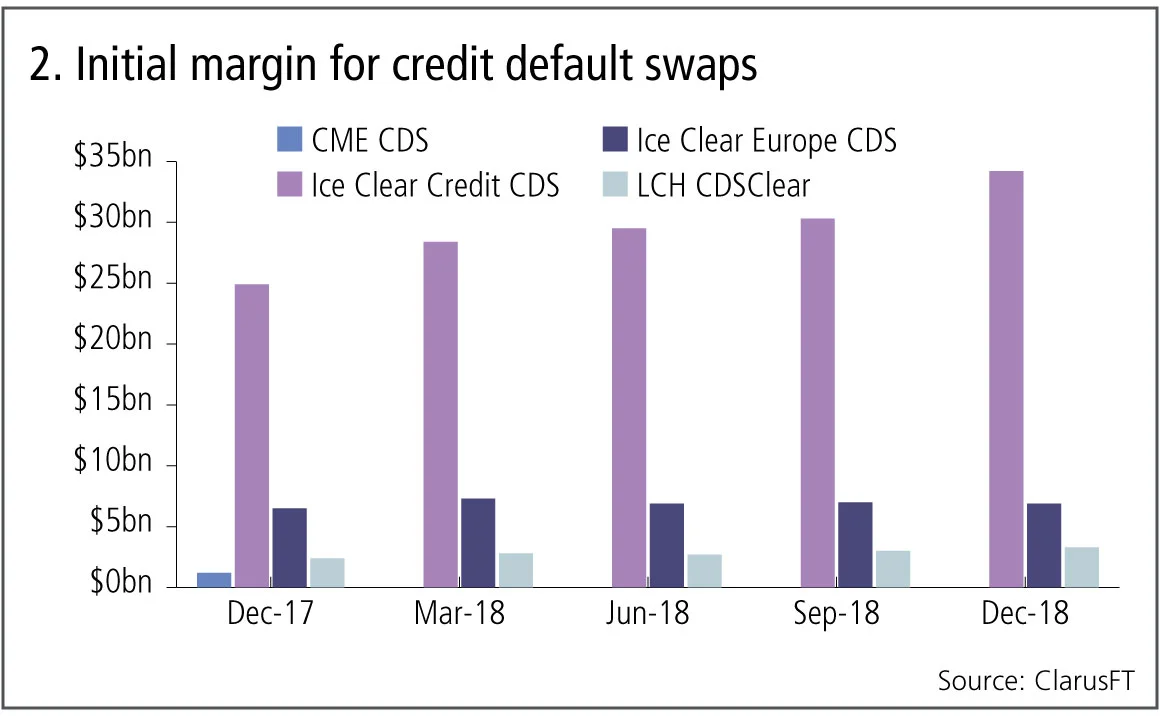
Figure 2 shows:
- Ice Clear Credit the largest with $34.2 billion, up 37% or $9.3 billion from a year earlier.
- Ice Clear Europe is next with $6.9 billion, up 12% in euro terms.
- LCH CDSClear with $3.3 billion, up 42% in euro terms.
- CME CDS is no longer active.
The cumulative total for these three clearing services is $44.4 billion on December 31, 2018, an increase of 27% from the $35 billion a year earlier.
Futures and options
Next, exchange-traded derivatives, namely futures and options, and see if these markets show similar growth trends in initial margin.
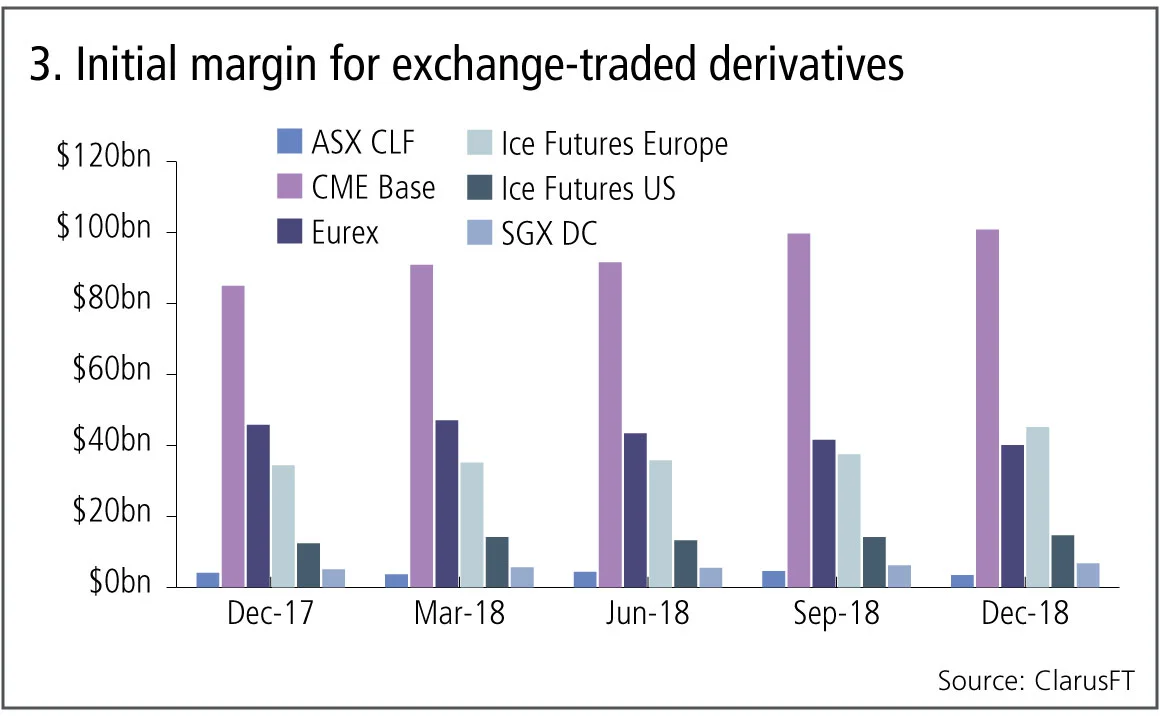
Figure 3 shows:
- CME Base the largest with $100.8 billion, up 18% or $15.7 billion from a year earlier.
- Ice Futures Europe is next with $45.2 billion, up 31% in US dollar terms, the first time its initial margin is higher than Eurex.
- Eurex with $40.1 billion, down 8% in euro terms.
- Ice Futures US with $14.7 billion, up 19%.
- SGX DC with $6.3 billion, up 33%.
- ASX CLF with $3.5 billion, down 14%.
The cumulative total for these six clearing services is $211 billion on December 31, 2018, an increase of 13% from the $187 billion a year earlier.
Cash movements
Next, let’s look at the maximum total variation margin received on a single day in the quarter for selected clearing services.
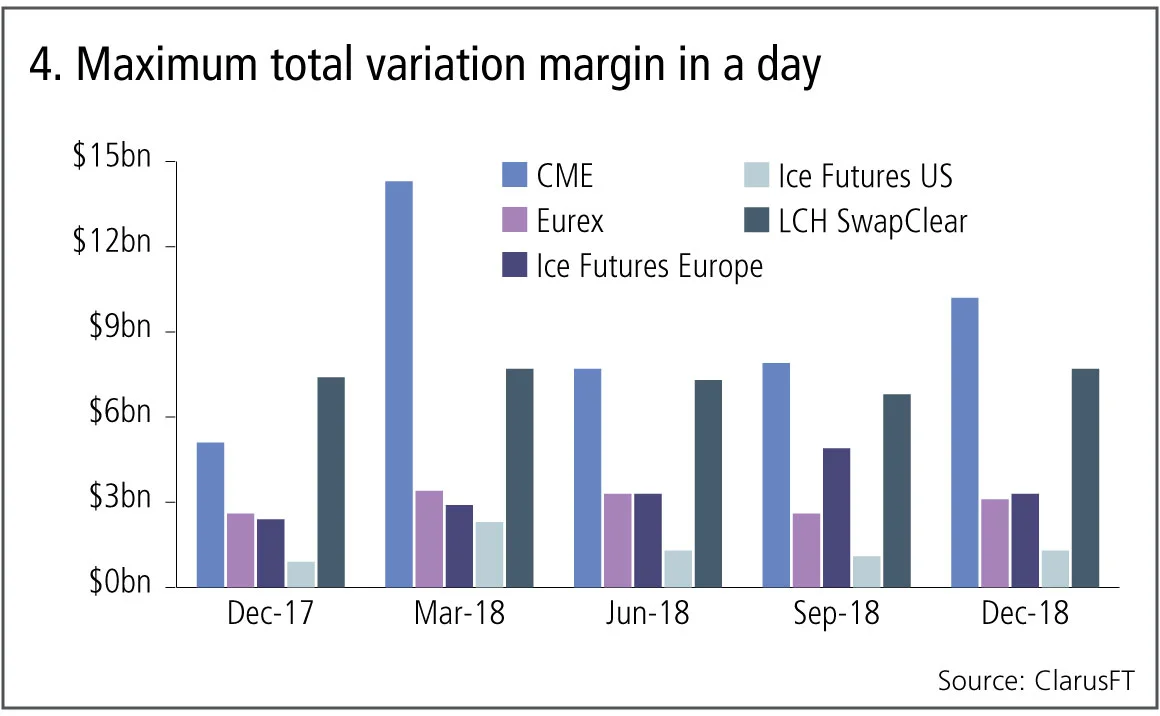
Figure 4 shows:
- The quarter ending March 31, 2018 remains the largest, with a $31 billion total for these five clearing services, while the most recent quarter total was $25.6 billion.
- CME with the largest total in the most recent quarter of $10.2 billion.
Credit risk
Now let’s change focus and look at a credit risk disclosure; the estimated largest aggregate stress loss – in excess of initial margin – that would be caused by the default of any single participant and its affiliates in extreme but plausible market conditions expressed as a peak day amount in the past 12 months.
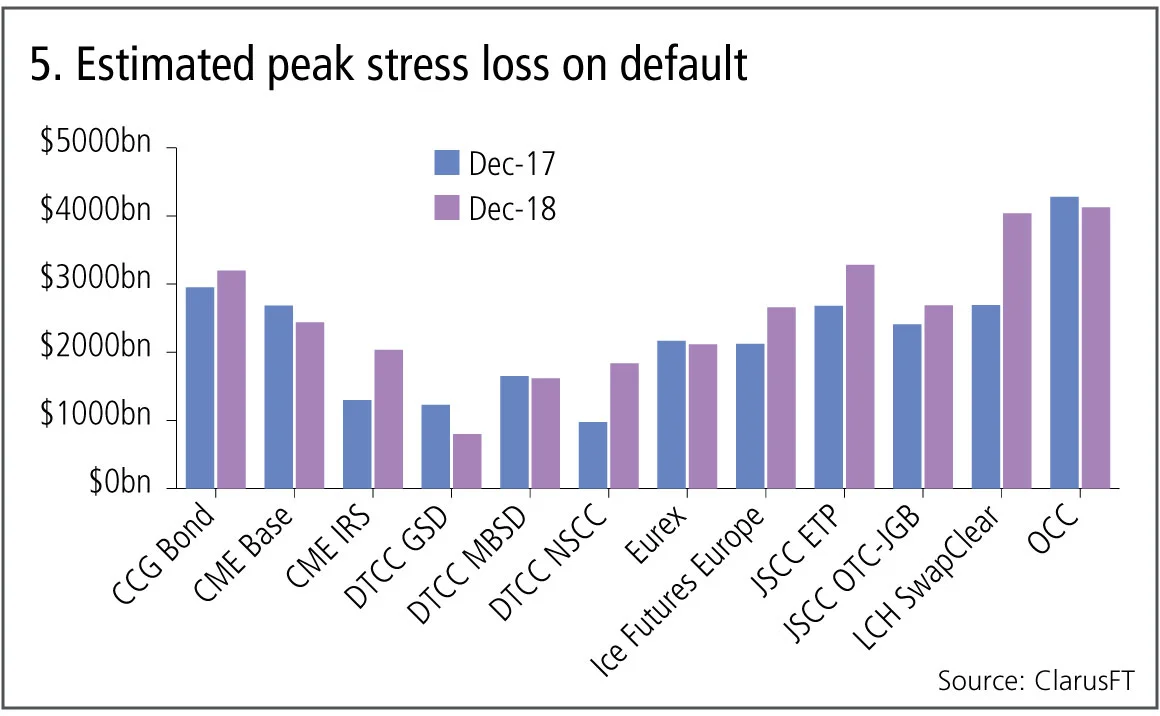
Figure 5 shows:
- Twelve clearing services where this exposure is greater than $1 billion in the year ending December 31, 2018.
- OCC is the largest with $4.1 billion and is slightly down from a year earlier.
- LCH SwapClear is next with $4 billion, significantly up from $2.7 billion a year earlier.
- JSCC ETP (Index Futures & Options) and CCG Bond each with greater than $3 billion and higher than a year earlier.
Large amounts indeed, but we know these are extreme stress losses and these members will have significant default fund contributions in addition to their initial margin.
There is another disclosure, the actual largest aggregate credit exposure – in excess of initial margin – to any single participant and its affiliates, also expressed as a peak day amount in the past 12 months.
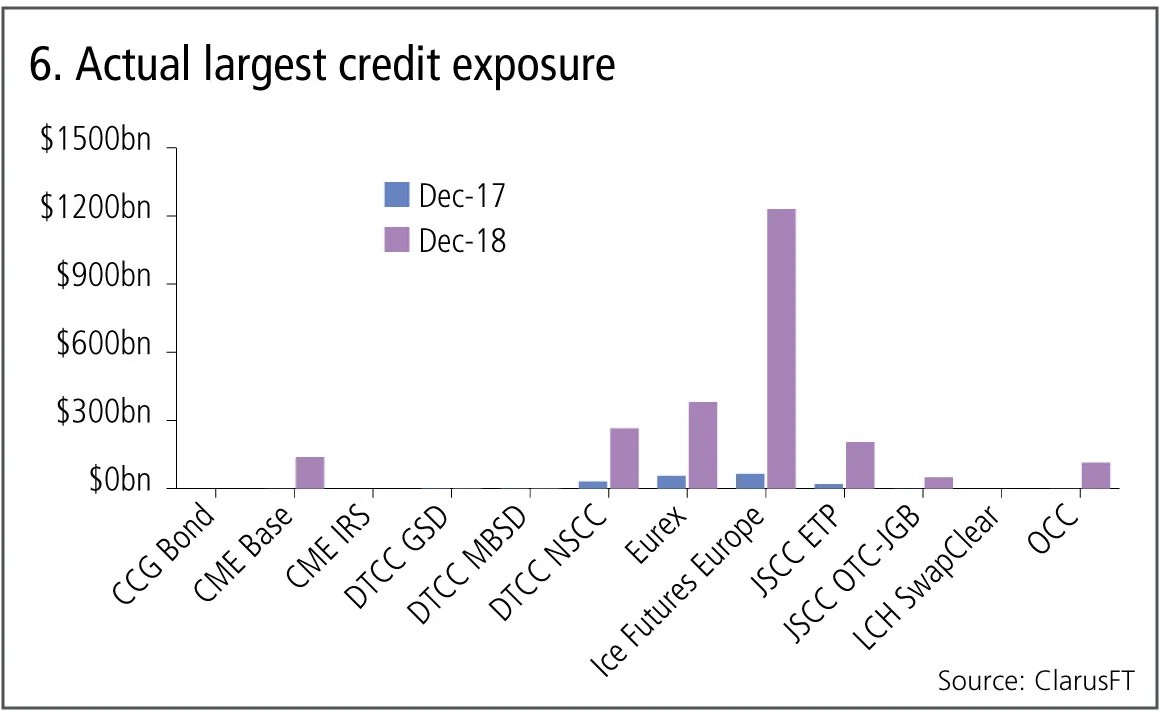
Figure 6 shows:
- Seven of the 12 clearing services have a non-zero number.
- Ice Futures Europe is by far the largest at $1.2 billion, massively up from $65 million a year earlier.
- Eurex with $324 million and DTCC NSCC with $235 million.
Ice Futures Europe disclosures for the quarter ending September 2018 (not shown) also show the $1.2 billion number, so it may be related to the extreme market moves in energy markets around the time of the Einar Aas default at Nasdaq.
While $1.2 billion is a large number and almost four times higher than the next largest clearing service, it is some comfort to know that it is far less than the estimated stress losses of $2.1 billion and $2.6 billion for Ice Futures Europe in figure 5. It would be a real worry if it was not.
Amir Khwaja is chief executive of Clarus Financial Technology
Only users who have a paid subscription or are part of a corporate subscription are able to print or copy content.
To access these options, along with all other subscription benefits, please contact info@risk.net or view our subscription options here: http://subscriptions.risk.net/subscribe
You are currently unable to print this content. Please contact info@risk.net to find out more.
You are currently unable to copy this content. Please contact info@risk.net to find out more.
Copyright Infopro Digital Limited. All rights reserved.
As outlined in our terms and conditions, https://www.infopro-digital.com/terms-and-conditions/subscriptions/ (point 2.4), printing is limited to a single copy.
If you would like to purchase additional rights please email info@risk.net
Copyright Infopro Digital Limited. All rights reserved.
You may share this content using our article tools. As outlined in our terms and conditions, https://www.infopro-digital.com/terms-and-conditions/subscriptions/ (clause 2.4), an Authorised User may only make one copy of the materials for their own personal use. You must also comply with the restrictions in clause 2.5.
If you would like to purchase additional rights please email info@risk.net
More on Comment
Podcast: Abi-Jaber and Li on a ‘sticky’ volatility problem
The pair discuss their model to jointly capture Vix, SPX and SSR

Markets perceive the future in very distorted ways
Discounting paradigms should adapt to be more realistic, says Jean-Philippe Bouchaud

Op risk data: Cyber hacks shake crypto protocols
Also: JP Morgan fined over investor losses; Symetra’s Methodist pensions mess. Data by ORX News

Prediction markets can be a canary in the coal mine
Prices of contracts on the likes of Polymarket can act as signals for risk management and hedging, says risk expert

How AI agents can join the dots for risk managers
Citi risk expert outlines agentic AI tool that would pull together structured and unstructured data on trading and lending approvals to create single, unified view of risk

Op risk data: Corporate spies spell trouble for BBVA
Also: BofA buttonholed for alleged Epstein links; minority shareholders take a bite of Brookfield. Data by ORX News

The rise of AI politics
AI should not be treated as just another technology, writes MAS adviser David Hardoon

AI risk management and the shift to capability control
By reframing validation, banks can align innovation with regulatory demands and maintain robust risk discipline, argues risk manager
