
Credit data: rate hikes put borrowers on the rack
Default risk climbing for heavily indebted companies as US rate hikes continue, says David Carruthers

The guillotine and the rack are very different instruments. One does the job quickly: the blade comes down and the head comes off. The rack applies pressure – and pain – for a long, long time.
Rate hikes are often seen more as guillotine than as rack, and for equity investors, that’s probably fair enough: each decision to hike has an immediate impact on implied growth prospects and stock prices.
But for existing borrowers, a hiking cycle is a slow, steady increase in pressure. That pressure can be seen in a divergence in banks’ estimates of default risk for US companies with a low debt ratio and those with a higher ratio.
Up to December 2016, when the Federal Reserve hiked the range for the Fed funds rate by 25 basis points – only its second hike in the post-crisis period, and first since the previous December – companies at both ends of the debt ratio spectrum had been performing similarly. Credit quality for the group had dipped by a bit less than 5% since the start of the year. But after the hike, the two sets of companies start to look very different.
Since that point, there have been six further hikes in the rate – taking it to an upper bound of 2.25%. Over the period, companies with a debt ratio of more than 75% have seen their default risk increase by nearly 40%. In contrast, companies with a debt ratio of less than 10% have had a one-tenth improvement in default risk.
Elsewhere this month, we look at how Brexit anxiety is affecting UK financials and corporates relative to their European Union rivals; at the dramatic upswing in credit quality for US oil companies, and a credit transition matrix for large corporate borrowers based on banks’ default estimates.
Global credit industry trends
The latest bank-sourced credit data, based on 27 contributor banks, shows that upgrade and downgrade activity has slowed, with 50 companies moving more than one notch, a 40% decrease from last month. Figure 1 shows detailed industry migration trends for the most recent published data, based on data adjusted for changes in contributor mix.
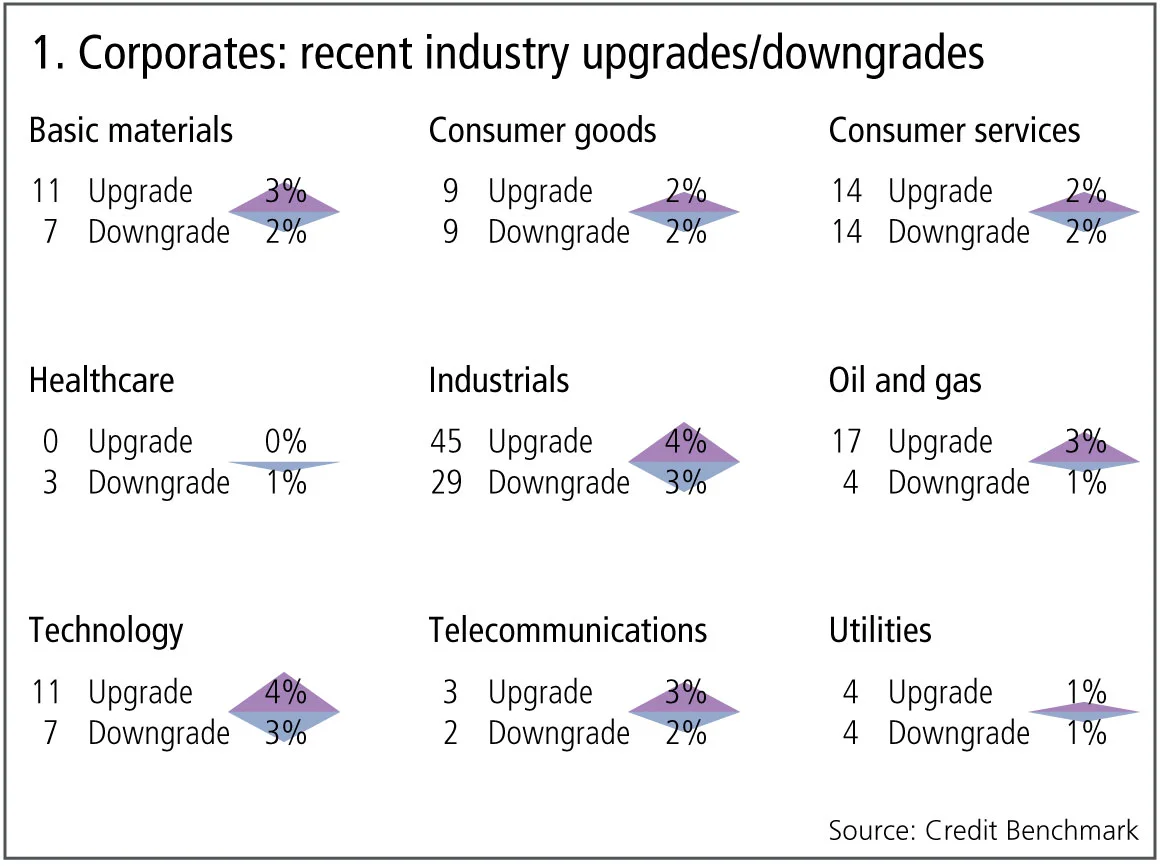
Figure 1 shows:
- Across global corporates, the number of upgrades outweigh the number of downgrades.
- Upgrades dominate downgrades in four of the nine industries, one industry is biased towards downgrades and four industries are in balance.
- Basic materials, oil and gas, and telecommunications continue their trend of the past few months, with upgrades outweighing downgrades.
- Industrials return to upgrades favouring downgrades after a month of balance.
- Healthcare continues its trend of downgrades outweighing upgrades for the second month.
- Consumer services and utilities continue to be stable for the second month.
- Consumer goods return to stability after a month downgrades outnumbering upgrades.
- Technology continues to be volatile with a change now in favour of downgrades.
US highly indebted companies
Recent Fed rate hikes highlight the broader impact of rising yield curves on heavily indebted companies. After years of loan extensions, commercial banks face a significant opportunity cost in continuing to support high-debt companies, some of which may fall into the so-called “zombie” category where cashflow only covers interest service costs.
The chart shows credit trends over the past two years for around 500 US companies at either end of the debt spectrum, using the debt ratio – that is, debt is measured as a percentage of enterprise value. The left-hand axis plots the percentage change in default risk over this period.
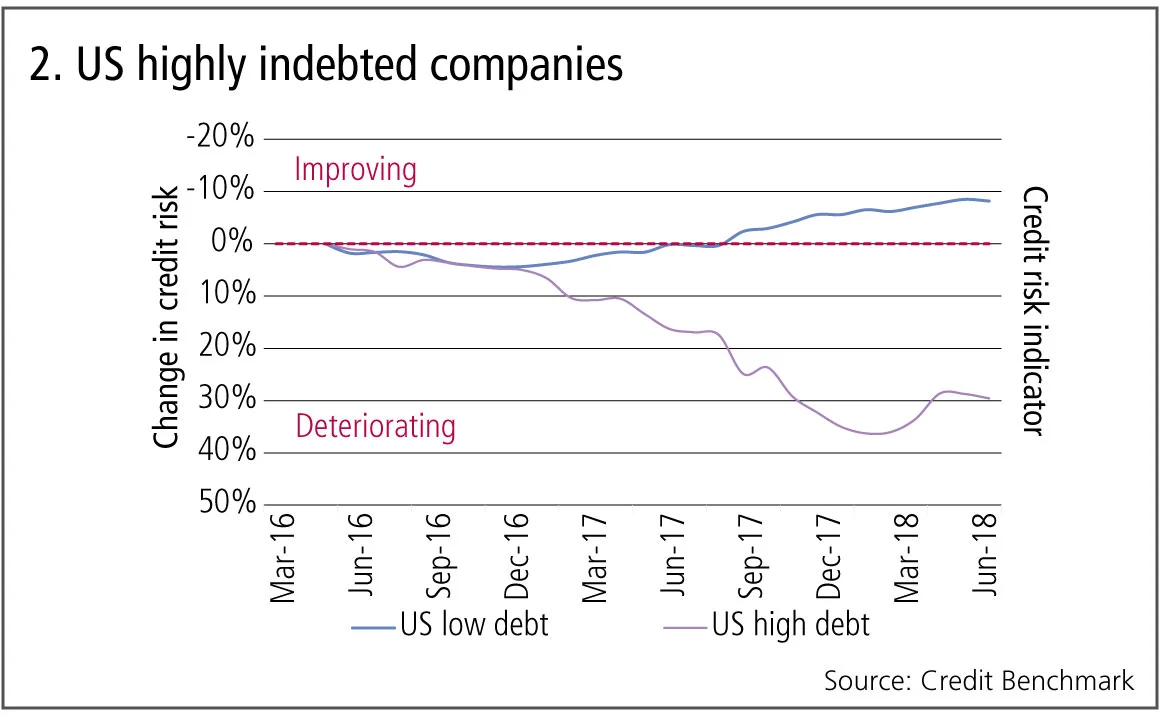
Figure 2 shows:
- Companies with low – less than 10% – debt ratios have had a 10% credit risk improvement in the past 18 months.
- Those with high debt ratios of more than 75% – typically with already poor credit ratings – have deteriorated further, by nearly 40%.
- Since this rate-tightening cycle is expected to take some time, heavily indebted companies and their lenders face a lengthy and potentially painful adjustment.
The Brexit effect: UK vs EU
Recent UK GDP growth has lagged behind the EU, with Brexit-related uncertainty as the main probable cause. Deloitte recently reported that “Brexit anxiety” is at its highest level since the 2016 referendum. As the Brexit process enters its final phase, one key issue is how the final deal will affect goods compared with services. Figure 3 compares the bank credit views for the UK and EU ex-UK across large financials and corporates.
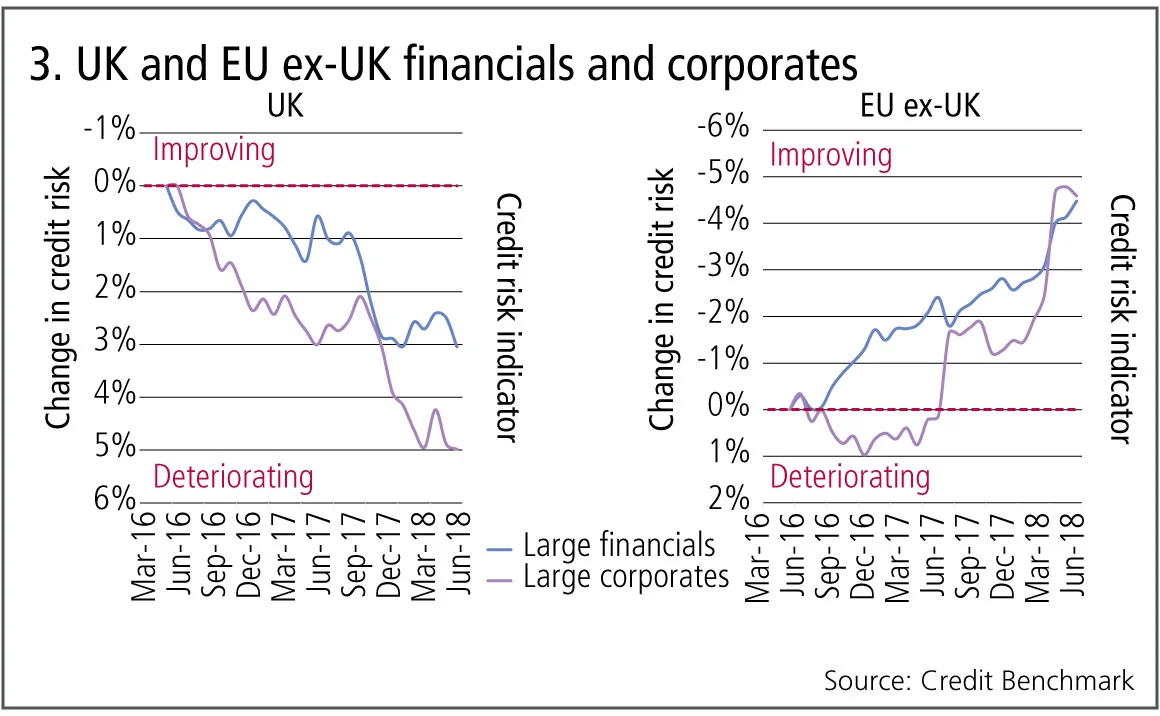
Figure 3 shows:
- In the UK, large financials and corporates show a modest (3–5%) increase in credit risk.
- In the EU ex-UK, large financials and corporates show a modest (5%) decline in credit risk.
- The UK deterioration is slightly higher for corporates.
- While these partly reflect current GDP growth differences, “Brexit anxiety” is likely to be a key driver. However, the scale is modest, with a maximum differential of 10%. This is likely to expand in a “no deal” scenario, but current bank views suggest that a deal is expected.
US oil and gas
The oil price remains close to a four-year high, driven up by sanctions on Iran, signs that the Organization of the Petroleum Exporting Countries will struggle to increase production and recent weather-related disruption to conventional US oil supplies. But oil supply is always difficult to predict: US shale production is ramping up and continues to take market share from the Middle East. Some equity analysts have turned positive on the sector because they expect a sustained supply squeeze, but bank data shows that US oil has already seen a major improvement in credit quality.
Figure 4 plots the credit trends for US oil and gas over the past two-and-a-half years.
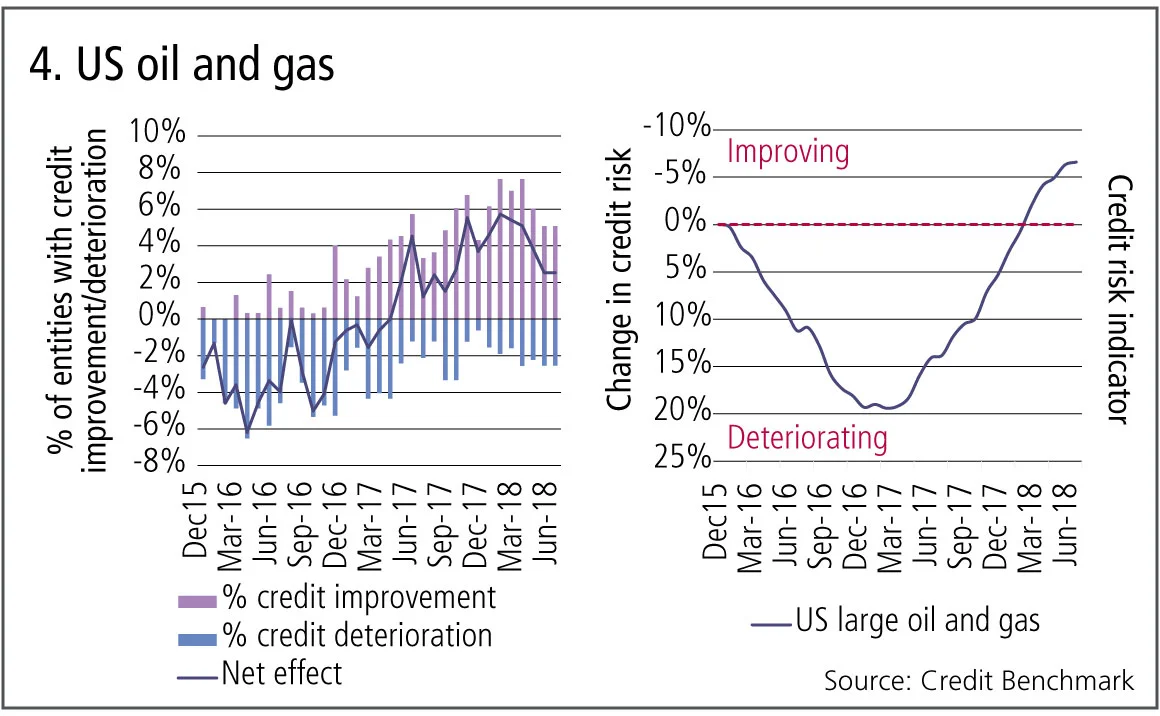
Figure 4 shows:
- The balance of consensus upgrades moved strongly into positive territory from the middle of 2017.
- This coincided with an improvement in the credit risk indicator, a rebased average of default risk estimates.
- The balance of upgrades is still positive but declining.
- The improvements in credit risk appear to be stabilising.
Transition matrix update
Bank-sourced data currently supports more than 40 different one-year and two-year credit transition matrices. Some of these draw on very large – more than 10,000 observation – panel datasets recording changes in banks views.
Figure 5 shows the one-year credit transition matrix for large corporate borrowers across the developed economies, based on more than 40,000 observations. The aaa row and column are excluded due to Basel floor issues.
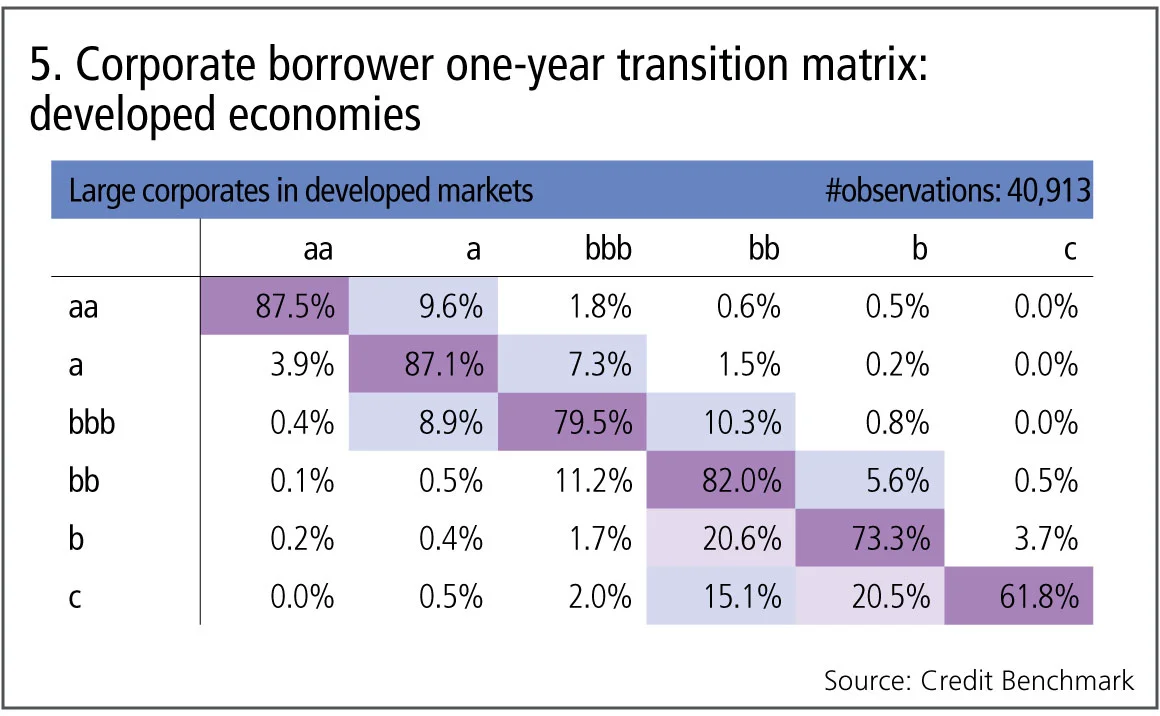
Figure 5 shows:
- The leading diagonal is not strictly monotonic; a larger proportion of borrowers have moved in either direction out of the bbb category, leaving 79.5% unchanged, compared with the bb category with 82% unchanged.
- Despite this anomaly, the leading diagonal, based on cross-sectional data, is similar to those of the long-run matrices published by the main rating agencies. A key difference is the c category, which is noticeably higher in bank data. This is mainly because a significant – more than 10% – number of low-quality companies rated by the agencies transition to the non-rated category.
- Upgrades dominate downgrades in non-investment-grade categories while downgrades outnumber upgrades in investment-grade categories.
About this data
The Credit Benchmark dataset is based on internally modelled credit ratings from a pool of contributor banks. These are mapped into a standardised 21-bucket ratings scale, so downgrades and upgrades can be tracked on a monthly basis. Obligors are only included where ratings have been contributed by at least three different banks, yielding a total dataset of more than 22,000 names.
David Carruthers is head of research at Credit Benchmark.
Only users who have a paid subscription or are part of a corporate subscription are able to print or copy content.
To access these options, along with all other subscription benefits, please contact info@risk.net or view our subscription options here: http://subscriptions.risk.net/subscribe
You are currently unable to print this content. Please contact info@risk.net to find out more.
You are currently unable to copy this content. Please contact info@risk.net to find out more.
Copyright Infopro Digital Limited. All rights reserved.
As outlined in our terms and conditions, https://www.infopro-digital.com/terms-and-conditions/subscriptions/ (point 2.4), printing is limited to a single copy.
If you would like to purchase additional rights please email info@risk.net
Copyright Infopro Digital Limited. All rights reserved.
You may share this content using our article tools. As outlined in our terms and conditions, https://www.infopro-digital.com/terms-and-conditions/subscriptions/ (clause 2.4), an Authorised User may only make one copy of the materials for their own personal use. You must also comply with the restrictions in clause 2.5.
If you would like to purchase additional rights please email info@risk.net
More on Comment
Podcast: Abi-Jaber and Li on a ‘sticky’ volatility problem
The pair discuss their model to jointly capture Vix, SPX and SSR

Markets perceive the future in very distorted ways
Discounting paradigms should adapt to be more realistic, says Jean-Philippe Bouchaud

Op risk data: Cyber hacks shake crypto protocols
Also: JP Morgan fined over investor losses; Symetra’s Methodist pensions mess. Data by ORX News

Prediction markets can be a canary in the coal mine
Prices of contracts on the likes of Polymarket can act as signals for risk management and hedging, says risk expert

How AI agents can join the dots for risk managers
Citi risk expert outlines agentic AI tool that would pull together structured and unstructured data on trading and lending approvals to create single, unified view of risk

Op risk data: Corporate spies spell trouble for BBVA
Also: BofA buttonholed for alleged Epstein links; minority shareholders take a bite of Brookfield. Data by ORX News

The rise of AI politics
AI should not be treated as just another technology, writes MAS adviser David Hardoon

AI risk management and the shift to capability control
By reframing validation, banks can align innovation with regulatory demands and maintain robust risk discipline, argues risk manager
