Credit data: Brexit gloom lifting for UK companies?
David Carruthers of Credit Benchmark looks at the most recent trends in bank-sourced credit data

Economically, the world is doing well. Growth forecasts paint a picture of strong, synchronous expansion across the globe. Of course, there are laggards, and one is the UK, with its relative underperformance often chalked up to the uncertainty wreaked by the country’s 2016 vote to end its membership of the European Union.
This was the scenario that Remain campaigners, who wanted the UK to stay in the EU, warned about. But it did not kick in as quickly as some expected. A previous analysis of default probabilities (PDs) for UK companies, using data for the 12 months to April 2017, showed credit risk increasing after initially seeming resilient to the vote.
Now, the data shows an improvement in the strength of certain sectors. Over the past three months, there has been a significant increase in strength for consumer goods, telecommunications and utilities companies. Default risk for the basic materials sector has worsened over that timeframe, but the longer-term trend is positive.
What does all of this mean? It may simply be that a rising tide elsewhere in the world is lifting the UK’s slightly leaky boats. The long-term outlook is hard to assess, and there may be signs of that in a more detailed look at the basic materials sector. In other cases, when credit quality improves, banks use it as an opportunity to lend to riskier companies, but that does not appear to be happening here; one explanation is that lenders are being particularly careful.
Also this month, we compare credit risk trends in the UK and the US – assessing the credit risk ranking and credit risk trends of financials and health services – and we review the diversity of banks’ PD estimates by industry.
Global credit industry trends
Figure 1 shows industry migration trends for the most recently published data.
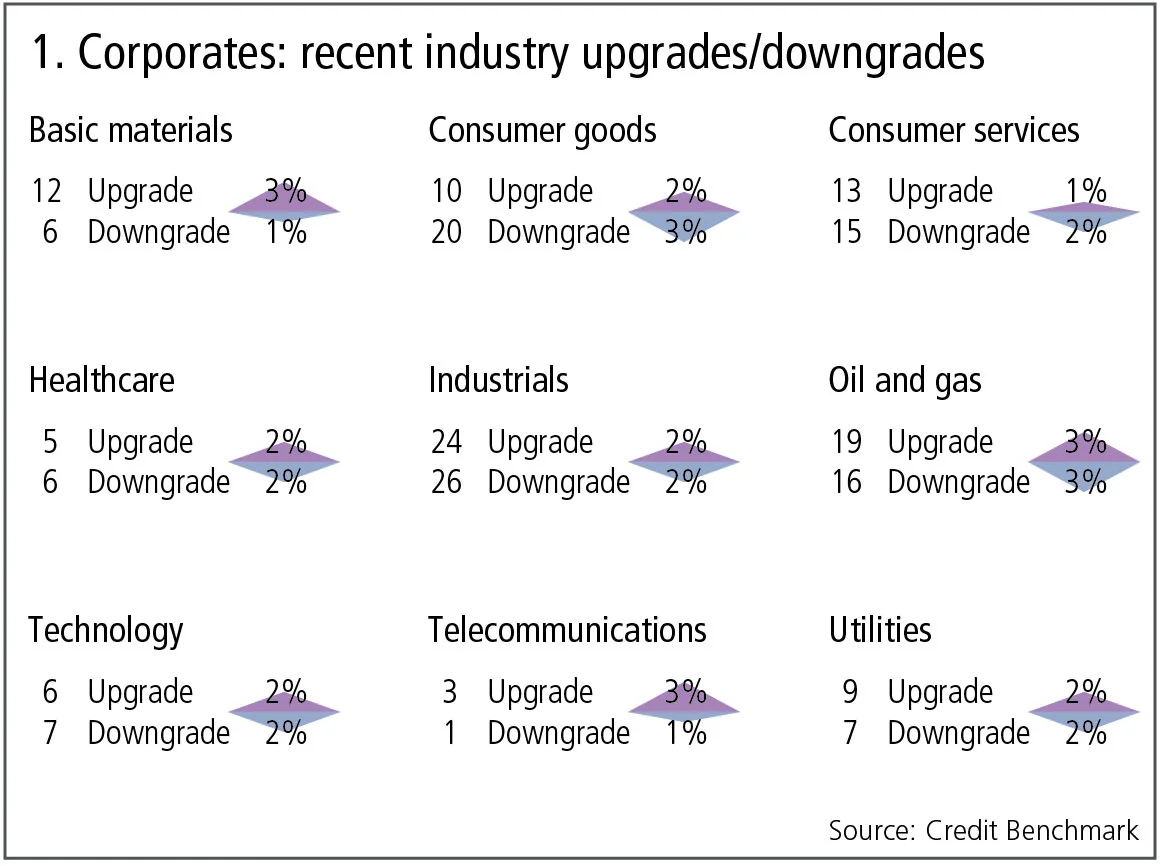
Figure 1 shows:
- Global corporate downgrades and upgrades are balanced, with 2% of global corporate obligors deteriorating and the same proportion improving.
- There are four industries where upgrades outnumber downgrades and five industries where downgrades dominate. The imbalance between upgrades and downgrades has generally reduced.
- Basic materials and utilities continue to show a bias towards upgrades, repeating the pattern of the past two months.
- In healthcare, downgrades have dominated upgrades for four consecutive months, but the imbalance has significantly reduced. The balance in telecommunications has moved in favour of upgrades after four months when downgrades predominated.
- Consumer services, industrials and technology are broadly balanced.
- Consumer goods have reverted back to the recent pattern of downgrades outnumbering upgrades.
- Oil and gas shows an imbalance in favour of upgrades.
Credit risk after the EU referendum
There is considerable debate about the impact of the EU referendum vote on the UK economy, both now and in the future. The Bank of England has publicly acknowledged there has been less of an immediate impact on growth than initially expected, while the currency has recovered most of its losses. In the interim, currency weakness has boosted inflation, but has also been good for the export sector. With rising interest rates, private finance initiative problems and ongoing negotiations with the EU, the future remains uncertain, but the credit trends are encouraging. After some extended declines, a number of UK industries are showing improvements in the bank-sourced credit view. Figure 2 shows the most recent three-month changes by industry and the longer-term trend for the basic materials industry.

Figure 2 shows:
- Industries such as consumer goods, utilities and telecommunications all show significant reductions in credit risk over the most recent three months. Increases in oil and gas, and technology are minimal.
- The basic materials industry shows a recent increase in credit risk. But, over the past 15 months, the various baskets used to track the UK basic materials industry have moved from non-investment grade to investment grade.
- The basket levels have converged in recent months. This is unusual – it is more typical for banks to extend credit to lower-quality obligors when overall credit improves. This may suggest banks are being particularly cautious in their lending policies in this industry, but it could also mean the credit risk estimates for all industry borrowers are increasingly similar.
- Although there are several months where consensus upgrades and downgrades have been in balance, the overall picture favours upgrades, with a particularly dramatic spike in June 2017.
Transatlantic comparisons
Global stock markets had a strong January, appearing to confirm the popular view of a global, synchronised economic boom. However, synchronisation can work in either direction. The financial sector is large and diverse, and regulatory changes are being framed and implemented in differing ways across different regions. But there are some common factors: the phased removal of quantitative easing has already led to some interest rate increases, which are largely beneficial for the sector; and global growth is leading an expansion in what are now well-capitalised bank balance sheets. Healthcare, meanwhile, faces a funding crisis in several geographies and the pharmaceutical sector is suffering from a lack of new blockbuster drugs, clouding its growth outlook and leading to an equity de-rating. These contrasting fortunes are reflected in the credit data.
Figure 3 shows the contrasting credit trends for these two large industry groups in Europe and North America.

Figure 3 shows:
- Credit risk in financials has been improving steadily, particularly in North America. Europe has traditionally been a better credit risk, but North America is closing the gap.
- Healthcare in Europe has shown a steady credit deterioration, but North America is now heading in the same direction.
- As with financials, North American healthcare has closed the historic gap with Europe and has now crossed over; it is viewed as a slightly better credit risk. If these trends continue, healthcare could slip below investment grade.
Transatlantic industry credit rankings
Some industries, such as oil and gas, are traditionally viewed as ‘global’, especially in respect of their equity price correlations. Credit profiles tend to be more geographically specific. In this section, we look at the relative credit rankings of the main industries in Europe and North America.

Figure 4 shows:
- North American industries show significantly greater dispersal in credit risk than those of Europe.
- In both regions, utilities and financials have the highest credit quality.
- In both regions, healthcare and consumer goods are currently almost identical, but note the time-series changes in healthcare in the previous section.
- Oil and gas occupies a similar rank in both regions, at or close to the lowest ranking, but North American oil and gas shows lower credit quality.
- The rank order is not identical across the regions, but the rank differences are not material – industrials is the only industry to show a significantly different rank.
Credit risk estimates: diversity by industry for US and UK
Bank-sourced credit data provides insight into the diversity of bank estimates. This is significant for a number of reasons: diversity supports a broad and liquid credit market due to competing views of the same borrower; diversity helps to control systemic risk – at the macro level, differences in opinion help to avoid concentration in specific industries or geographies; and differences in diversity by industry show where bank views are least clustered, suggesting more uncertainty on the credit outlook.
Figure 5 shows the interquartile range for each industry. Each bar represents a large number of individual borrowers and the metric used is the relative standard deviation. For example, if the average PD estimate for a borrower across 10 banks is 15 basis points and the standard deviation of those estimates is 10bp, then the relative standard deviation is 10/15 = 0.66.

Figure 5 shows:
- Credit views for UK utilities and UK telecommunications show tight ranges (close agreement between banks).
- US basic materials and UK industrials show the widest ranges.
- In the top chart, three industries in each region have been highlighted with a red outline: basic materials, oil and gas, and utilities. The right-hand chart shows each of these in detail, showing that in utilities and basic materials, the range of relative standard deviations is significantly wider for the US compared with the UK; in basic materials the median standard deviation is also higher in the US; and in oil and gas the median standard deviation is higher in the UK.
- These types of chart highlight where the banks are in agreement or highly divergent in their views. Large divergences are typical in lower-quality obligors, but if they are present in otherwise high-quality industries it may indicate an impending reduction in credit quality.
About this data
The Credit Benchmark dataset is based on internally modelled credit ratings from a pool of contributor banks. These are mapped into a standardised 21-bucket ratings scale, so downgrades and upgrades can be tracked on a monthly basis. Obligors are only included where ratings have been contributed by at least three different banks, yielding a total dataset of roughly 13,000 names, which is growing by 5% per month.
David Carruthers is the head of research at Credit Benchmark, a credit risk data provider.
Only users who have a paid subscription or are part of a corporate subscription are able to print or copy content.
To access these options, along with all other subscription benefits, please contact info@risk.net or view our subscription options here: http://subscriptions.risk.net/subscribe
You are currently unable to print this content. Please contact info@risk.net to find out more.
You are currently unable to copy this content. Please contact info@risk.net to find out more.
Copyright Infopro Digital Limited. All rights reserved.
As outlined in our terms and conditions, https://www.infopro-digital.com/terms-and-conditions/subscriptions/ (point 2.4), printing is limited to a single copy.
If you would like to purchase additional rights please email info@risk.net
Copyright Infopro Digital Limited. All rights reserved.
You may share this content using our article tools. As outlined in our terms and conditions, https://www.infopro-digital.com/terms-and-conditions/subscriptions/ (clause 2.4), an Authorised User may only make one copy of the materials for their own personal use. You must also comply with the restrictions in clause 2.5.
If you would like to purchase additional rights please email info@risk.net
More on Comment
Markets perceive the future in very distorted ways
Discounting paradigms should adapt to be more realistic, says Jean-Philippe Bouchaud

Op risk data: Cyber hacks shake crypto protocols
Also: JP Morgan fined over investor losses; Symetra’s Methodist pensions mess. Data by ORX News

Prediction markets can be a canary in the coal mine
Prices of contracts on the likes of Polymarket can act as signals for risk management and hedging, says risk expert

How AI agents can join the dots for risk managers
Citi risk expert outlines agentic AI tool that would pull together structured and unstructured data on trading and lending approvals to create single, unified view of risk

Op risk data: Corporate spies spell trouble for BBVA
Also: BofA buttonholed for alleged Epstein links; minority shareholders take a bite of Brookfield. Data by ORX News

The rise of AI politics
AI should not be treated as just another technology, writes MAS adviser David Hardoon

AI risk management and the shift to capability control
By reframing validation, banks can align innovation with regulatory demands and maintain robust risk discipline, argues risk manager

Tokenised commodities could help oil the machine
Shifting physical assets onto the blockchain eases collateral frictions, argues crypto expert